A survey was undertaken from July 2021 to January 2022 in South-Cameroon on the biodiversity of micro-arthopods in the Memve’ele dam (Site 1), the tributary river (Site 2) and the adjacent river (Sites 3 and 4). Four abiotic parameters were measured in-situ while nine other abiotic parameters were measured in the laboratory using standard methods. Micro-arthopods were counted and identified. Water quality was determined. BOD5, conductivity, NO2-, NO3-, pH, PO43-, temperature and suspended solids were on average within the standards for drinking water. Chlorophyll a, color, DO, NH4+ and turbidity values were on average above the standard upper limits. Based on the water quality index (WQI) raw waters were unfit for direct drinking (Dam: WQI=898.864; Site 2: WQI=752.451; Site 3: WQI=883.808; and Site 4: WQI=1,665.883) and presented ideal conditions for fish farming or irrigation for agriculture. A total of 5,487 specimens belonged to three classes, eight orders, 20 families, 57 genera, and 87 species and morphospecies (54 freshwater and 33 tolerant species able to develop in at least two water environments). Ectocyclops sp. was the most recorded species (10.6%), followed by Cyclops sp. (9.1%), Alona costata (8.9%), Mesocyclops sp. (7.9%), Tropocyclops sp. (7.5%), Senecella calanoides (6.8%), Diaphanosoma sarsi (6.1%), while other species were represented each by less than 5.0%. Low species richness, high species diversity and a very low dominance by a few species were noted. Assemblages were highly even (Pielou’s index close to 1). Species exhibited in all sites, a positive global net association. The assemblage recorded during the wet season at Site 3 functioned as a pioneer community (Broken-Stick model) while, the assemblage recorded during the dry season at Site 2 and the one recorded during the dry season at Site 3 functioned as nomocenosis (log-linear or log-normal models) and were therefore little evolved. In contrast, during the two seasons in the dam and Site 4, as well as during the rainy season in Site 2 and the combined seasons in Site 3, the assemblages functioned as highly evolved communities (Zipf or Zipf-models) with significant regenerative force, suggesting that these assemblages maintained a complex information network developed at spatio-temporal scales. The evolved state (close to natural balance) of the micro-arthopods communities should be preserved and protected.
| Published in | International Journal of Ecotoxicology and Ecobiology (Volume 9, Issue 2) |
| DOI | 10.11648/j.ijee.20240902.11 |
| Page(s) | 56-87 |
| Creative Commons |
This is an Open Access article, distributed under the terms of the Creative Commons Attribution 4.0 International License (http://creativecommons.org/licenses/by/4.0/), which permits unrestricted use, distribution and reproduction in any medium or format, provided the original work is properly cited. |
| Copyright |
Copyright © The Author(s), 2024. Published by Science Publishing Group |
Freshwater Species, Aquatic Arthropods, Species Composition, Assemblage Functioning, Water Quality
A. Site 1: mean ± se | B. Site 2: Mean ± se | |||||
|---|---|---|---|---|---|---|
Parameters (WHO standards) | I (n=2) | II (n=2) | Total (n=4) | I (n=2) | II (n=2) | Total (n=4) |
BOD5 (Norm: 0-1500 mg.l-1) | 52.5±7.5 | 27.5±17.5 | 40.0±10.6 | 15.0±5.0 | 22.5±2.5 | 18.8±3.2 |
Chl. a (Norm: 0-0.01 mg.l-1) | 0.11±0.09 | 0.08±0.03 | 0.10±0.04 | 0.13±0.05 | 0.03±0.01 | 0.08±0.04 |
Colour (Norm: 5-15.0 Pt-Co) | 28.0±6.0 | 40.0±14.0 | 34.0±7.1 | 12.0±1.0 | 19.5±6.5 | 15.8±3.4 |
Cond. (Norm: 0-1500 µS.cm-1) | 488.0±72.0 | 511.5±56.5 | 499.8±38.0 | 844.5±54.5 | 897.5±124.5 | 871.0±57.6 |
DO (norm: 5.8-7.0 mg.l-1) | 69.0±0.0 | 60.5±16.5 | 64.8±7.2 | 71.5±6.5 | 59.5±22.5 | 65.5±10.2 |
NH4+ (Norm: 0-0.2 mg.l-1) | 0.12±0.05 | 0.07±0.04 | 0.09±0.03 | 0.08±0.04 | 0.050±0.005 | 0.05±0.02 |
NO2- (Norm: 3 mg.l-1) | 0.16±0.05 | 0.33±0.29 | 0.25±0.13 | 0.20±0.15 | 0.08±0.07 | 0.14±0.07 |
NO3- (Norm: 0-45 mg.l-1) | 0.14±0.03 | 0.72±0.02 | 0.43±0.17 | 0.59±0.45 | 0.15±0.09 | 0.37±0.23 |
pH (Norm: 6.5-8.5 CU) | 6.7±0.1 | 7.0±0.1 | 6.8±0.1 | 6.13±0.02 | 6.3±0.1 | 6.3±0.1 |
PO43- (Norm: 0.01-1.0 mg.l-1) | 0.84±0.11 | 0.78±0.06 | 0.81±0.05 | 1.39±0.61 | 0.07±0.03 | 0.73±0.45 |
Temp. (Norm: 20-32°C) | 27.7±0.2 | 26.8±0.2 | 27.3±0.3 | 28.3±0.5 | 27.4±0.4 | 27.8±0.4 |
Turbidity (Norm: 5.0-20.0 FTU) | 19.5±3.5 | 66.0±12.0 | 42.8±14.4 | 13.5±7.5 | 35.0±9.0 | 24.3±7.8 |
SS (Norm: 0-1200 mg.l-1) | 90.5±11.5 | 74.5±12.5 | 82.5±8.3 | 17.5±3.5 | 41.5±0.5 | 29.5±7.1 |
C. Site 3: mean ± se | D. Site 4: Mean ± se | |||||
|---|---|---|---|---|---|---|
Parameters (WHO standards) | I (n=2) | II (n=2) | Total (n=4) | I (n=2) | II (n=2) | Total (n=4) |
BOD5 (Norm: 0-1500 mg.l-1) | 15.0±0.0 | 12.5±7.5 | 13.8±3.2 | 100.0±5.0 | 92.5±17.5 | 96.3±7.7 |
Chl. a (Norm: 0-0.01 mg.l-1) | 0.13±0.04 | 0.02±0.00 | 0.07±0.03 | 0.12±0.05 | 0.24±0.17 | 0.18±0.08 |
Colour (Norm: 5-15.0 Pt-Co) | 24.0±0.0 | 27.0±16.0 | 25.5±6.6 | 70.5±19.5 | 85.5±17.5 | 78.0±11.5 |
Cond. (Norm: 0-1500 µS.cm-1) | 571.5±27.5 | 690.0±12.0 | 630.8±36.3 | 795.0±5.0 | 689.0±25.0 | 742.0±32.3 |
DO (Norm: 5.8-7.0 mg.l-1) | 74.5±18.5 | 52.5±11.5 | 63.5±10.9 | 77.0±0.0 | 64.5±2.5 | 70.8±3.5 |
NH4+ (Norm: 0-0.2 mg.l-1) | 0.10±0.09 | 0.09±0.07 | 0.10±0.05 | 0.06±0.03 | 0.04±0.01 | 0.05±0.01 |
NO2- (Norm: 0-3 mg.l-1) | 0.24±0.08 | 0.11±0.00 | 0.15±0.06 | 0.12±0.01 | 0.24±0.11 | 0.18±0.05 |
NO3- (Norm: 0-45 mg.l-1) | 1.21±0.50 | 0.11±0.01 | 0.66±0.38 | 0.74±0.46 | 0.33±0.16 | 0.53±0.23 |
pH (Norm: 6.5-8.5 CU) | 7.2±0.1 | 6.7±0.1 | 6.9±0.2 | 6.7±0.3 | 7.0±0.1 | 6.9±0.2 |
PO43- (Norm: 0.01-1.0 mg.l-1) | 1.61±0.55 | 0.60±0.12 | 1.10±0.37 | 0.40±0.07 | 0.47±0.00 | 0.44±0.03 |
Temp. (Norm: 20-32°C) | 27.4±0.2 | 26.9±0.1 | 27.1±0.2 | 27.0±0.2 | 25.2±0.6 | 26.1±0.6 |
Turbidity (Norm: 5.0-20.0 FTU) | 43.5±1.5 | 71.0±2.0 | 57.3±8.0 | 47.5±19.5 | 98.5±18.5 | 73.0±18.4 |
SS (Norm: 0-1200 mg.l-1) | 26.0±17.0 | 48.0±7.0 | 37.0±9.8 | 48.0±7.0 | 68.5±9.5 | 58.3±7.6 |
Two-way ANOVA | Rivers: df=3; Seasons: df=1; Rivers x Seasons: df=3; residual: df=8; Total variation: df=15 | |||||
Source of variation | BOD5 | Chl. a | Color | Cond. | DO | NH4+ | NO2- | NO3- |
|---|---|---|---|---|---|---|---|---|
Sites | 1.2x10⁻⁴ * | 0.493 ns | 0.005 * | 0.001 * | 0.943 ns | 0.649 ns | 0.875 ns | 0.776 ns |
Seasons | 0.354 ns | 0.574 ns | 0.314 ns | 0.612 ns | 0.166 ns | 0.349 ns | 0.924 ns | 0.139 ns |
Sites x Seasons | 0.463 ns | 0.447 ns | 0.963 ns | 0.354 ns | 0.956 ns | 0.935 ns | 0.640 ns | 0.111 ns |
Source of variation | pH | PO43- | Temp | Turb. | TSS |
|---|---|---|---|---|---|
Sites | 0.002 * | 0.241 ns | 0.007 * | 0.014 * | 0.003 * |
Seasons | 0.557 ns | 0.024 * | 0.003 * | 0.002 * | 0.108 ns |
Sites x Seasons | 0.026 * | 0.116 ns | 0.385 ns | 0.526 ns | 0.211 ns |
Classes /Orders / Families/ Species | Site 1 (Dam) | Site 2 | Site 3 | Site 4 | ||||||||||
|---|---|---|---|---|---|---|---|---|---|---|---|---|---|---|
I | II | III | I | II | III | I | II | III | I | II | III | Global (%) | ||
Branchiopoda Latreille, 1817 / Anomopoda G. O. Sars, 1865 / Chydoridae Dybowski & Grochowski, 1894 | ||||||||||||||
Acroperus aduncus ■, ●, # | - | - | - | 4 | 10 | 14 | - | - | - | - | - | - | 14 (0.3) | |
Ac. angustatus # | 1 | - | 1 | - | - | - | - | - | - | - | - | - | 1 (0.02) | |
Ac. harpae ■, ●, # | - | - | - | - | - | - | - | - | - | 2 | 2 | 4 | 4 (0.07) | |
Alona costata ●, # | 409 | 11 | 420 | 14 | 28 | 42 | 2 | 5 | 7 | 19 | 3 | 22 | 491 (8.9) | |
Al. guttata # | 21 | - | 21 | 1 | 10 | 11 | 1 | 1 | 2 | 7 | - | 7 | 41 (0.7) | |
Al. natalensis # | - | - | - | - | - | - | - | - | - | 4 | 4 | 8 | 8 (0.1) | |
Al. protzi # | 7 | - | 7 | 2 | 17 | 19 | - | - | - | - | - | - | 26 (0.5) | |
Al. quadrangularis ■, ●, # | 8 | - | 8 | - | - | - | - | - | - | - | - | - | 8 (0.1) | |
Al. rectangula ●, # | 11 | 5 | 16 | 4 | 5 | 9 | - | - | - | - | - | - | 25 (0.5) | |
Al. rustica # | 4 | 4 | 8 | 4 | 8 | 12 | - | 2 | 2 | 4 | 6 | 10 | 32 (0.6) | |
Alonella excisa # | 5 | 11 | 16 | 3 | - | 3 | - | - | - | 5 | - | 5 | 24 (0.4) | |
Biapertura affinis # | 4 | 3 | 7 | - | - | - | - | - | - | 3 | 2 | 5 | 12 (0.2) | |
Bi. intermedia # | 10 | 12 | 22 | 29 | 5 | 34 | 4 | - | 4 | - | - | - | 60 (1.1) | |
Camptocercus rectirostris # | - | 4 | 4 | 2 | 3 | 5 | - | - | - | 2 | - | 2 | 11 (0.2) | |
Chydorus gibbus #, | 3 | - | 3 | - | - | - | - | - | - | - | - | - | 3 (0.05) | |
Ch. ovalis ●, # | 26 | 2 | 28 | - | - | - | 1 | 1 | 2 | 14 | 8 | 22 | 52 (0.9) | |
Ch. piger #, | 13 | - | 13 | - | - | - | 1 | - | 1 | 21 | 1 | 22 | 36 (0.7) | |
Ch. sphaericus ■, ●, # | 10 | 2 | 12 | 4 | - | 4 | 5 | - | 5 | 15 | - | 15 | 36 (0.7) | |
Euryalona orientalis # | 2 | 9 | 11 | 1 | - | 1 | - | - | - | - | - | - | 12 (0.2) | |
Karualona karua # | 7 | 15 | 22 | - | - | - | - | - | - | - | - | - | 22 (0.4) | |
Kurzia latissima # | 12 | - | 12 | - | - | - | 1 | - | 1 | 8 | 1 | 9 | 22 (0.4) | |
Ku. longirostris # | 21 | - | 21 | 13 | 5 | 18 | 2 | - | 2 | 19 | - | 19 | 60 (1.1) | |
Leberis diaphanus # | 2 | 4 | 6 | 2 | - | 2 | - | - | - | 2 | - | 2 | 10 (0.2) | |
Leydigia acanthocercoides ●, # | 8 | 14 | 22 | - | - | - | - | - | - | - | - | - | 22 (0.4) | |
Ly. quadrangularis # | - | - | - | 2 | - | 2 | - | - | - | - | - | - | 2 (0.04) | |
Nicsmirnovius eximius # | 20 | 11 | 31 | 11 | 3 | 14 | - | - | - | 6 | 1 | 7 | 52 (0.9) | |
Oxyurella singalensis # | 2 | - | 2 | - | - | - | - | - | - | 2 | - | 2 | 4 (0.07) | |
Picripleuroxus denticulatus # | 6 | 4 | 10 | 25 | 12 | 37 | 1 | 3 | 4 | 74 | 47 | 121 | 172 (3.1) | |
Pi. laevis # | 13 | 23 | 36 | 6 | 3 | 9 | 2 | - | 2 | 15 | 12 | 27 | 74 (1.3) | |
Classes /Orders / Families/ Species | Site 1 (Dam) | Site 2 | Site 3 | Site 4 | ||||||||||
|---|---|---|---|---|---|---|---|---|---|---|---|---|---|---|
I | II | III | I | II | III | I | II | III | I | II | III | Global (%) | ||
Branchiopoda Latreille, 1817 / Anomopoda G. O. Sars, 1865 / Chydoridae Dybowski & Grochowski, 1894 (Continued) | ||||||||||||||
Pi. striatus # | 7 | 7 | 14 | - | - | - | - | - | - | 5 | 3 | 8 | 22 (0.4) | |
Pleuroxus aduncus ●, # | 17 | - | 17 | 2 | 3 | 5 | - | - | - | 21 | 3 | 24 | 46 (0.8) | |
Pl. trigonellus # | 4 | 4 | 8 | 4 | 5 | 9 | - | 2 | 2 | 14 | 4 | 18 | 37 (0.7) | |
Pl. uncinatus # | 4 | 2 | 6 | 1 | 5 | 6 | - | - | - | - | - | - | 12 (0.2) | |
Rhynchotalona falcata # | - | - | - | - | - | - | - | - | - | 6 | 1 | 7 | 7 (0.1) | |
R. kistarae #, | 8 | 9 | 17 | 4 | 3 | 7 | - | - | - | 11 | 1 | 12 | 36 (0.7) | |
Rhynchotalona sp. # | - | - | - | - | - | - | - | - | - | 1 | - | 1 | 1 (0.02) | |
Tretocephala ambigua # | 9 | 2 | 11 | 4 | 3 | 7 | - | - | - | 6 | 3 | 9 | 27 (0.5) | |
Branchiopoda / Anomopoda / Daphniidae Straus, 1820 | ||||||||||||||
Ceriodaphnia cornuta ●, # | 2 | 3 | 5 | 1 | 3 | 4 | - | - | - | - | 3 | 3 | 12 (0.2) | |
Ce. megops # | - | - | - | - | - | - | - | - | - | 1 | - | 1 | 1 (0.02) | |
Ce. quadrangula ●, # | - | - | - | - | - | - | - | - | - | 2 | - | 2 | 2 (0.04) | |
Ceriodaphnia sp. ●, # | - | - | - | - | - | - | 1 | - | 1 | - | - | - | 1 (0.02) | |
Daphnia curvirostris # | - | 2 | 2 | - | - | - | - | - | - | - | - | - | 2 (0.04) | |
Da. lumholtzi # | 69 | 46 | 115 | - | - | - | - | - | - | - | - | - | 115 (2.1) | |
Da. obtusa # | - | - | - | 2 | 2 | - | - | - | 1 | 1 | 3 (0.05) | |||
Daphnia sp. ■, ●, # | - | - | - | 13 | 23 | 36 | 4 | 9 | 13 | 30 | 17 | 47 | 96 (1.7) | |
Simocephalus exspinosus ●, # | 4 | - | 4 | - | - | - | - | - | - | - | - | - | 4 (0.07) | |
Sm. vetulus ●, # | 2 | 8 | 10 | - | - | - | - | - | - | - | - | - | 10 (0.2) | |
Branchiopoda / Anomopoda / Ilyocryptidae Smirnov, 1976 | ||||||||||||||
Ilyocryptus acutifrons ●, # | 7 | - | 7 | - | - | - | - | - | - | 1 | - | 1 | 8 (0.1) | |
I. agilis ●, # | 6 | 3 | 9 | - | - | - | - | - | - | - | - | - | 9 (0.2) | |
I. sordidus ●, # | - | - | - | - | - | - | 2 | 1 | 3 | - | - | - | 3 (0.05) | |
Branchiopoda / Anomopoda / Macrothricidae Norman & Brady, 1867 | ||||||||||||||
Drepanothrix dentata # | 1 | - | 1 | - | - | - | - | - | - | - | - | - | 1 (0.02) | |
Streblocerus serricaudatus # | 44 | 9 | 53 | - | - | - | - | - | - | 1 | - | 1 | 54 (1.0) | |
Branchiopoda / Anomopoda / Moinidae Goulden, 1968 | ||||||||||||||
Moina brachiata ●, # | 46 | 25 | 71 | 1 | - | 1 | - | - | - | 3 | - | 3 | 75 (1.4) | |
Mo. macrocopa # | 53 | 26 | 79 | - | - | - | - | - | - | 3 | 4 | 7 | 86 (1.6) | |
Mo. micrura ●, # | 53 | 13 | 66 | 1 | - | 1 | - | - | - | 1 | - | 1 | 68 (1.2) | |
Moinodaphnia macleayi # | 1 | 28 | 29 | - | - | - | - | - | - | - | - | - | 29 (0.5) | |
Branchiopoda / Ctenopoda G. O. Sars, 1865 / Sididae Baird, 1850 | ||||||||||||||
Diaphanosoma brachyurum ■, ●, # | 1 | 10 | 11 | - | - | - | - | - | - | - | - | - | 11 (0.2) | |
Di. sarsi # | 208 | 100 | 308 | 13 | 5 | 18 | - | - | - | 6 | 3 | 9 | 335 (6.1) | |
Classes /Orders / Families/ Species | Site 1 (Dam) | Site 2 | Site 3 | Site 4 | ||||||||||
|---|---|---|---|---|---|---|---|---|---|---|---|---|---|---|
I | II | III | I | II | III | I | II | III | I | II | III | Global (%) | ||
Branchiopoda / Haplopoda G. O. Sars, 1865 / Leptodoridae Lilljeborg, 1861 | ||||||||||||||
Leptodora kindtii ●, # | 3 | 12 | 15 | - | - | - | - | - | - | 2 | - | 2 | 17 (0.3) | |
Branchiopoda / Onychopoda G. O. Sars, 1865 / Cercopagididae Mordukhai-Boltovskoi, 1968 | ||||||||||||||
Bythotrephes longimanus ■, ●, # | - | 4 | 4 | - | - | - | - | - | - | - | - | - | 4 (0.07) | |
Branchiopoda / Onychopoda / Polyphemidae Baird, 1845 | ||||||||||||||
Polyphemus pediculus ●, # | 43 | 2 | 45 | - | - | - | - | - | - | - | - | - | 45 (0.8) | |
Copepoda Milne Edwards, 1840 / Calanoida Sars G. O., 1903 / Aetideidae Giesbrecht, 1892 | ||||||||||||||
Senecella calanoides ●, # | 55 | 320 | 375 | - | - | - | - | - | - | - | - | - | 375 (6.8) | |
Copepoda / Calanoida / Centropagidae Giesbrecht, 1892 | ||||||||||||||
Undetermined 1 ■, ●, # | - | 5 | 5 | - | - | - | - | - | - | - | - | - | 5 (0.09) | |
Copepoda / Calanoida / Undetermined family | ||||||||||||||
Undetermined 2 ■, ●, # | - | - | - | 15 | 23 | 38 | - | - | - | 38 | 18 | 56 | 94 (1.7) | |
Copepoda / Calanoida / Diaptomidae Baird, 1850 | ||||||||||||||
Diaptomus sp. # | 6 | 5 | 11 | - | - | - | - | - | - | - | - | - | 11 (0.2) | |
Paradiaptomus sp. # | - | - | - | - | - | - | - | - | - | - | 3 | 3 | 3 (0.05) | |
Scapholeberis kingi # | 11 | 10 | 21 | - | - | - | - | - | - | - | - | - | 21 (0.4) | |
Thermodiaptomus sp. # | - | - | - | - | - | - | - | - | - | 4 | - | 4 | 4 (0.07) | |
Tropodiaptomus sp. # | - | - | - | - | - | - | - | - | - | 5 | - | 5 | 5 (0.09) | |
Copepoda / Calanoida / Pseudodiaptomidae Sars G. O., 1902 | ||||||||||||||
Pseudodiaptomus sp. ■, ●, # | - | 22 | 22 | - | 5 | 5 | - | - | - | - | - | - | 27 (0.5) | |
Copepoda / Cyclopoida Burmeister, 1834 / Cyclopettidae Martínez Arbizu, 2000 | ||||||||||||||
Limnoithona sinensis ●, # | - | 10 | 10 | - | - | - | 1 | 1 | 2 | - | - | - | 12 (0.2) | |
Copepoda / Cyclopoida / Cyclopidae Rafinesque, 1815 | ||||||||||||||
Abdiacyclops sp. # | - | - | - | 7 | - | 7 | - | - | - | - | 28 | 28 | 35 (0.6) | |
Afrocyclops sp. # | 44 | 26 | 70 | 2 | 8 | 10 | - | - | - | 6 | 6 | 12 | 92 (1.7) | |
Allocyclops sp. # | - | - | - | - | - | - | - | - | 3 | 1 | 4 | 4 (0.07) | ||
Cryptocyclops sp. # | 14 | 24 | 38 | 5 | - | 5 | - | - | - | 8 | 5 | 13 | 56 (1.0) | |
Ectocyclops sp. # | 164 | 187 | 351 | 23 | 96 | 119 | - | 3 | 3 | 89 | 17 | 106 | 579 (10.6) | |
Eucyclops sp. ■, # | 11 | - | 11 | 2 | 10 | 12 | - | - | - | 8 | 1 | 9 | 32 (0.6) | |
Mesocyclops sp. # | 157 | 195 | 352 | 14 | 35 | 49 | - | 3 | 3 | 24 | 4 | 28 | 432 (7.9) | |
Microcyclops sp. # | 4 | 48 | 52 | 1 | - | 1 | - | - | - | 5 | 1 | 6 | 59 (1.1) | |
Paracyclops sp. # | 3 | - | 3 | - | - | - | - | - | - | - | - | - | 3 (0.05) | |
Thermocyclops sp. # | 63 | 57 | 120 | - | 15 | 15 | - | 3 | 3 | 11 | 8 | 19 | 157 (2.9) | |
Tropocyclops sp. # | 255 | - | 255 | 18 | 63 | 81 | - | 6 | 6 | 58 | 12 | 70 | 412 (7.5) | |
Undetermined 3 ■, ●, # | 116 | 168 | 284 | 27 | 38 | 65 | - | 17 | 17 | 69 | 64 | 133 | 499 (9.1) | |
Classes /Orders / Families/ Species | Site 1 (Dam) | Site 2 | Site 3 | Site 4 | ||||||||||
|---|---|---|---|---|---|---|---|---|---|---|---|---|---|---|
I | II | III | I | II | III | I | II | III | I | II | III | Global (%) | ||
Copepoda / Cyclopoida / Halicyclopidae Kiefer, 1927 | ||||||||||||||
Undetermined 4 ●, # | 11 | 9 | 20 | - | - | - | - | - | - | 19 | - | 19 | 39 (0.7) | |
Copepoda / Harpacticoida Sars G. O., 1903 / Harpacticidae Dana, 1846 | ||||||||||||||
Harpacticella sp. # | - | 7 | 7 | - | 5 | 5 | - | - | - | - | - | - | 12 (0.2) | |
Copepoda / Harpacticoida / Laophontidae Scott T., 1904 | ||||||||||||||
Undetermined 5 ■, ●, # | - | - | - | - | - | - | - | - | - | - | 1 | 1 | 1 (0.02) | |
Ostracoda Latreille, 1802 / Podocopida Sars, 1866 / Cyprididae Baird, 1845 | ||||||||||||||
Stenocypris major # | - | - | - | - | 3 | 3 | - | - | - | - | - | - | 3 (0.05) | |
Total | 2,131 | 1,542 | 3,673 | 28 | 57 | 85 | 684 | 298 | 982 | 285 | 462 | 747 | 5,487 (100.0) | |
Environments | Site 1 (dam) | Site 2 | Site 3 | |||||||
|---|---|---|---|---|---|---|---|---|---|---|
I (%) | II (%) | Total (%) | I (%) | II (%) | Total (%) | I (%) | II (%) | Total (%) | ||
A. Freshwater specialists (54 species, 62.1% of the total species richness) | ||||||||||
n (%) | 1,282 (23.4) | 894 (16.3) | 2,176 (39.7) | 197 (3.6) | 314 (5.7) | 511 (9.3) | 12 (0.2) | 23 (0.4) | 35 (0.6) | |
S (%) | 39 (44.8) | 31 (35.6) | 42 (48.3) | 25 (28.7) | 22 (25.3) | 29 (33.3) | 7 (8.0) | 8 (9.2) | 13 (14.9) | |
Min.-Max. | 1-255 | 2-195 | 1-352 | 1-29 | 2-96 | 1-119 | 1-4 | 1-6 | 1-6 | |
Mean ± se | 33±10 | 29±9 | 52±14 | 8±2 | 14±5 | 18±5 | 2±0 | 3±1 | 3±0 | |
B. Tolerant species (33 species, 37.9% of the total species richness) | ||||||||||
B1. Freshwater and brackish water specialists (20 species, 23.0% of the total species richness) | ||||||||||
n (%) | 703 (12.8) | 437 (8.0) | 1,140 (20.8) | 23 (0.4) | 39 (0.7) | 62 (1.1) | 7 (0.1) | 8 (0.1) | 15 (0.3) | |
S (%) | 16 (18.4) | 14 (16.1) | 17 (19.5) | 6 (6.9) | 4 (4.6) | 6 (6.9) | 5 (5.7) | 4 (4.6) | 5 (5.7) | |
Min.-Max. | 2-409 | 2-320 | 4-420 | 1-14 | 3-28 | 1-42 | 1-2 | 1-5 | 1-7 | |
Mean ± se | 44±25 | 31±22 | 67±31 | 4±2 | 10±6 | 10±6 | 1±0 | 2±1 | 3±1 | |
B2. Freshwater and marine water specialists (one species, 1.1% of the total species richness) | ||||||||||
n (%) | 11 (0.2) | - | 11 (0.2) | 2 (0.04) | 10 (0.2) | 12 (0.2) | - | - | - | |
B3. Freshwater, brackish water and marine water specialists (12 species, 13.8% of the total species richness) | ||||||||||
n (%) | 135 (2.5) | 211 (3.8) | 346 (6.3) | 63 (1.1) | 99 (1.8) | 162 (3.0) | 9 (0.2) | 26 (0.5) | 35 (0.6) | |
S (%) | 4 (4.6) | 6 (6.9) | 7 (8.0) | 5 (5.7) | 5 (5.7) | 6 (6.9) | 2 (2.3) | 2 (2.3) | 3 (3.4) | |
Min.-Max. | 1-116 | 2-168 | 4-284 | 4-27 | 5-38 | 4-65 | 4-5 | 9-17 | 5-17 | |
Mean ± se | 34±27 | 35±27 | 49±39 | 13±4 | 20±6 | 27±10 | 5±1 | 13±4 | 12±4 | |
Total tolerant species | ||||||||||
n (%) | 849(15.5) | 648(11.8) | 1,497(27.3) | 88(1.6) | 148(2.7) | 236(4.3) | 16(0.3) | 34(0.6) | 50(0.9) | |
S (%) | 21 (24.1) | 20 (23.0) | 25 (28.7) | 12(13.8) | 10(11.5) | 13(14.9) | 7(8.0) | 6 (6.9) | 8(9.2) | |
Min.-Max. | 1-409 | 2-320 | 4-420 | 1-27 | 3-38 | 1-65 | 1-5 | 1-17 | 1-17 | |
Mean ± se | 40±19 | 32±17 | 60±23 | 7±2 | 15±4 | 18±6 | 2±1 | 6±3 | 6±2 | |
Global | 2,131(38.8) | 1,542(28.1) | 3,673(66.9) | 285(5.2) | 462(8.4) | 747(13.6) | 28(0.5) | 57(1.0) | 85(1.5) | |
Environments | Site 4 | Pooled sites | |||||
|---|---|---|---|---|---|---|---|
I (%) | II (%) | Total (%) | I (%) | II (%) | Total (%) | ||
A. Freshwater specialists (54 species, 62.1% of the total species richness) | |||||||
n (%) | 440 (8.0) | 178 (3.2) | 618 (11.3) | 1,931 (35.2) | 1,409 (25.7) | 3,340 (60.9) | |
S (%) | 35 (40.2) | 25 (28.7) | 37 (42.5) | 50 (57.5) | 44 (50.6) | 54 (62.1) | |
Min.-Max. | 1-89 | 1-47 | 1-121 | 1-331 | 1-303 | 1-579 | |
Mean ± se | 13±3 | 7±2 | 17±4 | 39±10 | 32±9 | 62±16 | |
B. Tolerant species (33 species, 37.9% of the total species richness) | |||||||
B1. Freshwater and brackish water specialists (20 species, 23.0% of the total species richness) | |||||||
n (%) | 82 (1.5) | 17 (0.3) | 99 (1.8) | 815 (14.9) | 501 (9.1) | 1,316 (24.0) | |
S (%) | 9 (10.3) | 4 (4.6) | 10 (11.5) | 20 (23.0) | 16 (18.4) | 20 (23.0) | |
Min.-Max. | 1-21 | 3-8 | 1-24 | 1-444 | 1-320 | 1-491 | |
Mean ± se | 9±3 | 4±1 | 10±3 | 41±22 | 31±19 | 66±29 | |
B2. Freshwater and marine water specialists (one species, 1.1% of the total species richness) | |||||||
n (%) | 8 (0.1) | 1 (0.02) | 9 (0.2) | 21 (0.4) | 11 (0.2) | 32 (0.6) | |
B3. Freshwater, brackish water and marine water specialists (12 species, 13.8% of the total species richness) | |||||||
n (%) | 154 (2.8) | 102 (1.9) | 256 (4.7) | 361 (6.6) | 438 (8.0) | 799 (14.6) | |
S (%) | 5 (5.7) | 5 (5.7) | 6 (6.9) | 8 (9.2) | 11 (12.6) | 12 (13.8) | |
Min.-Max. | 2-69 | 1-64 | 1-133 | 1-212 | 1-287 | 1-499 | |
Mean ± se | 31±11 | 20±11 | 43±20 | 45±25 | 40±25 | 67±40 | |
Total tolerant species | |||||||
n (%) | 244 (4.4) | 120 (2.2) | 364 (6.6) | 1,197 (21.8) | 950 (17.3) | 2,147 (39.1) | |
S (%) | 16 (18.4) | 10 (11.5) | 17 (19.5) | 29 (33.3) | 28 (32.2) | 33 (37.9) | |
Min.-Max. | 1-69 | 1-64 | 1-133 | 1-444 | 1-320 | 1-499 | |
Mean ± se | 16±5 | 12±6 | 21±8 | 41±16 | 34±15 | 65±22 | |
Global | 684 (12.5) | 298 (5.4) | 982 (17.9) | 3,128 (57.0) | 2,359 (43.0) | 5,487 (100.0) | |
A. Site 1 (dam) | B. Site 2 | C. Site 3 | |||||||
|---|---|---|---|---|---|---|---|---|---|
I | II | Total | I | II | Total | I | II | Total | |
n (%) | 2131 (38.8) | 1542 (28.1) | 3673 (66.9) | 285 | 462 | 747 | 28 (0.5) | 57 (1.0) | 85 (1.5) |
S (%) | 60 (69.0) | 51 (58.6) | 67 (77.0) | 37 (42.5) | 32 (36.8) | 42 (48.3) | 14 (16.1) | 14 (16.1) | 21 (24.1) |
nmax (%) | 409 (7.5) | 320 (5.8) | 420 (7.7) | 29 (0.5) | 96 (13.7) | 119 (2.2) | 5 (0.09) | 17 (0.3) | 17 (0.3) |
Mg | 7.698 | 6.811 | 8.040 | 6.369 | 5.053 | 6.197 | 3.901 | 3.215 | 4.502 |
d=S/n | 0.028 | 0.033 | 0.018 | 0.130 | 0.069 | 0.056 | 0.500 | 0.246 | 0.247 |
Chao1 | 61 | 51 | 67 | 40 | 32 | 44 | 18 | 16 | 21 |
SE (%) | 98.4 | 100.0 | 100.0 | 93.4 | 100.0 | 95.5 | 76.9 | 87.5 | 98.2 |
E(Sn=11) | 8±1 | 7±1 | 8±1 | 9±1 | 8±1 | 8±1 | 8±1 | 7±1 | 8±1 |
H’ (bits) | 3.042 | 2.903 | 3.193 | 3.139 | 2.862 | 3.107 | 2.451 | 2.241 | 2.703 |
H’max (bits) | 4.094 | 3.932 | 4.205 | 3.611 | 3.466 | 3.738 | 2.639 | 2.639 | 3.045 |
D | 0.082 | 0.096 | 0.065 | 0.056 | 0.089 | 0.067 | 0.102 | 0.147 | 0.092 |
N1 | 20.952 | 18.233 | 24.348 | 23.077 | 17.494 | 22.361 | 11.596 | 9.407 | 14.918 |
N2 | 12.268 | 10.434 | 15.456 | 17.816 | 11.199 | 15.029 | 9.804 | 6.784 | 10.832 |
N2/N1 | 0.586 | 0.572 | 0.635 | 0.772 | 0.640 | 0.672 | 0.845 | 0.721 | 0.726 |
J | 0.743 | 0.738 | 0.759 | 0.869 | 0.826 | 0.831 | 0.929 | 0.849 | 0.888 |
IBP | 0.192 | 0.208 | 0.114 | 0.102 | 0.208 | 0.159 | 0.179 | 0.298 | 0.200 |
D. Site 4 | Dry season vs. rainy season: Student t-test | |||||
|---|---|---|---|---|---|---|
I | II | Total | Sites | Shannon H’ | Simpson D | |
n (%) | 684 (12.5) | 298 (5.4) | 982 (17.9) | Dam | t=3.21; df=3256.4; p=0.001 | t=-3.08; df=3098.8; p=0.002 * |
S (%) | 50 (57.5) | 35 (40.2) | 54 (62.1) | Site 2 | t=3.82; df=689.63; p=1.4x10⁻⁴ * | t=-4.26; df=695.81; p=2.2x10⁻⁵ * |
nmax (%) | 89 (1.6) | 64 (1.2) | 133 (2.4) | Site 3 | t=1.09; df=65.77; p=0.280 ns | t=-1.17; df=81.41; p=0.244 ns |
Mg | 7.506 | 5.968 | 7.693 | Site 4 | t=5.31; df=530.5; p=1.6x10⁻⁷ * | t=-3.85; df=386.2; p=1.4x10⁻⁴ * |
d=S/n | 0.073 | 0.117 | 0.055 | Comparison of the Shannon-Weaver index H’ between rivers: Student t-test | ||
Chao1 | 52 | 47 | 58 | Dry season | Rainy season | |
SE (%) | 95.9 | 74.5 | 93.9 | A vs. B | t=-1.635; df=459.30; p=0.103 ns | t=0.686; df=910.12; p=0.493 ns |
E(Sn=11) | 8±1 | 8±1 | 8±1 | A vs. C | t=3.958; df=29.996; p=4.3x10⁻⁴ * | t=5.150; df=65.57; p=2.6x10⁻⁶ * |
H’ (bits) | 3.234 | 2.814 | 3.227 | A vs. D | t=-3.860; df=1340.70; p=1.2x10⁻⁴ * | t=1.188; df=456.86; p=0.235 ns |
H’max (bits) | 3.912 | 3.555 | 3.989 | B vs. C | t=-4.413; df=35.51; p=9.1x10⁻⁵ * | t=-4.636; df=76.87; p=1.4x10⁻⁵ * |
D | 0.060 | 0.097 | 0.063 | B vs. D | t=1.422; df=645.73; p=0.156 ns | t=-0.573; df=599.89; p=0.567 ns |
D. Site 4 | Dry season vs. rainy season: Student t-test | |||||
|---|---|---|---|---|---|---|
I | II | Total | Sites | Shannon H’ | Simpson D | |
N1 | 25.370 | 16.671 | 25.213 | C vs. D | t=-5.132; df=32.69; p=1.3x10⁻⁵ * | t=-4.052; df=94.11; p=1.0x10⁻⁴ * |
N2 | 16.633 | 10.269 | 15.760 | Pooled seasons | ||
N2/N1 | 0.656 | 0.616 | 0.625 | A vs. B | t=1.99; df=1216.10; p=0.050 ns | |
J | 0.827 | 0.791 | 0.809 | A vs. C | t=4.879; df=92.30; p=4.4x10⁻⁶ * | |
IBP | 0.130 | 0.215 | 0.135 | A vs. D | t=-0.838; df=1642.30; p=0.402 ns | |
B vs. C | t=-3.842; df=111.51; p=2.0x10⁻⁴ * | |||||
B vs. D | t=2.293; df=1676.8; p=0.022 * | |||||
C vs. D | t=-5.005; df=109.48; p=2.2x10⁻⁶ * | |||||
Site 1 (dam) | Site 2 | Site 3 | Site 4 | ||||||||||
|---|---|---|---|---|---|---|---|---|---|---|---|---|---|
I | II | III | I | II | III | I | II | III | I | II | III | ||
Site 1 | I | 1.000 | |||||||||||
II | 0.578 | 1.000 | |||||||||||
III | 0.716 | 0.614 | 1.000 | ||||||||||
Site 2 | I | 0.224 | 0.258 | 0.201 | 1.000 | ||||||||
II | 0.241 | 0.210 | 0.204 | 0.305 | 1.000 | ||||||||
III | 0.313 | 0.299 | 0.307 | 0.649 | 0.683 | 1.000 | |||||||
Site 3 | I | 0.098 | 0.066 | 0.056 | 0.243 | 0.091 | 0.286 | 1.000 | |||||
II | 0.028 | 0.023 | 0.016 | 0.127 | 0.085 | 0.195 | 0.143 | 1.000 | |||||
III | 0.123 | 0.087 | 0.070 | 0.127 | 0.045 | 0.166 | 0.880 | 0.353 | 1.000 | ||||
Site 4 | I | 0.378 | 0.238 | 0.258 | 0.290 | 0.305 | 0.280 | 0.151 | 0.071 | 0.208 | 1.000 | ||
II | 0.134 | 0.151 | 0.091 | 0.267 | 0.195 | 0.254 | 0.030 | 0.069 | 0.087 | 0.365 | 1.000 | ||
III | 0.387 | 0.267 | 0.296 | 0.300 | 0.258 | 0.366 | 0.095 | 0.043 | 0.132 | 0.749 | 0.573 | 1.000 | |
A. Dam: AIC (BIC) | B. Site 2: AIC (BIC) | |||||
|---|---|---|---|---|---|---|
Dry season | Rainy season | Pooled seasons | Dry season | Rainy season | Pooled seasons | |
Broken-Stick (BS) | 1175.1 (1175.1) | 915.9 (915.9) | 1913.4 (1913.4) | 144.1 (144.1) | 188.1 (188.1) | 238.8238.8) |
Log-Linear (LL) | 579.4 (581.5) | 572.2 (574.1) | 884.1 (886.3) | 135.2 (136.9)* | 177.7 (179.2) | 215.3 (217.0) |
Log-Normal (LN) | 347.2 (351.4) | 342.8 (346.7) | 907.1 (911.5) | 152.0 (155.3) | 144.3 (147.3) | 187.5 (191.0)* |
Zipf (Z) | 512.6 (516.8) | 387.8 (391.6) | 1313.8 (1318.2) | 181.0 (184.3) | 146.9 (149.9) | 244.9 (248.4) |
Zidf-Mandelbrot (ZM) | 300.5 (306.8)* | 278.0 (283.8)* | 527.3 (534.0)* | 138.6 (143.5) | 136.9 (141.3)* | 191.1 (196.3) |
C. Site 3: AIC (BIC) | D. Site 4: AIC (BIC) | |||||
|---|---|---|---|---|---|---|
Broken-Stick (BS) | 39.3 (39.3) | 44.8 (44.8)* | 70.6 (70.6) | 278.0 (278.0) | 175.6 (175.6) | 396.4 (396.4) |
Log-Linear (LL) | 38.1 (38.7)* | 47.0 (47.7) | 72.3 (73.4) | 241.0 (242.9) | 154.7 (156.2) | 321.1 (323.1) |
Log-Normal (LN) | 39.8 (41.1) | 46.5 (47.8) | 69.7 (71.8) | 217.7 (221.6) | 129.1 (132.2) | 258.1 (262.1) |
Zipf (Z) | 39.6 (40.9) | 46.2 (47.5) | 68.6 (70.7)* | 269.9 (273.7) | 136.3 (139.4) | 332.4 (336.4) |
Zidf-Mandelbrot (ZM) | 41.2 (43.2) | 48.0 (50.0) | 70.2 (73.4) | 207.8 (213.5)* | 126.6 (131.3)* | 249.8 (255.8) |
Species 1/species 2 | τ (p-value) | Species 1/species 2 | τ (p-value) | Species1/species 2 | τ (p-value) | |||
|---|---|---|---|---|---|---|---|---|
A. Negative correlations | ||||||||
Afrocyclops sp. | Cryptocyclops sp. | Mesocyclops sp. | ||||||
Alona rustica | -0.210(0.035)* | Pl. denticulatus | -0.206(0.039)* | Nicsmirnovius eximius | -0.249(0.013)* | |||
Daphnia sp. | -0.221(0.027)* | Daphnia sp. | Pleuroxus denticulatus | -0.276(0.006)* | ||||
Nicsmirnovius eximius | -0.199(0.047)* | Ectocyclops sp. | -0.289(0.004)* | Pl. laevis | -0.262(0.009)* | |||
Pleuroxus denticulatus | -0.221(0.027)* | Mesocyclops sp. | -0.276(0.006)* | Undetermined 3 | ||||
Pleuroxus laevis | -0.209(0.036)* | Diaphanosoma sarsi | Alona guttata | -0.271(0.007)* | ||||
Alona guttata | Ectocyclops sp. | -0.259(0.009)* | Alona rustica | -0.287(0.004)* | ||||
Ectocyclops sp. | -0.260(0.009)* | Mesocyclops sp. | -0.247(0.013)* | Alonella excisa | -0.216(0.030)* | |||
Mesocyclops sp. | -0.248(0.013)* | Ectocyclops sp. | Biapertura affinis | -0.217(0.030)* | ||||
Alona rustica | Alonella excisa | -0.207(0.038)* | Biapertura intermedia | -0.271(0.006)* | ||||
Ectocyclops sp. | -0.275(0.006)* | Biapertura affinis | -0.208(0.037)* | Chydorus piger | -0.216(0.030)* | |||
Mesocyclops sp. | -0.263(0.008)* | Chydorus piger | -0.207(0.038)* | Chydorus sphaericus | -0.271(0.006)* | |||
Biapertura intermedia | Kurzia latissima | -0.207(0.038)* | Daphnia sp. | -0.302(0.002)* | ||||
Ectocyclops sp. | -0.260(0.009)* | Kurzia longirostris | -0.259(0.009)* | Diaphanosoma sarsi | -0.270(0.007)* | |||
Mesocyclops sp. | -0.249(0.013)* | Moina macrocopa | -0.207(0.038)* | Kurzia latissima | -0.216(0.030)* | |||
Chydorus sphaericus | Ni. eximius | -0.260(0.009)* | Kurzia longirostris | -0.270(0.007)* | ||||
Ectocyclops sp. | -0.260(0.009)* | Pl. denticulatus | -0.289(0.004)* | Moina macrocopa | -0.216(0.030)* | |||
Mesocyclops sp. | -0.249(0.013)* | Pl. laevis | -0.274(0.006)* | Nicsmirnovius eximius | -0.271(0.006)* | |||
Cryptocyclops sp. | Mesocyclops sp. | Pleuroxus denticulatus | -0.302(0.003)* | |||||
Daphnia sp. | -0.206(0.039)* | Kurzia longirostris | -0.247(0.013)* | Pl. laevis | -0.286(0.004)* | |||
B. Positive correlations | ||||||||
Abdiacyclops sp. | Acroperus harpae | Alona natalensis | ||||||
Allocyclops sp. | 0.473(2x10⁻⁶)* | Ch. piger | 0.531(1x10⁻⁷)* | Ao. excisa | 0.382(1x10⁻⁴)* | |||
Cryptocyclops sp. | 0.487(1x10⁻⁶)* | Ch. sphaericus | 0.203(0.042)* | Bi. affinis | 0.647(9x10-11)* | |||
Ectocyclops sp. | 0.310(0.002)* | Daphnia sp. | 0.423(2x10⁻⁵)* | Ca. rectirostris | 0.210(0.036)* | |||
Mesocyclops sp. | 0.316(0.002)* | Di. sarsi | 0.351(4x10⁻⁴)* | Ce. megops | 0.548(4x10⁻⁸)* | |||
Microcyclops sp. | 0.210(0.035)* | Ku. latissima | 0.531(1x10⁻⁷)* | Ch. piger | 0.671(2x10-11)* | |||
Species 1/species 2 | τ (p-value) | Species 1/species 2 | τ (p-value) | Species1/species 2 | τ (p-value) | |||
|---|---|---|---|---|---|---|---|---|
B. Positive correlations (Continued) | ||||||||
Abdiacyclops sp. (continued) | Acroperus harpae (continued) | Alona natalensis (continued) | ||||||
Paradiaptomus sp. | 0.711(1x10-12)* | Le. diaphanus | 0.272(0.006)* | Da. obtusa | 0.354(4x10⁻⁴)* | |||
Acroperus aduncus | Moina macrocopa | 0.217(0.029)* | Daphnia sp. | 0.522(2x10⁻⁷)* | ||||
Alona guttata | 0.301(003)* | Ni. eximius | 0.374(2x10⁻⁴)* | Di. sarsi | 0.432(2x10⁻⁵)* | |||
Alona protzi | 0.483(1x10⁻⁶)* | Ox. singalensis | 0.392(9x10⁻⁵)* | Ku. latissima | 0.639(2x10⁻¹⁰)* | |||
Alona rustica | 0.324(0.001)* | Pl. denticulatus | 0.447(7x10⁻⁶)* | Ku. longirostris | 0.310(0.002)* | |||
Bi. intermedia | 0.555(3x10⁻⁸)* | Pl. laevis | 0.446(8x10⁻⁶)* | Mo. macrocopa | 0.382(1x10⁻⁴)* | |||
Ca. rectirostris | 0.532(1x10⁻⁷)* | Afrocyclops sp. | Ni. eximius | 0.465(3x10⁻⁶)* | ||||
Ch. sphaericus | 0.266(0.008)* | Allocyclops sp. | 0.435(1x10⁻⁵)* | Ox. singalensis | 0.292(0.003)* | |||
Daphnia sp. | 0.481(1x10⁻⁶)* | Cryptocyclops sp. | 0.554(3x10⁻⁸)* | Pl. denticulatus | 0.542(6x10⁻⁸)* | |||
Di. sarsi | 0.287(0.004)* | Diaptomus sp. | 0.518(2x10⁻⁷)* | Pl. laevis | 0.511(3x10⁻⁷)* | |||
Eu. orientalis | 0.210(0.035)* | Ectocyclops sp. | 0.744(9x10-14)* | Alona quadrangularis | ||||
Ku. longirostris | 0.539(7x10⁻⁸)* | Harpacticella sp. | 0.588(4x10⁻⁹)* | Ch. sphaericus | 0.455(4x10⁻⁶)* | |||
Ni. eximius | 0.498(6x10⁻⁷)* | Mesocyclops sp. | 0.755(4x10-14)* | Di. brachyurum | 0.356(4x10⁻⁴)* | |||
Pl. denticulatus | 0.456(5x10⁻⁶)* | Microcyclops sp. | 0.798(1x10-15)* | Ac. angustatus | 0.700(2x10-12)* | |||
Pl. laevis | 0.410(4x10⁻⁵)* | Paradiaptomus sp. | 0.322(0.001)* | Al. guttata | 0.485(1x10⁻⁶)* | |||
Acroperus angustatus | Alona guttata | Al. protzi | 0.585(5x10⁻⁹)* | |||||
Al. guttata | 0.351(4x10⁻⁴)* | Al. natalensis | 0.297(0.003)* | Ao. excisa | 0.524(2x10⁻⁷)* | |||
Al. protzi | 0.439(1x10⁻⁵)* | Al. protzi | 0.711(1x10-12)* | Bi. affinis | 0.539(7x10⁻⁸)* | |||
Ao. excisa | 0.331(0.001)* | Al. rustica | 0.622(4x10⁻¹⁰)* | Bi. intermedia | 0.406(5x10⁻⁵)* | |||
Bi. affinis | 0.341(0.001)* | Ao. excisa | 0.461(4x10⁻⁶)* | Ch. gibbus | 0.700(2x10-12)* | |||
Bi. intermedia | 0.284(0.004)* | Bi. affinis | 0.469(3x10⁻⁶)* | Ch. piger | 0.537(7x10⁻⁸)* | |||
Chydorus gibbus | 1.000(1x10-23)* | Bi. intermedia | 0.428(2x10⁻⁵)* | Da. lumholtzi | 0.391(9x10⁻⁵)* | |||
Chydorus piger | 0.367(2x10⁻⁴)* | Ca. rectirostris | 0.411(4x10⁻⁵)* | Di. sarsi | 0.479(2x10⁻⁶)* | |||
Di. sarsi | 0.350(5x10⁻⁴)* | Ce. megops | 0.284(0.004)* | Dr. dentata | 0.700(2x10-12)* | |||
Dr. dentata | 1.000(1x10-23)* | Ch. gibbus | 0.351(4x10⁻⁴)* | Eu. orientalis | 0.670(2x10-11)* | |||
Eu. orientalis | 0.469(3x10⁻⁶) | Ch. piger | 0.615(7x10⁻¹⁰)* | Ka. karua | 0.649(8x10-11)* | |||
Karualona karua | 0.465(3x10⁻⁶) | Da. obtusa | 0.403(5x10⁻⁵)* | Ku. latissima | 0.575(8x10⁻⁹)* | |||
Kurzia latissima | 0.420(3x10⁻⁵) | Daphnia sp. | 0.485(1x10⁻⁶)* | Ku. longirostris | 0.426(2x10⁻⁵)* | |||
Kurzia longirostris | 0.246(0.014)* | Di. sarsi | 0.587(4x10⁻⁹)* | Le. diaphanus | 0.559(2x10⁻⁸)* | |||
Le. diaphanus | 0.391(9x10⁻⁵)* | Dr. dentata | 0.351(4x10⁻⁴)* | Mo. macrocopa | 0.575(8x10⁻⁹)* | |||
Mo. macrocopa | 0.385(1x10⁻⁴)* | Eu. orientalis | 0.428(2x10⁻⁵)* | Mi. macleayi | 0.355(4x10⁻⁴)* | |||
Mi. macleayi | 0.534(9x10⁻⁸)* | Ka. karua | 0.265(0.008)* | Ni. eximius | 0.455(5x10⁻⁶)* | |||
Ni. eximius | 0.352(4x10⁻⁴)* | Ku. latissima | 0.646(9x10-11)* | Ox. singalensis | 0.784(4x10-15)* | |||
Ox. singalensis | 0.548(4x10⁻⁸)* | Ku longirostris | 0.695(3x10-12)* | Pl. laevis | 0.406(5x10⁻⁵)* | |||
Species 1/species 2 | τ (p-value) | Species 1/species 2 | τ (p-value) | Species1/species 2 | τ (p-value) | |||
|---|---|---|---|---|---|---|---|---|
B. Positive correlations (Continued) | ||||||||
Acroperus angustatus (continued) | Alona guttata (continued) | Alona protzi (continued) | ||||||
Pl. denticulatus | 0.245(0.014)* | Le. diaphanus | 0.507(4x10⁻⁷)* | Al. rustica | 0.503(5x10⁻⁷)* | |||
Pl. laevis | 0.277(0.006)* | Mo. macrocopa | 0.326(0.001)* | Ao. excisa | 0.250(0.012)* | |||
Acroperus harpae | Ni. eximius | 0.593(3x10⁻⁹)* | Bi. affinis | 0.259(0.009)* | ||||
Al. natalensis | 0.811(4x10-16)* | Ox. singalensis | 0.568(1x10⁻⁸)* | Bi. intermedia | 0.521(2x10⁻⁷)* | |||
Al. rustica | 0.418(3x10⁻⁵)* | Pl. denticulatus | 0.673(2x10-11)* | Ca. rectirostris | 0.392(8x10⁻⁵)* | |||
Ao. excisa | 0.230(0.021)* | Pl. laevis | 0.629(3x10⁻¹⁰)* | Ch. gibbus | 0.439(1x10⁻⁵)* | |||
Biapertura affinis | 0.539(7x10⁻⁸)* | Alona natalensis | Ch. piger | 0.258(0.010)* | ||||
Ca. rectirostris | 0.294(0.003)* | Al. rustica | 0.476(2x10⁻⁶)* | |||||
Alona protzi | Biapertura affinis | Ceriodaphnia megops | ||||||
Da. obtusa | 0.263(0.008)* | Da. obtusa | 0.198(0.047)* | Ku. latissima | 0.367(2x10⁻⁴)* | |||
Di. sarsi | 0.532(1x10⁻⁷)* | Daphnia sp. | 0.267(0.007)* | Ku. longirostris | 0.335(0.001)* | |||
Dr. dentata | 0.439(1x10⁻⁵)* | Di. sarsi | 0.741(1x10-13)* | Mo. macrocopa | 0.331(0.001)* | |||
Eu. orientalis | 0.589(4x10⁻⁹)* | Dr. dentata | 0.341(0.001)* | Ni. eximius | 0.284(0.004)* | |||
Ka. karua | 0.352(4x10⁻⁴)* | Eu. orientalis | 0.322(0.001)* | Pl. denticulatus | 0.292(0.003)* | |||
Ku. latissima | 0.291(0.004)* | Ka. karua | 0.561(2x10⁻⁸)* | Pl. laevis | 0.241(0.016)* | |||
Ku. longirostris | 0.511(3x10⁻⁷)* | Ku. latissima | 0.762(2x10-14)* | Chydorus gibbus | ||||
Le. diaphanus | 0.497(6x10⁻⁷)* | Ku. longirostris | 0.449(7x10⁻⁶)* | Ch. piger | 0.367(2x10⁻⁴)* | |||
Mo. macrocopa | 0.283(0.005)* | Le. diaphanus | 0.449(7x10⁻⁶)* | Di. sarsi | 0.350(5x10⁻⁴)* | |||
Ni. eximius | 0.507(4x10⁻⁷)* | Mo. macrocopa | 0.800(1x10-15)* | Dr. dentata | 1.000(1x10-23)* | |||
Ox. singalensis | 0.440(1x10⁻⁵)* | Mi. macleayi | 0.414(3x10⁻⁵)* | Eu. orientalis | 0.469(3x10⁻⁶)* | |||
Pl. denticulatus | 0.433(1x10⁻⁵)* | Ni. eximius | 0.559(2x10⁻⁸)* | Ka. karua | 0.465(3x10⁻⁶)* | |||
Pl. laevis | 0.448(7x10⁻⁶)* | Ox. singalensis | 0.663(3x10-11)* | Ku. latissima | 0.420(3x10⁻⁵)* | |||
Alona rustica | Pl. denticulatus | 0.416(3x10⁻⁵)* | Ku. longirostris | 0.246(0.014)* | ||||
Ao. excisa | 0.413(3x10⁻⁵)* | Pl. laevis | 0.575(8x10⁻⁹)* | Le. diaphanus | 0.391(9x10⁻⁵)* | |||
Bi. affinis | 0.409(4x10⁻⁵)* | Biapertura intermedia | Mo. macrocopa | 0.385(1x10⁻⁴)* | ||||
Bi. intermedia | 0.318(0.001)* | Ca. rectirostris | 0.458(5x10⁻⁶)* | Mi. macleayi | 0.534(9x10⁻⁸)* | |||
Ca. rectirostris | 0.603(2x10⁻⁹)* | Ch. gibbus | 0.284(0.004)* | Ni. eximius | 0.352(4x10⁻⁴)* | |||
Ce. megops | 0.214(0.032)* | Ch. piger | 0.248(0.013)* | Ox. singalensis | 0.548(4x10⁻⁸)* | |||
Ch. piger | 0.395(7x10⁻⁵)* | Da. curvirostris | 0.322(0.001)* | Pl. denticulatus | 0.245(0.014)* | |||
Da. curvirostris | 0.292(0.003)* | Da. lumholtzi | 0.511(3x10⁻⁷)* | Pl. laevis | 0.277(0.006)* | |||
Da. lumholtzi | 0.299(0.003)* | Daphnia sp. | 0.335(0.001)* | Chydorus piger | ||||
Da. obtusa | 0.339(0.001)* | Di. sarsi | 0.597(2x10⁻⁹)* | Da. obtusa | 0.254(0.011)* | |||
Daphnia sp. | 0.579(6x10⁻⁹)* | Dr. dentata | 0.284(0.004)* | Daphnia sp. | 0.392(9x10⁻⁵)* | |||
Di. sarsi | 0.621(5x10⁻¹⁰)* | Eu. orientalis | 0.640(1x10⁻¹⁰)* | Di. sarsi | 0.566(1x10⁻⁸)* | |||
Species 1/species 2 | τ (p-value) | Species 1/species 2 | τ (p-value) | Species1/species 2 | τ (p-value) | |||
|---|---|---|---|---|---|---|---|---|
B. Positive correlations (Continued) | ||||||||
Alona rustica (Continued) | Biapertura intermedia (Continued) | Chydorus piger (Continued) | ||||||
Eu. orientalis | 0.416(3x10⁻⁵)* | Ka. karua | 0.601(2x10⁻⁹)* | Dr. dentata | 0.367(2x10⁻⁴)* | |||
Ka. karua | 0.217(0.029)* | Ku. latissima | 0.267(0.007)* | Eu. orientalis | 0.321(0.001)* | |||
Ku. latissima | 0.389(1x10⁻⁴)* | Ku. longirostris | 0.668(2x10-11)* | Ka. karua | 0.305(0.002)* | |||
Ku. longirostris | 0.421(2x10⁻⁵)* | Le. diaphanus | 0.546(4x10⁻⁸)* | Ku. latissima | 0.962(5x10-22)* | |||
Le. diaphanus | 0.497(6x10⁻⁷)* | Mo. macrocopa | 0.450(7x10⁻⁶)* | Ku. longirostris | 0.610(1x10⁻⁹)* | |||
Mo. macrocopa | 0.407(4x10⁻⁵)* | Mi. macleayi | 0.520(2x10⁻⁷) | Le. diaphanus | 0.468(3x10⁻⁶)* | |||
Ni. eximius | 0.614(8x10⁻¹⁰)* | Ni. eximius | 0.597(2x10⁻⁹)* | Mo. macrocopa | 0.586(4x10⁻⁹)* | |||
Ox. singalensis | 0.280(0.005)* | Ox. singalensis | 0.285(0.004)* | Ni. eximius | 0.594(3x10⁻⁹)* | |||
Pl. denticulatus | 0.672(2x10-11)* | Pl. denticulatus | 0.466(3x10⁻⁶)* | Ox. singalensis | 0.686(6x10-12)* | |||
Pl. laevis | 0.634(2x10⁻¹⁰)* | Pl. laevis | 0.619(6x10⁻¹⁰)* | Pl. denticulatus | 0.537(7x10⁻⁸)* | |||
Alonella excisa | Bythotrephes longimanus | Pl. laevis | 0.698(3x10-12)* | |||||
Bi. affinis | 0.574(9x10⁻⁹)* | Al. rustica | 0.292(0.003)* | Chydorus sphaericus | ||||
Bi. intermedia | 0.472(2x10⁻⁶)* | Ao. excisa | 0.420(3x10⁻⁵)* | Ac. angustatus | 0.299(0.003)* | |||
Ca. rectirostris | 0.360(3x10⁻⁴)* | Bi. intermedia | 0.322(0.001)* | Al. guttata | 0.585(4x10⁻⁹)* | |||
Ce. megops | 0.349(5x10⁻⁴)* | Ca. rectirostris | 0.510(3x10⁻⁷)* | Al. natalensis | 0.333(0.001)* | |||
Chydorus gibbus | 0.331(0.001)* | Ch. sphaericus | 0.254(0.011)* | Al. protzi | 0.322(0.001)* | |||
Chydorus piger | 0.598(2x10⁻⁹)* | Da. curvirostris | 1.000(1x10-23)* | Al. rustica | 0.371(2x10⁻⁴)* | |||
Da. curvirostris | 0.420(3x10⁻⁵)* | Da. lumholtzi | 0.534(9x10⁻⁸)* | Ao. excisa | 0.771(1x10-14)* | |||
Da. lumholtzi | 0.444(9x10⁻⁶)* | Di. brachyurum | 0.573(9x10⁻⁹)* | Bi. affinis | 0.483(1x10⁻⁶)* | |||
Da. obtusa | 0.203(0.041)* | Di. sarsi | 0.305(0.002)* | Bi. intermedia | 0.639(1x10⁻¹⁰)* | |||
Daphnia sp. | 0.232(0.020)* | Eu. orientalis | 0.512(3x10⁻⁷)* | Ca. rectirostris | 0.389(1x10⁻⁴)* | |||
Di. sarsi | 0.585(5x10⁻⁹)* | Ka. karua | 0.487(1x10⁻⁶)* | Ce. megops | 0.299(0.003)* | |||
Dr. dentata | 0.331(0.001)* | Le. diaphanus | 0.459(4x10⁻⁶)* | Ch. gibbus | 0.299(0.003)* | |||
Eu. orientalis | 0.577(7x10⁻⁹)* | Mo. macrocopa | 0.358(3x10⁻⁴)* | Ch. piger | 0.661(4x10-11)* | |||
Ka. karua | 0.550(4x10⁻⁸)* | Mi. macleayi | 0.559(2x10⁻⁸)* | Da. curvirostris | 0.254(0.011)* | |||
Ku. latissima | 0.590(3x10⁻⁹)* | Ni. eximius | 0.337(0.001)* | Da. lumholtzi | 0.310(0.002)* | |||
Ku. longirostris | 0.613(8x10⁻¹⁰)* | Pl. denticulatus | 0.224(0.024)* | Daphnia sp. | 0.445(8x10⁻⁶)* | |||
Le. diaphanus | 0.686(6x10-12)* | Pl. laevis | 0.333(0.001)* | Di. brachyurum | 0.276(0.006)* | |||
Pl. denticulatus | 0.509(3x10⁻⁷)* | Eu. orientalis | 0.467(3x10⁻⁶)* | Ku. latissima | 0.661(4x10-11)* | |||
Pl. laevis | 0.715(7x10-13)* | Ku. longirostris | 0.406(5x10⁻⁵)* | Ku. longirostris | 0.817(3x10-16)* | |||
Mo. macrocopa | 0.583(5x10⁻⁹)* | Camptocercus rectirostris | Di. sarsi | 0.552(3x10⁻⁸)* | ||||
Mi. macleayi | 0.402(6x10⁻⁵)* | Da. curvirostris | 0.510(3x10⁻⁷)* | Dr. dentata | 0.299(0.003)* | |||
Ni. eximius | 0.780(5x10-15)* | Daphnia sp. | 0.402(6x10⁻⁵)* | Eu. orientalis | 0.571(1x10⁻⁸)* | |||
Ox. singalensis | 0.650(7x10-11)* | Di. sarsi | 0.580(6x10⁻⁹)* | Ka. karua | 0.395(7x10⁻⁵)* | |||
Species 1/species 2 | τ (p-value) | Species 1/species 2 | τ (p-value) | Species1/species 2 | τ (p-value) | |||
|---|---|---|---|---|---|---|---|---|
B. Positive correlations (Continued) | ||||||||
Allocyclops sp. | Camptocercus rectirostris (Continued) | Chydorus sphaericus (Continued) | ||||||
Cryptocyclops sp. | 0.457(5x10⁻⁶)* | Le. diaphanus | 0.652(6x10-11)* | Le. diaphanus | 0.670(2x10-11)* | |||
Ectocyclops sp. | 0.270(0.007)* | Mi. macleayi | 0.247(0.013)* | Mo. macrocopa | 0.450(7x10⁻⁶)* | |||
Mesocyclops sp. | 0.260(0.009)* | Ni. eximius | 0.599(2x10⁻⁹)* | Mi. macleayi | 0.271(0.007)* | |||
Paradiaptomus sp. | 0.681(9x10-12)* | Ox. singalensis | 0.229(0.022)* | Ni. eximius | 0.700(2x10-12)* | |||
Biapertura affinis | Pl. denticulatus | 0.534(9x10⁻⁸)* | Ox. singalensis | 0.587(4x10⁻⁹)* | ||||
Bi. intermedia | 0.287(0.004)* | Pl. laevis | 0.589(4x10⁻⁹)* | Pl. denticulatus | 0.584(5x10⁻⁹)* | |||
Ce. megops | 0.341(0.001)* | Ceriodaphnia megops | Pl. laevis | 0.751(5x10-14)* | ||||
Ch. gibbus | 0.341(0.001)* | Ch. piger | 0.420(3x10⁻⁵)* | Cryptocyclops sp. | ||||
Ch. piger | 0.762(2x10-14)* | Da. obtusa | 0.681(9x10-12)* | Diaptomus sp. | 0.232(0.020)* | |||
Da. lumholtzi | 0.461(4x10⁻⁶)* | Daphnia sp. | 0.286(0.004)* | Ectocyclops sp. | 0.665(3x10-11)* | |||
Cryptocyclops sp. | Di. sarsi | 0.246(0.014)* | Harpacticella sp. | 0.367(2x10⁻⁴)* | ||||
Mesocyclops sp. | 0.688(5x10-12)* | Diaphanosoma sarsi | Kurzia longirostris | |||||
Microcyclops sp. | 0.548(4x10⁻⁸)* | Le. diaphanus | 0.680(9x10-12)* | Le. diaphanus | 0.489(1x10⁻⁶)* | |||
Paracyclops sp. | 0.376(2x10⁻⁴)* | Mo. macrocopa | 0.779(6x10-15)* | Mo. macrocopa | 0.313(0.002)* | |||
Paradiaptomus sp. | 0.342(0.001)* | Mi. macleayi | 0.573(9x10⁻⁹)* | Ni. eximius | 0.694(4x10-12)* | |||
Daphnia curvirostris | Ni. eximius | 0.796(2x10-15)* | Ox. singalensis | 0.510(3x10⁻⁷)* | ||||
Da. lumholtzi | 0.534(8x10⁻⁸)* | Ox. singalensis | 0.528(1x10⁻⁷)* | Pl. denticulatus | 0.592(3x10⁻⁹)* | |||
Di. sarsi | 0.305(0.002)* | Pl. denticulatus | 0.566(1x10⁻⁸)* | Pl. laevis | 0.702(2x10-12)* | |||
Eu. orientalis | 0.512(3x10⁻⁷)* | Pl. laevis | 0.759(3x10-14)* | Leberis diaphanous | ||||
Ka. karua | 0.487(1x10⁻⁶)* | Diaptomus sp. | Mo. macrocopa | 0.468(3x10⁻⁶)* | ||||
Le. diaphanus | 0.459(4x10⁻⁶)* | Ectocyclops sp. | 0.409(4x10⁻⁵)* | Mi. macleayi | 0.462(4x10⁻⁶)* | |||
Mo. macrocopa | 0.358(3x10⁻⁴)* | Harpacticella sp. | 0.372(2x10⁻⁴)* | Ni. eximius | 0.684(7x10-12)* | |||
Mi. macleayi | 0.559(2x10⁻⁸)* | Mesocyclops sp. | 0.423(2x10⁻⁵)* | Ox. singalensis | 0.721(5x10-13)* | |||
Ni. eximius | 0.337(0.001)* | Microcyclops sp. | 0.553(3x10⁻⁸)* | Pl. denticulatus | 0.459(4x10⁻⁶)* | |||
Pl. denticulatus | 0.224(0.024)* | Drepanothrix dentata | Pl. laevis | 0.690(5x10-12)* | ||||
Pl. laevis | 0.333(0.001)* | Eu. orientalis | 0.469(3x10⁻⁶)* | Mesocyclops sp. | ||||
Daphnia lumholtzi | Ka. karua | 0.465(3x10⁻⁶)* | Microcyclops sp. | 0.660(4x10-11)* | ||||
Di. sarsi | 0.565(2x10⁻⁸)* | Ku. latissima | 0.420(3x10⁻⁵)* | Paracyclops sp. | 0.255(0.011)* | |||
Eu. orientalis | 0.541(6x10⁻⁸)* | Ku. longirostris | 0.246(0.014)* | Paradiaptomus sp. | 0.209(0.036)* | |||
Ka. karua | 0.833(7x10-17)* | Le. diaphanus | 0.391(9x10⁻⁵)* | Paradiaptomus sp. | 0.340(0.001)* | |||
Le. diaphanus | 0.462(4x10⁻⁶)* | Mo. macrocopa | 0.385(1x10⁻⁴)* | Moina macrocopa | ||||
Mo. macrocopa | 0.705(2x10-12)* | Mi. macleayi | 0.534(9x10⁻⁸)* | Mi. macleayi | 0.673(2x10-11)* | |||
Mi. macleayi | 0.638(2x10⁻¹⁰)* | Ni. eximius | 0.352(4x10⁻⁴)* | Ni. eximius | 0.598(2x10⁻⁹)* | |||
Ni. eximius | 0.319(0.001)* | Ox. singalensis | 0.548(4x10⁻⁸)* | Ox. singalensis | 0.430(2x10⁻⁵)* | |||
Species 1/species 2 | τ (p-value) | Species 1/species 2 | τ (p-value) | Species1/species 2 | τ (p-value) | |||
|---|---|---|---|---|---|---|---|---|
B. Positive correlations (Continued) | ||||||||
Daphnia lumholtzi (Continued) | Drepanothrix dentata (Continued) | Moina macrocopa (Continued) | ||||||
Ox. singalensis | 0.291(0.004)* | Pl. denticulatus | 0.245(0.014)* | Pl. denticulatus | 0.363(3x10⁻⁴)* | |||
Pl. laevis | 0.319(0.001)* | Pl. laevis | 0.277(0.006)* | Pl. laevis | 0.575(8x10⁻⁹)* | |||
Daphnia obtusa | Ectocyclops sp. | Moinodaphnia macleayi | ||||||
Ku. latissima | 0.216(0.030)* | Harpacticella sp. | 0.478(2x10⁻⁶)* | Ni. eximius | 0.349(5x10⁻⁴)* | |||
Pl. denticulatus | 0.343(0.001)* | Mesocyclops sp. | 0.957(9x10-22)* | Ox. singalensis | 0.262(0.009)* | |||
Daphnia sp. | Microcyclops sp. | 0.649(8x10-11)* | Pl. denticulatus | 0.218(0.029)* | ||||
Di. sarsi | 0.357(3x10⁻⁴)* | Paracyclops sp. | 0.247(0.013)* | Pl. laevis | 0.310(0.002)* | |||
Ku. latissima | 0.375(2x10⁻⁴)* | Paradiaptomus sp. | 0.221(0.026)* | Nicsmirnovius eximius | ||||
Ku. longirostris | 0.593(3x10⁻⁹)* | Euryalona orientalis | Ox. singalensis | 0.535(8x10⁻⁸)* | ||||
Ni. eximius | 0.479(2x10⁻⁶)* | Ka. karua | 0.709(1x10-12)* | Pl. denticulatus | 0.703(2x10-12)* | |||
Pl. denticulatus | 0.679(1x10-11)* | Ku. latissima | 0.348(5x10⁻⁴)* | Pl. laevis | 0.866(4x10-18)* | |||
Pl. laevis | 0.547(4x10⁻⁸)* | Ku. longirostris | 0.408(4x10⁻⁵)* | Oxyurella singalensis | ||||
Diaphanosoma brachyurum | Le. diaphanus | 0.871(3x10-18)* | Pl. denticulatus | 0.291(0.004)* | ||||
Ac. angustatus | 0.536(8x10⁻⁸)* | Mo. macrocopa | 0.564(2x10⁻⁸)* | Pl. laevis | 0.523(2x10⁻⁷)* | |||
Ao. excisa | 0.409(4x10⁻⁵)* | Mi. macleayi | 0.541(6x10⁻⁸)* | Pleuroxus denticulatus | ||||
Bi. affinis | 0.410(4x10⁻⁵)* | Ni. eximius | 0.625(4x10⁻¹⁰)* | Pl. laevis | 0.775(8x10-15)* | |||
Bi. intermedia | 0.526(1x10⁻⁷)* | Ox. singalensis | 0.511(3x10⁻⁷)* | Pseudodiaptomus sp. | ||||
Ca. rectirostris | 0.254(0.011)* | Pl. denticulatus | 0.342(0.001)* | Afrocyclops sp. | 0.579(7x10⁻⁹)* | |||
Ch. gibbus | 0.536(8x10⁻⁸) | Pl. laevis | 0.607(1x10⁻⁹)* | Cryptocyclops sp. | 0.377(2x10⁻⁴) | |||
Da. curvirostris | 0.573(9x10⁻⁹)* | Harpacticella sp. | Diaptomus sp. | 0.372(2x10⁻⁴)* | ||||
Da. lumholtzi | 0.633(2x10⁻¹⁰)* | Mesocyclops sp. | 0.487(1x10⁻⁶)* | Ectocyclops sp. | 0.470(2x10⁻⁶)* | |||
Di. sarsi | 0.571(1x10⁻⁸)* | Microcyclops sp. | 0.451(6x10⁻⁶)* | Harpacticella sp. | 0.978(1x10-22)* | |||
Dr. dentata | 0.536(8x10⁻⁸)* | Karualona karua | Mesocyclops sp. | 0.479(2x10⁻⁶)* | ||||
Eu. orientalis | 0.549(4x10⁻⁸)* | Ku. latissima | 0.341(0.001)* | Microcyclops sp. | 0.461(4x10⁻⁶)* | |||
Ka. karua | 0.868(3x10-18)* | Ku. longirostris | 0.216(0.031)* | Undetermined 3 | ||||
Le. diaphanus | 0.469(3x10⁻⁶)* | Le. diaphanus | 0.601(2x10⁻⁹)* | Abdiacyclops sp. | 0.300(0.003)* | |||
Mo. macrocopa | 0.671(2x10-11)* | Mo. macrocopa | 0.786(3x10-15)* | Afrocyclops sp. | 0.718(6x10-13)* | |||
Mi. macleayi | 0.996(2x10-23)* | Mi. macleayi | 0.871(3x10-18)* | Allocyclops sp. | 0.266(0.008)* | |||
Ni. eximius | 0.355(4x10⁻⁴)* | Ni. eximius | 0.453(6x10⁻⁶)* | Cryptocyclops sp. | 0.613(8x10⁻¹⁰)* | |||
Ox. singalensis | 0.263(0.008)* | Ox. singalensis | 0.494(7x10⁻⁷)* | Diaptomus sp. | 0.396(7x10⁻⁵)* | |||
Pl. denticulatus | 0.223(0.025)* | Pl. laevis | 0.414(3x10⁻⁵)* | Ectocyclops sp. | 0.914(5x10-20)* | |||
Pl. laevis | 0.316(0.002)* | Kurzia latissima | Harpacticella sp. | 0.441(1x10⁻⁵)* | ||||
Diaphanosoma sarsi | Ku. longirostris | 0.591(3x10⁻⁹)* | Mesocyclops sp. | 0.872(2x10-18)* | ||||
Dr. dentata | 0.350(5x10⁻⁴)* | Le. diaphanus | 0.484(1x10⁻⁶)* | Microcyclops sp. | 0.659(4x10-11)* | |||
Species 1/species 2 | τ (p-value) | Species 1/species 2 | τ (p-value) | Species1/species 2 | τ (p-value) | |||
|---|---|---|---|---|---|---|---|---|
B. Positive correlations (Continued) | ||||||||
Diaphanosoma sarsi (Continued) | Kurzia latissima (Continued) | Undetermined 3 (Continued) | ||||||
Eu. orientalis | 0.645(1x10⁻¹⁰)* | Mo. macrocopa | 0.594(3x10⁻⁹)* | Paradiaptomus sp. | 0.251(0.012)* | |||
Ka. karua | 0.666(3x10-11)* | Ni. eximius | 0.613(8x10⁻¹⁰)* | Pseudodiaptomus sp. | 0.449(7x10⁻⁶)* | |||
Ku. latissima | 0.591(3x10⁻⁹)* | Ox. singalensis | 0.707(1x10-12)* | |||||
Ku. longirostris | 0.549(4x10⁻⁸)* | Pl. denticulatus | 0.532(1x10⁻⁷)* | |||||
Pl. laevis | 0.704(2x10-12)* | |||||||
Aa. curvirostris | Acantholeberis curvirostris (O. F. Müller, 1776) |
Ac. aduncus | Acroperus aduncus Sars, 1863 |
Ac. angustatus | Acroperus angustatus G. O. Sars, 1863 |
Ac. harpae | Acroperus harpae (Baird, 1834) |
AIC | Akaike Information Criteria |
Al. costata | Alona costata G. O. Sars, 1862 |
Ao. excisa | Alonella excisa (Fischer, 1854) |
Al. guttata | Alona guttata G. O. Sars, 1862 |
Al. natalensis | Alona natalensis Sinev, 2008 |
Al. protzi | Alona protzi Hartwig, 1900 |
Al. quadrangularis | Alona quadrangularis (O. F. Müller, 1776) |
Al. rectangula | Alona rectangula G. O. Sars, 1862 |
Al. rustica | Alona rustica Scott, 1895 |
ANOVA | Analysis of Variance |
Bi. affinis | Biapertura affinis (Leydig, 1860) |
Bi. intermedia | Biapertura intermedia (Sars, 1862) |
BIC | Bayesian Information Criteria |
BOD5 | Biochemical Oxygen Demand for Five Days |
BS | Broken-Stick Model |
By. longimanus | Bythotrephes longimanus Leydig, 1860 |
Ca. rectirostris | Camptocercus rectirostris Schödler, 1862 |
Ce. cornuta | Ceriodaphnia cornuta G. O. Sars, 1885 |
Ce. megops | Ceriodaphnia megops G. O. Sars, 1862 |
Ce. quadrangula | Ceriodaphnia quadrangula (O. F. Müller, 1785) |
Ch. gibbus | Chydorus gibbus G. O. Sars, 1890 |
Ch. ovalis | Chydorus ovalis Kurz, 1875 |
Ch. piger | Chydorus piger G. O. Sars, 1862 |
Ch. sphaericus | Chydorus sphaericus (O. F. Müller, 1776) |
Chl. a | Chlorophyll a |
Cond. | Conductivity |
CU | Conventional Unit |
Da. curvirostris | Daphnia curvirostris O. F. Müller, 1776 |
Da. lumholtzi | Daphnia lumholtzi G. O. Sars, 1885 |
Da. obtusa | Daphnia obtusa Kurz, 1875 |
df | degree of freedom |
Di. brachyurum | Diaphanosoma brachyurum (Lievin, 1848) |
Di. sarsi | Diaphanosoma sarsi Richard, 1894 |
DO | Dissolved Oxygen |
Dr. dentata | Drepanothrix dentata (Eurén, 1861) |
Eu. orientalis | Euryalona orientalis (Daday, 1898) |
FTU | Formazine Turbidity Unit |
I. acutifrons | Ilyocryptus acutifrons G. O. Sars, 1862 |
I. agilis | Ilyocryptus agilis Kurz, 1878 |
I. sordidus | Ilyocryptus sordidus (Liévin, 1848) |
Ka. karua | Karualona karua (King, 1853) |
Ku. latissima | Kurzia latissima (Kurz, 1875) |
Ku. longirostris | Kurzia longirostris (Daday, 1898) |
Le. diaphanus | Leberis diaphanus (King, 1853) |
Li. sinensis | Limnoithona sinensis (Burckhardt, 1913) |
LL | LogLinear Model |
LN | LogNormal Model |
Lp. kindtii | Leptodora kindtii (Focke, 1844) |
Ly. acanthocercoides | Leydigia acanthocercoides (Fischer, 1854) |
Ly. leydigi | Leydigia leydigi (Schödler, 1863) |
Ly. quadrangularis | Leydigia quadrangularis (Leydig, 1860) |
Mi. macleayi | Moinodaphnia macleayi (King, 1853) |
Mo. brachiata | Moina brachiata (Jurine, 1820) |
Mo. macrocopa | Moina macrocopa (Straus 1820) |
Mo. micrura | Moina micrura Kurz, 1875 |
NH4+ | Ammoniacal Nitrogen |
Ni. eximius | Nicsmirnovius eximius (Kiser, 1948) |
NO2- | Nitrites |
NO3- | Nitrates |
NS | Not Significant |
OD | Optical Densities |
O. singalensis | Oxyurella singalensis (Daday, 1898) |
Pa. pigra | Paralona pigra G. O. Sars, 1862 |
pH | potential of Hydrogen |
Pi. denticulatus | Picripleuroxus denticulatus (Birge, 1879) |
Pi. laevis | Picripleuroxus laevis (G. O. Sars, 1862) |
Pi. striatus | Picripleuroxus striatus (Schödler, 1862) |
Pl. aduncus | Pleuroxus aduncus (Jurine, 1820) |
Pl. denticulatus | Pleuroxus denticulatus Birge, 1879 |
Pl. laevis | Pleuroxus laevis G. O. Sars, 1862 |
Pl. striatus | Pleuroxus striatus Schödler, 1862 |
Pl. trigonellus | Pleuroxus trigonellus (O. F. Müller, 1776) |
Pl. uncinatus | Pleuroxus uncinatus (Baird, 1850) |
Po. pediculus | Polyphemus pediculus (Linnaeus, 1761) |
PO43- | Orthophosphate |
Pt-Co | Platinium-Cobalt |
R. falcata | Rhynchotalona falcata (G. O. Sars, 1862) |
R. kistarae | Rhynchotalona kistarae Røen, 1973 |
SADs | Species Abundance Distributions |
Sc. kingi | Scapholeberis kingi G. O. Sars, 1888 |
Se. calanoides | Senecella calanoides Juday, 1923 |
se | standard error |
Sm. exspinosus | Simocephalus Exspinosus (De Geer, 1778) |
Sm. vetulus | Simocephalus vetulus (O. F. Müller, 1776) |
Sr. serricaudatus | Streblocerus serricaudatus (Fischer, 1849) |
SS | Suspended Solids |
St. major | Stenocypris major (Baird, 1859) |
Temp. | Temperature |
Tr. ambigua | Tretocephala ambigua (Lilljeborg, 1901) |
Turb. | Turbidity |
WHO | World Health Organization |
WQI | Water Quality Index |
Z | Zipf |
ZM | Zipf-Mandelbrot |
| [1] | Cordy, G. E. “A Primer on Water Quality". Reston, VA: U.S. Geological Survey (USGS). Fact sheet (Geological Survey (U.S.)), Fact Sheet 027-01. 2001. pp. 1-2. |
| [2] | Ruiz, F., Abad, M., Bodergat, A. M., Carbonel, P., Rodrıguez-Lazaro, J., Gonzalez-Regalado, M. L., Toscano, A., Garcıa, E. X., Prenda, J. Freshwater ostracods as environmental tracers. International Journal of Environmental Science and Technology. 2013, 1-14. |
| [3] | Barnett, A., Beisner, B. Zooplankton biodiversity and lake trophic state: Explanations invoking resource abundance and distribution. Ecology. 2007, 88, 1675-86. |
| [4] | Xiong, W., Huang, X., Chen, Y., Fu, R., Du, X., Chen, X., Zhan, A. Zooplankton biodiversity monitoring in polluted freshwater ecosystems: A technical review. Environmental Science and Ecotechnology. 2020, 1, 100008. |
| [5] | Dakwen, J. P., Zebaze Togouet, S. H., Tuekam Kayo, R. P., Djeufa Heuchim, C., Nzieleu Tchapgnouo, J. G., Foto Menbohan, S., Njine, T. Physico-chemistry characterization and zooplankton specific diversity of two fishponds in Yaoundé (Cameroon, Central Africa). Journal of Biodiversity and Environmental Sciences. 2015, 6(2), 16-30. |
| [6] | Green, J. Ecological studies on crater lakes in West Cameroon Zooplankton of Barombi Mbo, Mboandong, Lake Kotto and Lake Soden. Journal of Zoology, 2009, 166, 283-301. |
| [7] | Kenfack Donhachi, A., Nkontcheu Kenko, D. B., Zebaze Tagning, P. D., Efole Ewoukem, T., Tchoumboue. Species Richness, Diversity and Distribution of Phytoplankton in Fertilised Ponds of the Western Highlands Agro-Ecological Zone of Cameroon. Asian Journal of Environment & Ecology, 2022, 19(4), 115-134. |
| [8] | Ndjouondo, G. P., Muyang, R. F., Nouck, A. E., Nwamo, R. D., Fotso, Tita, M. A., Dibong, S. D. Diversity and ecology of phytoplankton of Batika river (Yabassi, Cameroon). GSC Biological and Pharmaceutical Sciences. 2020, 11(02), 204–214. |
| [9] | Onana Fils, M., Zebaze Togouet, S. H., Nyamsi Tchatcho, N. L., Domche Teham, H. B., Ngassam, P. Distribution spatio-temporelle du zooplancton en relation avec les facteurs abiotiques dans un hydrosystème urbain: le ruisseau Kondi (Douala, Cameroun). Journal of Applied Biosciences, 2014, 82. 7326. |
| [10] | Balian, E. V., Segers, H., Leveque, C., Martens, K. The Freshwater Animal Diversity Assessment: An overview of the results. Hydrobiologia. 2008, 595, 627–637. |
| [11] | Gunkel, G. Evaluation of Invertebrates in Drinking Water Networks. Water. 2023, 15(7), 1391. |
| [12] |
WoRMS (World Register of Marine Species). “Arthropoda”. Available from
https://www.marinespecies.org [Accessed 8 March 2024]. |
| [13] |
ITIS (Integrated Taxonomic Information System). “Arthropoda”. Available from
www.itis.gov [Accessed 8 March 2024]. |
| [14] | Brummett, R. E., Nguenga, D., Tiotsop, F., Abina, J.-C. The commercial fishery of the middle Nyong River, Cameroon: productivity and environmental threats. Smithiana Bulletin. 2010, 11, 3-16. |
| [15] |
Climate-Data.org. Climat Kribi (Cameroun). Available from
https://fr.climate-data.org [Accessed 28 March 2022]. |
| [16] | Corriol, A., Becqué, R., Thorborg, H., Platenburg, R., Ngapoud, A., Koppert, G., Froment, A. Regional Environmental Assessment (REA) of the Kribi Region. National Hydrocarbon Corportion (SNH). Royal Haskoniiyq, Haskoning Nederland B. V. Environment, Québec; 2008, pp. 1-348. |
| [17] | WHO (World Health Organization). Guidelines for Drinking water Quality: fourth edition incorporating the first addendum. Geneva: Switzerland; 2017, pp. 541. |
| [18] | Fernando, C. H. A guide to tropical freshwater zooplankton: identification, ecology and impact on fisheries. Backhuys Publishers, Leiden; 2002, pp. 255-280. |
| [19] | Dumont, H. J., Benzie, J. A., Bayly, I., Dussart, B., Defaye, D., Einsle, U., Karaytug, S., Korovchinsky, N., Kotov, A. A., Negrea, S. V. Guides to the identification of the Microinvertebrates of the Continental Water of the World. Backuys Edit., Leiden, Netherlands; 2006, pp. 1-299. |
| [20] | Gutierrez-Aguirre, M. A., Suarez-Morales, E., Cervantes-Martinez, A., Elias-Gutierrez, M., Previattelli, D. The neotropical species of Mesocyclops (Copepoda, Cyclopoida): an upgraded identification key and comments on selected taxa. Journal of Natural History, 2006, 40(9–10), 549–570. |
| [21] | Sinev, A. Y. Key for identification of Cladocera of the subfamily Aloninae (Anomopoda: Chydoridae) from South-East Asia. Zootaxa, 2016, 4200(4), 451–486. |
| [22] |
Walter, T. C., Boxshall, G. “World of Copepods Database”. Accessed through World Register of Marine Species. Available from
https://www.marinespecies.org/aphia.php?p=taxdetails&id=355636 [Accessed 2 February 2024]. |
| [23] |
Brandão, S. N., Antonietto, L. S., Nery, D. G., Pereira, J. S., Praxedes, R. A., Santos, S. G., Karanovic, I. (2024). “World Ostracoda Database”. Accessed through: WoRMS. Available from
https://www.marinespecies.org/ostracoda [Accessed 2 February 2024]. |
| [24] | Bach, P., Amanieu, M., Lam-Hoai, T., Lasserre, G. Application du modele de distribution d'abondance de Mandelbrot a l'estimation des captures dans l'étang de Thau. Journal du Conseil/Conseil Permanent International pour l'Exploration de la Mer. 1988, 44, 235-246. |
| [25] | Murthy, Z. V. P. Nonlinear Regression: Levenberg-Marquardt Method, In Encyclopedia of Membranes, Drioli, E., Giorno L., Eds., Springer-Verlag, Berlin, Heidelberg; 2014, pp. 1-3. |
| [26] | Ludwig, J. A., Raynolds, J. F. Statistical Ecology. John Wiley & Sons, New York, USA; 1988, pp. 1-337. |
| [27] | Stambuk-Giljanovic, N. Water quality evaluation by index in Dalmatia. Water Research, 33(16), 3423-3440. |
| [28] | Mohebbi, M. R., Saeedi, R., Montazeri, A., Vaghefi, K. A., Labbafi, S., Oktaie, S., Abtahi, M., Mohagheghian, A. Assessment of water quality in groundwater resources of Iran using a modified drinking water quality index (DWQI). Ecological Indicators, 30, 2013, 28-34, |
| [29] | Aliyu, G. A., Jamil, N. R. B., Adam, M. B., Zulkeflee, Z. Assessment of Guinea Savanna River system to evaluate water quality and water monitoring networks. Global Journal of Environmental Science and Management, 20195(3); 1-12. |
| [30] | De Stasio, B. T., Golemgeski, T., Li, X., Larosiliere M. J., Livingstone, D. M. Temperature as a Driving Factor in Aquatic Ecosystems. Encyclopedia of Inland Waters, 2022, 257-269. |
| [31] | Davis, J. Survey of Aquaculture effluents permitting and 1993 standards in the South. Southern Regional Aquaculture Centre, SRAC publication no 465, USA; 1993, pp. 1-4. |
| [32] | Cotruvo, J. A. WHO Guidelines for Drinking Water Quality: First Addendum to the Fourth Edition. Journal American Water Works Association; 2017, 109, 44-51. |
| [33] | Lall, S. P.; Kaushik, S. J. Nutrition and Metabolism of Minerals in Fish. Animals, 2021, 11, 2711. |
| [34] | Chiambeng, G. Y., Dumont, H. J. The Branchiopoda (Crustacea: Anomopoda, Ctenopoda and Cyclestherida) of the rain forests of Cameroon, West Africa: low abundances, few endemics and a boreal–tropical disjunction. Journal of Biogeography, 2005, 32(9), 1611-1620. |
| [35] | Nzieleu Tchapgnouo, J. G., Njine, T., Zebaze Togouet, S. H., Djutso Segnou, S. C., Mahamat Tahir, T. S., Tchakonte, S., Pinel-Alloul, B. Diversité spécifique et abondance des communautés de copépodes, cladocères et rotifères des lacs du complexe Ossa (Dizangué, Cameroun). Physio-Géo, 2012, 71-93. |
| [36] | Gallo, B., Jackson, M. C, O’Gorman, E., Woodward, G. Adaptation of freshwater species to climate change. Grantham Institute, Briefing notes No 8. Imperial College, London, 2017, pp. 1-6. |
| [37] | Wilson, J. B. Methods for fitting dominance/diversity curves. Journal of Vegetation Science, 1991, 2(1), 35-46. |
| [38] | Castel, J., Courties, C. Composition and differential distribution of zooplankton in Arcachon Bay. Journal of Plankton Research. 1982, 4(3), 417-433. |
| [39] | Li W. Zipf's Law Everywhere. Glottometrics, 2002, 5, 14-2. |
APA Style
Sonkeng, G. K., Koji, E., Toukem, A. S. K., Mamert, O. F., Tsekane, S. J., et al. (2024). Biodiversity and Community Structure of Micro-Arthropods in the Memve’ele Dam, the Tributary River and the River Receiving the Evacuated Turbine Water (South-Cameroon). International Journal of Ecotoxicology and Ecobiology, 9(2), 56-87. https://doi.org/10.11648/j.ijee.20240902.11
ACS Style
Sonkeng, G. K.; Koji, E.; Toukem, A. S. K.; Mamert, O. F.; Tsekane, S. J., et al. Biodiversity and Community Structure of Micro-Arthropods in the Memve’ele Dam, the Tributary River and the River Receiving the Evacuated Turbine Water (South-Cameroon). Int. J. Ecotoxicol. Ecobiol. 2024, 9(2), 56-87. doi: 10.11648/j.ijee.20240902.11
AMA Style
Sonkeng GK, Koji E, Toukem ASK, Mamert OF, Tsekane SJ, et al. Biodiversity and Community Structure of Micro-Arthropods in the Memve’ele Dam, the Tributary River and the River Receiving the Evacuated Turbine Water (South-Cameroon). Int J Ecotoxicol Ecobiol. 2024;9(2):56-87. doi: 10.11648/j.ijee.20240902.11
@article{10.11648/j.ijee.20240902.11,
  author = {Gabin Kemgue Sonkeng and Ernest Koji and Andrea Sarah Kenne Toukem and Onana Fils Mamert and Sedrick Junior Tsekane and Auguste Pharaon Mbianda and Martin Kenne},
  title = {Biodiversity and Community Structure of Micro-Arthropods in the Memve’ele Dam, the Tributary River and the River Receiving the Evacuated Turbine Water (South-Cameroon)
},
  journal = {International Journal of Ecotoxicology and Ecobiology},
  volume = {9},
  number = {2},
  pages = {56-87},
  doi = {10.11648/j.ijee.20240902.11},
  url = {https://doi.org/10.11648/j.ijee.20240902.11},
  eprint = {https://article.sciencepublishinggroup.com/pdf/10.11648.j.ijee.20240902.11},
  abstract = {A survey was undertaken from July 2021 to January 2022 in South-Cameroon on the biodiversity of micro-arthopods in the Memve’ele dam (Site 1), the tributary river (Site 2) and the adjacent river (Sites 3 and 4). Four abiotic parameters were measured in-situ while nine other abiotic parameters were measured in the laboratory using standard methods. Micro-arthopods were counted and identified. Water quality was determined. BOD5, conductivity, NO2-, NO3-, pH, PO43-, temperature and suspended solids were on average within the standards for drinking water. Chlorophyll a, color, DO, NH4+ and turbidity values were on average above the standard upper limits. Based on the water quality index (WQI) raw waters were unfit for direct drinking (Dam: WQI=898.864; Site 2: WQI=752.451; Site 3: WQI=883.808; and Site 4: WQI=1,665.883) and presented ideal conditions for fish farming or irrigation for agriculture. A total of 5,487 specimens belonged to three classes, eight orders, 20 families, 57 genera, and 87 species and morphospecies (54 freshwater and 33 tolerant species able to develop in at least two water environments). Ectocyclops sp. was the most recorded species (10.6%), followed by Cyclops sp. (9.1%), Alona costata (8.9%), Mesocyclops sp. (7.9%), Tropocyclops sp. (7.5%), Senecella calanoides (6.8%), Diaphanosoma sarsi (6.1%), while other species were represented each by less than 5.0%. Low species richness, high species diversity and a very low dominance by a few species were noted. Assemblages were highly even (Pielou’s index close to 1). Species exhibited in all sites, a positive global net association. The assemblage recorded during the wet season at Site 3 functioned as a pioneer community (Broken-Stick model) while, the assemblage recorded during the dry season at Site 2 and the one recorded during the dry season at Site 3 functioned as nomocenosis (log-linear or log-normal models) and were therefore little evolved. In contrast, during the two seasons in the dam and Site 4, as well as during the rainy season in Site 2 and the combined seasons in Site 3, the assemblages functioned as highly evolved communities (Zipf or Zipf-models) with significant regenerative force, suggesting that these assemblages maintained a complex information network developed at spatio-temporal scales. The evolved state (close to natural balance) of the micro-arthopods communities should be preserved and protected.
},
 year = {2024}
}
TY  - JOUR
T1  - Biodiversity and Community Structure of Micro-Arthropods in the Memve’ele Dam, the Tributary River and the River Receiving the Evacuated Turbine Water (South-Cameroon)

AU  - Gabin Kemgue Sonkeng
AU  - Ernest Koji
AU  - Andrea Sarah Kenne Toukem
AU  - Onana Fils Mamert
AU  - Sedrick Junior Tsekane
AU  - Auguste Pharaon Mbianda
AU  - Martin Kenne
Y1  - 2024/05/24
PY  - 2024
N1  - https://doi.org/10.11648/j.ijee.20240902.11
DO  - 10.11648/j.ijee.20240902.11
T2  - International Journal of Ecotoxicology and Ecobiology
JF  - International Journal of Ecotoxicology and Ecobiology
JO  - International Journal of Ecotoxicology and Ecobiology
SP  - 56
EP  - 87
PB  - Science Publishing Group
SN  - 2575-1735
UR  - https://doi.org/10.11648/j.ijee.20240902.11
AB  - A survey was undertaken from July 2021 to January 2022 in South-Cameroon on the biodiversity of micro-arthopods in the Memve’ele dam (Site 1), the tributary river (Site 2) and the adjacent river (Sites 3 and 4). Four abiotic parameters were measured in-situ while nine other abiotic parameters were measured in the laboratory using standard methods. Micro-arthopods were counted and identified. Water quality was determined. BOD5, conductivity, NO2-, NO3-, pH, PO43-, temperature and suspended solids were on average within the standards for drinking water. Chlorophyll a, color, DO, NH4+ and turbidity values were on average above the standard upper limits. Based on the water quality index (WQI) raw waters were unfit for direct drinking (Dam: WQI=898.864; Site 2: WQI=752.451; Site 3: WQI=883.808; and Site 4: WQI=1,665.883) and presented ideal conditions for fish farming or irrigation for agriculture. A total of 5,487 specimens belonged to three classes, eight orders, 20 families, 57 genera, and 87 species and morphospecies (54 freshwater and 33 tolerant species able to develop in at least two water environments). Ectocyclops sp. was the most recorded species (10.6%), followed by Cyclops sp. (9.1%), Alona costata (8.9%), Mesocyclops sp. (7.9%), Tropocyclops sp. (7.5%), Senecella calanoides (6.8%), Diaphanosoma sarsi (6.1%), while other species were represented each by less than 5.0%. Low species richness, high species diversity and a very low dominance by a few species were noted. Assemblages were highly even (Pielou’s index close to 1). Species exhibited in all sites, a positive global net association. The assemblage recorded during the wet season at Site 3 functioned as a pioneer community (Broken-Stick model) while, the assemblage recorded during the dry season at Site 2 and the one recorded during the dry season at Site 3 functioned as nomocenosis (log-linear or log-normal models) and were therefore little evolved. In contrast, during the two seasons in the dam and Site 4, as well as during the rainy season in Site 2 and the combined seasons in Site 3, the assemblages functioned as highly evolved communities (Zipf or Zipf-models) with significant regenerative force, suggesting that these assemblages maintained a complex information network developed at spatio-temporal scales. The evolved state (close to natural balance) of the micro-arthopods communities should be preserved and protected.

VL  - 9
IS  - 2
ER  -
Department of Biology and Physiology of Animal Organisms, Faculty of Science, University of Douala, Douala, Cameroon
Department of Biology and Physiology of Animal Organisms, Faculty of Science, University of Douala, Douala, Cameroon
Department of Biology and Physiology of Animal Organisms, Faculty of Science, University of Douala, Douala, Cameroon
Institute of Fisheries and Aquatic Sciences of Yabassi, University of Douala, Douala, Cameroon
Department of Biology and Physiology of Animal Organisms, Faculty of Science, University of Douala, Douala, Cameroon
Department of Biology of Vegetal Organisms, Faculty of Science, University of Douala, Douala, Cameroon
Department of Biology and Physiology of Animal Organisms, Faculty of Science, University of Douala, Douala, Cameroon
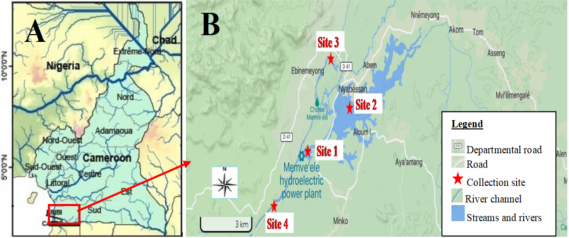
Figure 1. Location of the study sites in South Cameroon. A: location of the Ntem basin in Cameroon). B: Location of the water collection sites.
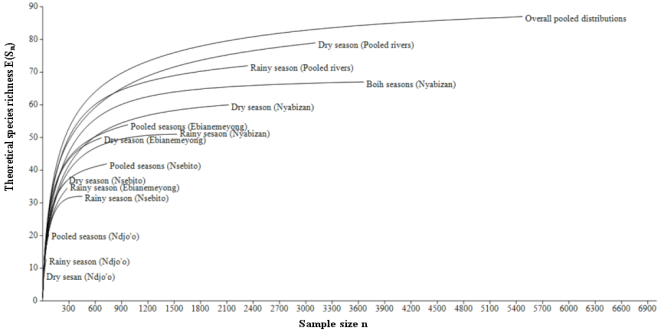
Figure 2. Individual rarefaction curves of the aquatic micro-arthropods in the studied rivers.
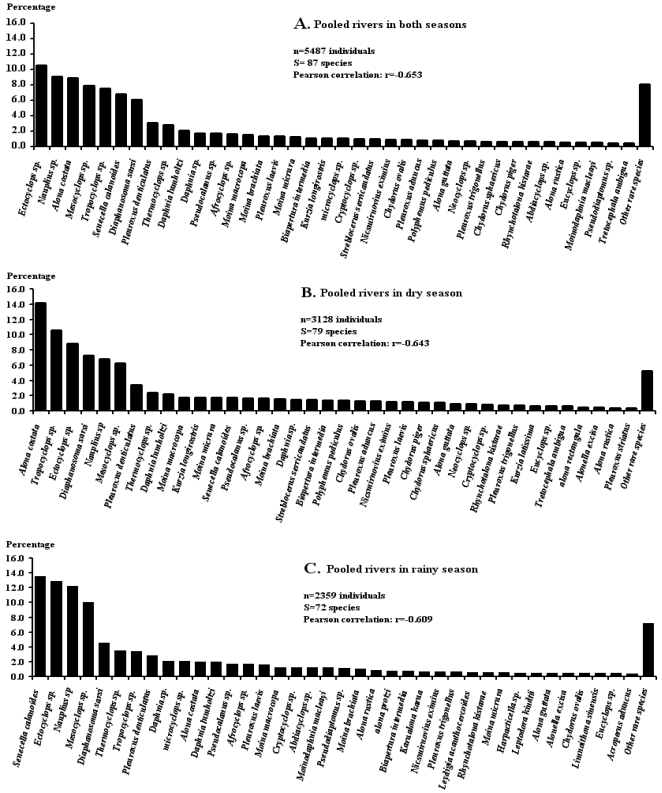
Figure 3. Rank-frequency diagrams of the pooled collected aquatic arthropods in four rivers during two seasons, showing species in decreasing order of numerical occurrence. Lists of other rare species are presented in Table 2.
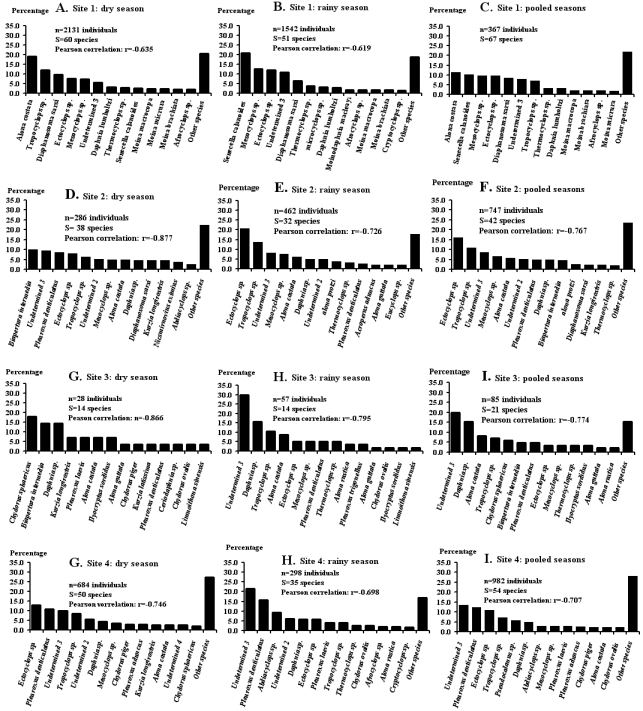
Figure 4. Rank-frequency diagrams of the aquatic arthropods species abundance distributions (SADs) in four rivers, showing species in decreasing order of numerical occurrence. Lists of other rare species are presented in the text.
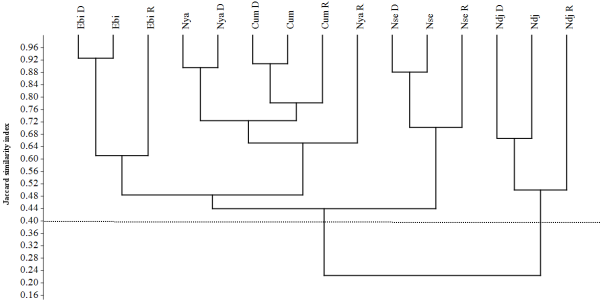
Figure 5. Hierarchical Cluster Analysis based on Jaccard’s index using the “Unweighted Pair Group Method with Arithmetic mean” (UPGMA) algorithm and showing similarity in aquatic micro-arthropd assemblages among four sites (Cophenetic correlation: 0.94). Ebi D: Ebianemeyong river in dry season (Site 4); Ebi R: Enianemeyong river in rainy season (Site 4); Ebi: pooled seasons in Ebianemeyong river (Site 4); Nya D: Nyabizan river in dry season (dam); Nya R: Nyabizan river in rainy season (dam); Nya: pooled seasons in Nyabizan river (dam); Ndj D: Ndjo’o river in dry season (Site 3); Ndj R: Ndjo’o river in rainy season (Site 3); Ndj: pooled seasons (Site 3); Nse D: Nsebito river in dry season (Site 2); Nse R: Nsebito river in rainy season (Site 2); Nse: pooled seasons in Nsebito river (Site 2); Cum D: Pooled rivers in dry season; Cum R: Pooled rivers in rainy season; Cum: pooled seasons in pooled rivers.
Information

