Background: Dysglycemia is frequently encountered in the ICU and it includes hyperglycemia, hypoglycemia and glycemic variability which are associated with increased rate of mortality and morbidity. Hyperglycemia is the most frequent among the components of dysglycemia and its prevalence is 40-90%. The prevalence and outcome of multiple glycemic parameters in the ICU has not been described in Ethiopia. Objectives: The aim of the study is to describe the effect of multiple glycemic parameters on intensive care unit mortality and clinical outcomes in selected tertiary hospitals. Methods: An institution based cross-sectional study was conducted by using systematic random sampling. Data was collected from patient cards and was entered using Epi Info 7.2. Data analysis was done using SPSS 27.0. Descriptive statistics was used to summarize the data. Associations between variables were measured with chi square and Mann Whitney U test. Multivariable logistic regression was used to identify predictors of mortality and test the association of multiple glycemic parameters and mortality. Odds ratios with 95% confidence intervals were calculated, and a p-value <0.05 was considered to declare significance Result: The study included 392 patient records, with a median age of 38 years [IQR 28 – 56]. About 53% of patients were females. The prevalence of hyperglycemia, hypoglycemia and high glycemic variability was 90.3%, 16.3% and 19.4% respectively. Hypoglycemia was significantly associated with mortality (AOR 2.98, p < .05). Patients with hyperglycemia and hypoglycemia had significantly longer lengths of stay and durations of mechanical ventilation. High glycemic variability was not significantly associated with mortality, length of stay or duration of mechanical ventilation. Conclusion: Dysglycemia is very prevalent among patients admitted in the ICU and hypoglycemia may be associated with ICU mortality and adverse clinical outcomes.
| Published in | International Journal of Diabetes and Endocrinology (Volume 10, Issue 2) |
| DOI | 10.11648/j.ijde.20251002.11 |
| Page(s) | 26-36 |
| Creative Commons |
This is an Open Access article, distributed under the terms of the Creative Commons Attribution 4.0 International License (http://creativecommons.org/licenses/by/4.0/), which permits unrestricted use, distribution and reproduction in any medium or format, provided the original work is properly cited. |
| Copyright |
Copyright © The Author(s), 2025. Published by Science Publishing Group |
Critical Illness, Dysglycemia, Stress Hyperglycemia, Hypoglycemia, Glycemic Variability, Mortality
Characteristics | Overall | ICU Mortality | p value | |
|---|---|---|---|---|
Dead | Alive | |||
Study Participants | 392 (100.0) | 138 (35.2) | 254 (64.8) | NA |
Age, M (IQR) | 38 (28 - 56) | 38 (28 - 54) | 38 (30 - 56) | .653 |
Age Group (yrs.) | ||||
18–30 | 124 (31.6) | 42 (33.9) | 82 (66.1) | .008 |
31–40 | 94 (24.0) | 30 (31.9) | 64 (68.1) | |
41-50 | 54 (13.8) | 28 (51.9) | 26 (48.1) | |
51-60 | 44 (11.2) | 14 (31.8) | 30 (68.2) | |
61-70 | 48 (12.2) | 10 (20.8) | 38 (79.2) | |
71-80 | 20 (5.1) | 8 (40.0) | 12 (60.0) | |
> 80 | 8 (2.0) | 6 (75.0) | 2 (25.0) | |
Sex | ||||
Female | 186 (47.4) | 72 (38.7) | 114 (61.3) | .161 |
Male | 206 (52.6) | 66 (32.0) | 140 (68.0) | |
Address | ||||
Addis Ababa (city) | 246 (62.8) | 90 (36.6) | 156 (63.4) | .01 |
Afar Region | 2 (0.5) | 0 (0.0) | 2 (100.0) | |
Amhara Region | 18 (4.6) | 12 (66.7) | 6 (33.3) | |
Oromia Region | 96 (24.5) | 24 (25.0) | 72 (75.0) | |
Southern Nations, Nationalities and Peoples | 16 (4.1) | 6 (37.5) | 10 (62.5) | |
Tigray Region | 8 (2.0) | 4 (50.0) | 4 (50.0) | |
Others | 6 (1.5) | 2 (33.3) | 4 (66.7) | |
Characteristics | Overall | ICU Mortality | p value* | |
|---|---|---|---|---|
Dead | Alive | |||
Study Participants | 392 (100.0) | 138 (35.2) | 254 (64.8) | NA |
Acute Kidney Injury | 148 (37.8) | 64 (43.2) | 84 (56.8) | .012 |
Acute Myocardial Infarction | 8 (2.0) | 2 (25.0) | 6 (75.0) | .718 |
Acute Heart Failure | 40 (10.2) | 12 (30.0) | 28 (70.0) | .601 |
Acute Cerebral accident | 28 (7.1) | 4 (14.3) | 24 (85.7) | .022 |
Hospital Acquired Infections | 154 (39.3) | 60 (39.0) | 94 (61.0) | .234 |
CNS Infections** | 10 (2.6) | 4 (40.0) | 6 (60.0) | .746 |
Shock | 78 (19.9) | 44 (56.4) | 34 (43.6) | <.001 |
Type of shock | ||||
No Shock | 314 (80.1) | 94 (29.9) | 220 (70.1) | <.001 |
Septic Shock | 56 (14.3) | 38 (67.9) | 18 (32.1) | |
Hypovolemic Shock | 4 (1.0) | 0 (0.0) | 4 (100.0) | |
Cardiogenic Shock | 18 (4.6) | 6 (33.3) | 12 (66.7) | |
Respiratory Failure | 104 (26.5) | 60 (57.7) | 44 (42.3) | <.001 |
Acute Liver Failure | 16 (4.1) | 10 (62.5) | 6 (37.5) | .03 |
Tuberculosis | 22 (5.6) | 12 (54.5) | 10 (45.5) | .065 |
Venous thromboembolism | 18 (4.6) | 6 (33.3) | 12 (66.7) | .865 |
Others | 100 (25.5) | 10 (10.0) | 90 (90.0) | <.001 |
*p values are for Pearson’s chi square test. ** CNS – Central nervous system. | ||||
Characteristics | Overall | ICU Mortality | p value* | |
|---|---|---|---|---|
Dead | Alive | |||
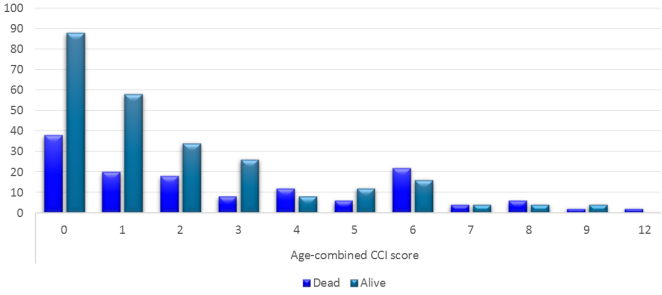
Age-combined CCI, M (IQR) | 1 (0 - 4) | 2 (0 - 6) | 1 (0 - 3) | .001 |
Glycemic Profiles | ||||
Stress Hyperglycemia | 8 (2.0) | 0 (0.0) | 8 (100.0) | .055 |
Hyperglycemia | 354 (90.3) | 122 (34.5) | 232 (65.5) | .371 |
Hypoglycemia | 64 (16.3) | 38 (59.4) | 26 (40.6) | <.001 |
High Glycemic Variability | 76 (19.4) | 32 (42.1) | 44 (57.9) | .161 |
Glycemic variability, M (IQR) | 26.1 (19.8 - 32.7) | 27.21 (21.2 - 35.6) | 24.7 (19.1 - 30.5) | .009 |
Medications given in the ICU | ||||
Use of insulin | 66 (16.8) | 16 (24.2) | 50 (75.8) | .048 |
Mode of insulin | ||||
None | 326 (83.2) | 122 (37.4) | 204 (62.6) | .065 |
Subcutaneous | 56 (14.3) | 12 (21.4) | 44 (78.6) | |
Intravenous | 10 (2.6) | 4 (40.0) | 6 (60.0) | |
Use of any glucocorticoids | 78 (19.9) | 42 (53.8) | 36 (46.2) | <.001 |
Use of any Vasopressors | 122 (31.1) | 86 (70.5) | 36 (29.5) | <.001 |
Dose of Steroids. (mg), M (IQR) ** | 800 (360 - 1280) | 640 (250 - 853) | 1085 (640 - 1800) | .001 |
Dose of Vasopressors (mg), M (IQR) *** | 42.6 (5 - 93) | 52 (10 - 166) | 15 (5 - 53) | .002 |
Dose of Insulin, M (IQR) | 60 (19 – 210) | 146.5 (13.5 - 225.5) | 49 (19 - 187) | .719 |
Abbreviations: CCI – Charlson Comorbidity Index, ICU – Intensive Care Unit, M (IQR) – Median (interquartile range). *p values are for Pearson’s Chi-square test of independence, except: Mann-Whitney U test for Doses of Steroid, vasopressor, insulin, glycemic variability, and age-combined CCI. ** Dose of steroids are in hydrocortisone equivalent doses. *** Doses of vasopressors are in noradrenaline equivalent doses. | ||||
Parameter | COR (95%CI) | AOR (95%CI) | p value |
|---|---|---|---|
Age Groups (years) | |||
18–30 | 1 | 1 | |
31–40 | 0.92 (0.52, 1.62) | 0.79 (0.39, 1.62) | 0.515 |
41-50 | 2.103 (1.10, 4.03) | 2.31 (0.95, 5.64) | 0.066 |
51-60 | 0.91 (0.44, 1.90) | 0.64 (0.22, 1.85) | 0.408 |
61-70 | 0.51 (0.23, 1.13) | 0.17 (0.05, 0.54) | 0.003 |
71-80 | 1.30 (0.49, 3.43) | 1.24 (0.33, 4.63) | 0.747 |
> 80 | 5.86 (1.13, 30.28) | 1.09 (0.14, 8.29) | 0.935 |
Age-combined CCI | 1.17 (1.08, 1.27) | 1.30 (1.14, 1.47) | <0.001 |
Acute Kidney Injury | 1.75 (1.14, 2.68) | 1.15 (0.62, 2.11) | 0.658 |
Acute Cerebral Accident | 0.286 (0.1, 0.84) | 0.86 (0.24, 3.16) | 0.825 |
Shock | 3.029 (1.821, 5.04) | 0.48 (0.20, 1.15) | 0.101 |
Respiratory Failure | 3.67 (2.30, 5.86) | 4.84 (2.47, 9.48) | <0.001 |
Acute Liver Failure | 3.23 (1.15, 9.09) | 0.68 (0.17, 2.75) | 0.585 |
Hypoglycemia | 3.33 (1.92, 5.78) | 2.98 (1.34, 6.62) | 0.007 |
Glycemic variability | 1.02 (1.00, 1.04) | 1.00 (0.98, 1.03) | 0.798 |
Use of insulin | 0.54 (0.29, 0.98) | 0.19 (0.08, 0.48) | <0.001 |
Use of glucocorticoids | 2.65 (1.60, 4.39) | 1.19 (0.58, 2.42) | 0.642 |
Use of vasopressors | 10.02 (6.12, 16.40) | 13.67 (6.39, 29.23) | <0.001 |
Glycemic profiles | Count | Length of stay (Days) | ||||
|---|---|---|---|---|---|---|
Mean | Median | IQR | p value | |||
Hyperglycemia | No | 38 | 3.32 | 2 | 1-4 | <0.001 |
Yes | 354 | 8.15 | 6 | 3-9 | ||
Hypoglycemia | No | 328 | 7.05 | 5 | 3-8 | 0.005 |
Yes | 64 | 10.91 | 6.5 | 3.5-13.5 | ||
High GV | No | 316 | 7.91 | 5 | 3-9 | 0.53 |
Yes | 76 | 6.74 | 4.5 | 3-8 | ||
Glycemic profiles | Count | Duration of MV (Days) | ||||
|---|---|---|---|---|---|---|
Mean | Median | IQR | p value | |||
Hyperglycemia | No | 38 | 1.11 | 0 | 0-2 | 0.04 |
Yes | 354 | 3.44 | 1 | 0-5 | ||
Hypoglycemia | No | 328 | 2.49 | 0 | 0-3 | <0.001 |
Yes | 64 | 6.88 | 3 | 0-7 | ||
High GV | No | 316 | 3.27 | 1 | 0-4 | 0.60 |
Yes | 76 | 2.97 | 1.5 | 0-4 | ||
ADA | American Diabetic Association |
AOR | Adjusted Odds Ratio |
APACHE | Acute Physiology and Chronic Health Evaluation |
BG | Blood Glucose |
CCI | Charlson Comorbidity Index |
CRP | C-reactive Protein |
CV | coefficient of Variance |
DM | Diabetes Mellitus |
GV | Glycemic Variability |
HbA1c | Glycohemoglobin, Hemoglobin A1c |
HMIS | Health Management Information System |
ICU | Intensive Care Unit |
IQR | Interquartile Range |
LOS | Length of Stay |
MV | Mechanical Ventilator |
OR | Odds Ratio |
SD | Standard Deviation |
SAPS3 | Simplified Acute Physiology III |
SOFA | Sequential Organ Failure Assessment |
SPHMMC | St. Paul’s Hospital Millennium Medical College |
TASH | Tikur Anbessa Specialized Hospital |
VTE | Venous Thromboembolism |
| [1] | Wotiye AB, Shimber ET, Ayele BA. Factors Associated with ICU Mortality at Hawassa University Comprehensive Specialized Hospital (HUCSH). Ethiop J Health Sci. 2022 May 1; 32(3): 505. |
| [2] | Mamtani M, Kulkarni H, Bihari S, Prakash S, Chavan S, Huckson S, et al. Degree of hyperglycemia independently associates with hospital mortality and length of stay in critically ill, nondiabetic patients: Results from the ANZICS CORE binational registry. J Crit Care. 2020 Feb 1; 55: 149–56. |
| [3] | ElSayed NA, Aleppo G, Aroda VR, Bannuru RR, Brown FM, Bruemmer D, et al. 16. Diabetes Care in the Hospital: Standards of Care in Diabetes—2023. Diabetes Care. 2023 Jan 1; 46(Supplement_1): S267–78. |
| [4] | Ellahham S. Insulin therapy in critically ill patients. Vol. 6, Vascular Health and Risk Management. 2010. p. 1089–101. |
| [5] | Krinsley JS. Glycemic variability: A strong independent predictor of mortality in critically ill patients. Crit Care Med. 2008; 36(11): 3008–13. |
| [6] | Umpierrez GE, Isaacs SD, Bazargan N, You X, Thaler LM, Kitabchi AE. Hyperglycemia: An Independent Marker of In-Hospital Mortality in Patients with Undiagnosed Diabetes. J Clin Endocrinol Metab. 2002 Mar 1; 87(3): 978–82. |
| [7] | Mifsud S, Schembri EL, Gruppetta M. Stress-induced hyperglycaemia. Br J Hosp Med. 2018 Nov 2; 79(11): 634–9. |
| [8] | Egi M, Furushima N, Makino S, Mizobuchi S. Glycemic control in acute illness. Vol. 70, Korean Journal of Anesthesiology. Korean Society of Anesthesiologists; 2017. p. 591–5. |
| [9] | Zhou Z, Sun B, Huang S, Zhu C, Bian M. Glycemic variability: adverse clinical outcomes and how to improve it? Vol. 19, Cardiovascular Diabetology. BioMed Central; 2020. |
| [10] | Hermanides J, Vriesendorp TM, Bosman RJ, Zandstra DF, Hoekstra JB, Devries JH. Glucose variability is associated with intensive care unit mortality. Crit Care Med. 2010; 38(3): 838–42. |
| [11] | About – Saint Paul’s Millennium Medical College. Available from: |
| [12] | Tsegay K, Teklu T, Debebe F, Beza L. Outcomes of Patients on Mechanical Ventilation among Adult Intensive Care Units of Tikur Anbesa Specialized Hospital, Addis Ababa, Ethiopia. 2023. |
| [13] | Brunner R, Adelsmayr G, Herkner H, Madl C, Holzinger U. Glycemic variability and glucose complexity in critically ill patients: a retrospective analysis of continuous glucose monitoring data. 2012. |
| [14] | Charlson ME, Pompei P, Ales KL, MacKenzie CR: A New Method of Classifying Prognostic Comorbidity in Longitudinal Studies: Development and Validation. Journal of Chronic Diseases 40: 373-383, 1987. |
| [15] | Quan H, Li B, Couris CM, Fushimi K, Graham P, Hider P, Januel JM, Sundararajan V. Updating and Validating the Charlson Comorbidity Index and Score for Risk Adjustment in Hospital Discharge Abstracts Using Data From 6 Countries. Am. J. Epidemiol. (2011). |
| [16] | Radovanovic D, Seifert B, Urban P, Eberli FR, Rickli H, Bertel O, Puhan MA, Erne P; AMIS Plus Investigators. Validity of Charlson Comorbidity Index in patients hospitalised with acute coronary syndrome. Insights from the nationwide AMIS Plus registry 2002-2012. Heart. 2014 Feb; 100(4): 288-94. |
| [17] | Kotani, Y., Di Gioia, A., Landoni, G., Belletti, A., & Khanna, A. K. (2023). An updated “norepinephrine equivalent” score in intensive care as a marker of shock severity. Critical Care, 27(1). |
| [18] | Meikle AW and Tyler FH. Potency and duration of action of glucocorticoids. Am J of Med 1977; 63; 200. (456). |
| [19] | Czock D, Keller F, Rasche FM, Häussler U. Pharmacokinetics and pharmacodynamics of systemically administered glucocorticoids. Clin Pharmacokinet. 2005; 44(1): 61-98. |
| [20] | Temel Ş, Yüksel RC, Gündoğan K, Ülgey A, Güven M, Sungur M. Stress hyperglycemia incidence in critically ill patients: Cross-sectional observational study. Journal of Medical and Surgical Intensive Care Medicine. 2018 Aug 1; 9(2): 46–50. |
| [21] | Khalil U, Ghoniem M, Khalil OA, Yuossef MM, Sherif MM, Alnahall A. Epidemiology and clinical outcome of ICU-acquired Stress hyperglycemia in Critically ill Medical patients (Single center study). Vol. 9, J Am Sci. 2013. |
| [22] | Stoudt K, Chawla S. Don’t Sugar Coat It: Glycemic Control in the Intensive Care Unit. Vol. 34, Journal of Intensive Care Medicine. SAGE Publications Inc.; 2019. p. 889–96. |
| [23] | Krinsley J, Schultz MJ, Spronk PE, van Braam Houckgeest F, van der Sluijs JP, Mélot C, et al. Mild hypoglycemia is strongly associated with increased intensive care unit length of stay. Ann Intensive Care. 2011 Dec; 1(1). |
| [24] | Fong KM, Au SY, Ng GWY. Glycemic control in critically ill patients with or without diabetes. BMC Anesthesiol. 2022 Dec 1; 22(1): 1–11. |
| [25] | Egi M, Bellomo R, Stachowski E, French CJ, Hart GK, Taori G, et al. Hypoglycemia and outcome in critically ill patients. Mayo Clin Proc. 2010; 85(3): 217–24. |
| [26] | Bellaver P, Schaeffer AF, Dullius DP, Viana M v., Leitão CB, Rech TH. Association of multiple glycemic parameters at intensive care unit admission with mortality and clinical outcomes in critically ill patients. Sci Rep. 2019 Dec 1; 9(1). |
| [27] | Yatabe, T., Inoue, S., Sakaguchi, M. et al. The optimal target for acute glycemic control in critically ill patients: a network meta-analysis. Intensive Care Med 43, 16–28 (2017). |
| [28] | Standards of Care in Diabetes-2023. 2022; Available from: |
| [29] | The NICE-SUGAR study investigators. Intensive versus Conventional Glucose Control in Critically Ill Patients. New England Journal of Medicine. 2009 Mar 26; 360(13): 1283–97. |
APA Style
Zewde, W. Z., Mamo, A. G., Afework, H. Y., Desalegn, M. M., Hayle, E. B., et al. (2025). The Effect of Multiple Glycemic Parameters on Mortality and Clinical Outcomes in Critically Ill Patients in Intensive Care Unit. International Journal of Diabetes and Endocrinology, 10(2), 26-36. https://doi.org/10.11648/j.ijde.20251002.11
ACS Style
Zewde, W. Z.; Mamo, A. G.; Afework, H. Y.; Desalegn, M. M.; Hayle, E. B., et al. The Effect of Multiple Glycemic Parameters on Mortality and Clinical Outcomes in Critically Ill Patients in Intensive Care Unit. Int. J. Diabetes Endocrinol. 2025, 10(2), 26-36. doi: 10.11648/j.ijde.20251002.11
@article{10.11648/j.ijde.20251002.11,
  author = {Wasihun Zerfu Zewde and Amare Gulilat Mamo and Helina Yohannes Afework and Mahlet Mitiku Desalegn and Ermiyas Berehanu Hayle and Zewdu Abadi Tsegay and Mehariw Wondim Netsere and Amir Muhidin Abrahim and Yeabtsega Amlaku Asres},
  title = {The Effect of Multiple Glycemic Parameters on Mortality and Clinical Outcomes in Critically Ill Patients in Intensive Care Unit
},
  journal = {International Journal of Diabetes and Endocrinology},
  volume = {10},
  number = {2},
  pages = {26-36},
  doi = {10.11648/j.ijde.20251002.11},
  url = {https://doi.org/10.11648/j.ijde.20251002.11},
  eprint = {https://article.sciencepublishinggroup.com/pdf/10.11648.j.ijde.20251002.11},
  abstract = {Background: Dysglycemia is frequently encountered in the ICU and it includes hyperglycemia, hypoglycemia and glycemic variability which are associated with increased rate of mortality and morbidity. Hyperglycemia is the most frequent among the components of dysglycemia and its prevalence is 40-90%. The prevalence and outcome of multiple glycemic parameters in the ICU has not been described in Ethiopia. Objectives: The aim of the study is to describe the effect of multiple glycemic parameters on intensive care unit mortality and clinical outcomes in selected tertiary hospitals. Methods: An institution based cross-sectional study was conducted by using systematic random sampling. Data was collected from patient cards and was entered using Epi Info 7.2. Data analysis was done using SPSS 27.0. Descriptive statistics was used to summarize the data. Associations between variables were measured with chi square and Mann Whitney U test. Multivariable logistic regression was used to identify predictors of mortality and test the association of multiple glycemic parameters and mortality. Odds ratios with 95% confidence intervals were calculated, and a p-value <0.05 was considered to declare significance Result: The study included 392 patient records, with a median age of 38 years [IQR 28 – 56]. About 53% of patients were females. The prevalence of hyperglycemia, hypoglycemia and high glycemic variability was 90.3%, 16.3% and 19.4% respectively. Hypoglycemia was significantly associated with mortality (AOR 2.98, p < .05). Patients with hyperglycemia and hypoglycemia had significantly longer lengths of stay and durations of mechanical ventilation. High glycemic variability was not significantly associated with mortality, length of stay or duration of mechanical ventilation. Conclusion: Dysglycemia is very prevalent among patients admitted in the ICU and hypoglycemia may be associated with ICU mortality and adverse clinical outcomes.
},
 year = {2025}
}
TY  - JOUR
T1  - The Effect of Multiple Glycemic Parameters on Mortality and Clinical Outcomes in Critically Ill Patients in Intensive Care Unit

AU  - Wasihun Zerfu Zewde
AU  - Amare Gulilat Mamo
AU  - Helina Yohannes Afework
AU  - Mahlet Mitiku Desalegn
AU  - Ermiyas Berehanu Hayle
AU  - Zewdu Abadi Tsegay
AU  - Mehariw Wondim Netsere
AU  - Amir Muhidin Abrahim
AU  - Yeabtsega Amlaku Asres
Y1  - 2025/04/22
PY  - 2025
N1  - https://doi.org/10.11648/j.ijde.20251002.11
DO  - 10.11648/j.ijde.20251002.11
T2  - International Journal of Diabetes and Endocrinology
JF  - International Journal of Diabetes and Endocrinology
JO  - International Journal of Diabetes and Endocrinology
SP  - 26
EP  - 36
PB  - Science Publishing Group
SN  - 2640-1371
UR  - https://doi.org/10.11648/j.ijde.20251002.11
AB  - Background: Dysglycemia is frequently encountered in the ICU and it includes hyperglycemia, hypoglycemia and glycemic variability which are associated with increased rate of mortality and morbidity. Hyperglycemia is the most frequent among the components of dysglycemia and its prevalence is 40-90%. The prevalence and outcome of multiple glycemic parameters in the ICU has not been described in Ethiopia. Objectives: The aim of the study is to describe the effect of multiple glycemic parameters on intensive care unit mortality and clinical outcomes in selected tertiary hospitals. Methods: An institution based cross-sectional study was conducted by using systematic random sampling. Data was collected from patient cards and was entered using Epi Info 7.2. Data analysis was done using SPSS 27.0. Descriptive statistics was used to summarize the data. Associations between variables were measured with chi square and Mann Whitney U test. Multivariable logistic regression was used to identify predictors of mortality and test the association of multiple glycemic parameters and mortality. Odds ratios with 95% confidence intervals were calculated, and a p-value <0.05 was considered to declare significance Result: The study included 392 patient records, with a median age of 38 years [IQR 28 – 56]. About 53% of patients were females. The prevalence of hyperglycemia, hypoglycemia and high glycemic variability was 90.3%, 16.3% and 19.4% respectively. Hypoglycemia was significantly associated with mortality (AOR 2.98, p < .05). Patients with hyperglycemia and hypoglycemia had significantly longer lengths of stay and durations of mechanical ventilation. High glycemic variability was not significantly associated with mortality, length of stay or duration of mechanical ventilation. Conclusion: Dysglycemia is very prevalent among patients admitted in the ICU and hypoglycemia may be associated with ICU mortality and adverse clinical outcomes.

VL  - 10
IS  - 2
ER  -
Departement of Internal Medicine, St. Paul’s Hospital Millennium Medical College, Addis Ababa, Ethiopia
Biography: Wasihun Zerfu Zewde is a 2024 graduate of internal medicine from SPHMMC currently working in Arbaminch General Hospital. He completed his undergraduate studies from Addis Ababa University in 2018. He has worked in the rural parts of Ethiopia for 2 years before joining residency program.

Departement of Internal Medicine, St. Paul’s Hospital Millennium Medical College, Addis Ababa, Ethiopia
School of Medicine, Jimma University, Jimma, Ethiopia
Departement of Internal Medicine, St. Paul’s Hospital Millennium Medical College, Addis Ababa, Ethiopia
Departement of Internal Medicine, St. Paul’s Hospital Millennium Medical College, Addis Ababa, Ethiopia
School of Medicine, Addis Ababa University, Addis Ababa, Ethiopia
Departement of Internal Medicine, St. Paul’s Hospital Millennium Medical College, Addis Ababa, Ethiopia
Department of Emergency Medicine, Adama Hospital Medical College, Adama, Ethiopia
School of Medicine, Addis Ababa University, Addis Ababa, Ethiopia
Information