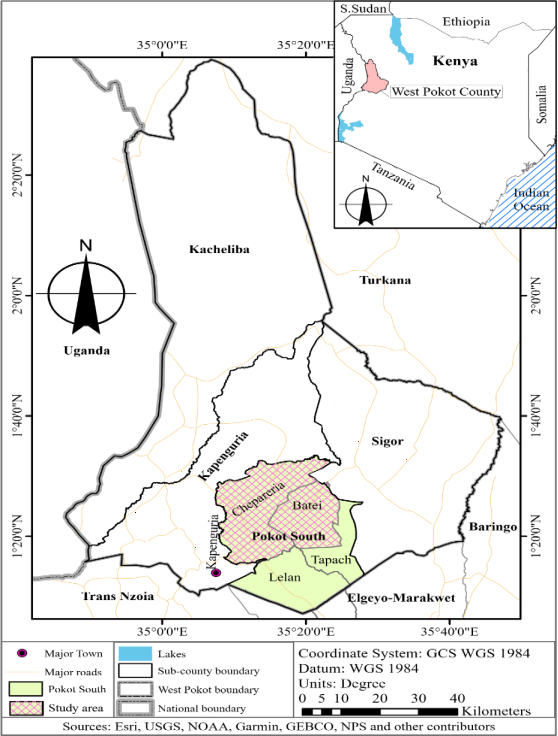
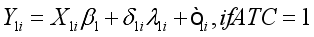
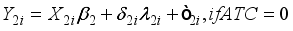
Informal lending networks play a vital role in marginalized communities by providing financial support where formal institutions are limited. These networks enable households to access credit for financing agricultural activities, smoothing consumption, and managing risks. This study examines the effects of informal credit access through lending networks on the consumption expenditure of agropastoral households in rural Kenya. Using a subgraph sampling methodology, 198 network nodes were analyzed, and an endogenous switching regression model was employed to identify key determinants and impacts of informal credit access. The findings reveal that households with higher incomes, greater social group memberships, and stronger network centrality are significantly more likely to access informal credit. Access to informal credit positively influences household consumption expenditure, with high-access households experiencing a 24.61% increase in consumption expenditure. Additionally, low-access households have the potential to increase their consumption expenditure by 31.49% if they achieve higher informal credit access. These results underscore the critical role of informal lending networks in improving economic welfare in marginalized communities. Strengthening informal lending networks through policy interventions such as fostering social capital, promoting social and welfare groups and promoting income diversification can enhance economic development and support sustainable livelihoods among marginalized agropastoral households in rural Kenya.
| Published in | International Journal of Agricultural Economics (Volume 10, Issue 1) |
| DOI | 10.11648/j.ijae.20251001.13 |
| Page(s) | 18-29 |
| Creative Commons |
This is an Open Access article, distributed under the terms of the Creative Commons Attribution 4.0 International License (http://creativecommons.org/licenses/by/4.0/), which permits unrestricted use, distribution and reproduction in any medium or format, provided the original work is properly cited. |
| Copyright |
Copyright © The Author(s), 2025. Published by Science Publishing Group |
Social Network, Informal Credit, Social Capital, Household Welfare, Consumption Expenditure, Kenya
 (3)
(3)  (4)
(4) Variable | Low credit access | High credit access | Aggregate | ||
|---|---|---|---|---|---|
Continuous variables | Mean | Mean | t -value | ||
Age | 44.26 | 45.66 | 44.94 | 0.88 | |
Adult equivalent | 3.4 | 4.1 | 3.7 | 3.17*** | |
Hhsize | 5.61 | 6.68 | 6.14 | 3.06*** | |
Education | 7.6 | 7.9 | 7.7 | 0.40 | |
Income (KSH) | 17,648 | 27,030 | 22,244 | 3.70*** | |
Consumption expenditure (KSH) | 5,713 | 8,524 | 7,090 | 4.98*** | |
Farm size | 2.98 | 4.48 | 3.71 | 3.04*** | |
TLU | 5.00 | 6.80 | 5.88 | 2.69*** | |
Credit given out by lender (KSH) | 5,157 | 13,102 | 9,049 | 4.68*** | |
No. chamas (social groups) | 1.77 | 2.13 | 1.95 | 2.11** | |
Indegree centrality | 1.39 | 1.75 | 1.57 | 3.47*** | |
Outdegree centrality | 1.50 | 2.00 | 1.74 | 4.29*** | |
Categorical variables | Percentage | Aggregate | χ2 Value | ||
Gender | Female | 21.78 | 25.77 | 23.74 | 0.44 |
Male | 78.22 | 74.23 | 76.26 | ||
Marital status | Married | 85.13 | 83.51 | 84.34 | 0.54 |
Single | 5.94 | 7.22 | 6.57 | ||
Divorced | 0.99 | 2.06 | 1.52 | ||
Widowed | 7.92 | 7.22 | 7.58 | ||
Main income source | Business | 25.74 | 31.96 | 28.79 | 0.94 |
Employment | 27.72 | 25.77 | 26.77 | ||
Farming | 46.53 | 42.27 | 44.44 | ||
Variable | Access to informal credit | |
|---|---|---|
Coeff | Std error | |
Number of chamas | 0.2133* | 0.1144 |
Outdegree centrality | 0.7987*** | 0.2248 |
Credit given out | 0.0001*** | 0.0000 |
Wald test | 147.29*** | |
Access to informal credit | Household consumption expenditure | |||||
|---|---|---|---|---|---|---|
High credit access | Low credit access | |||||
Variable | Coef. | Std. Error. | Coef. | Std. Error. | Coef. | Std. Error. |
Age | -0.0106 | 0.0120 | 0.0052 | 0.0041 | 0.0019 | 0.0045 |
Gender | -0.2255 | 0.2710 | -0.0624 | 0.0845 | -0.0819 | 0.1151 |
Educ | -0.0096 | 0.0241 | -0.0024 | 0.0072 | 0.0025 | 0.0093 |
Marital | 0.2208 | 0.1571 | -0.0102 | 0.0448 | -0.1171* | 0.0644 |
Adultequivalent | 0.0071 | 0.0910 | -0.0206 | 0.0285 | 0.0040 | 0.0404 |
Income | 0.5272*** | 0.1907 | 0.4711*** | 0.0587 | 0.6456*** | 0.0755 |
TLU | -0.0000 | 0.0002 | 0.0000 | 0.0000 | -0.0003 | 0.0000 |
Farmsize | 0.1027** | 0.0494 | 0.0076 | 0.0088 | -0.0020 | 0.0245 |
Credit purpose | 0.0187 | 0.1255 | 0.0021 | 0.0423 | 0.0379 | 0.0469 |
Main income source | -0.0340 | 0.1353 | -0.0383 | 0.0427 | 0.0362 | 0.0565 |
Risk attitude | -0.8535** | 0.3903 | -0.0162 | 0.1004 | -0.0828 | 0.1635 |
No. chamas | 0.2133* | 0.1144 | ||||
Outdegree centrality | 0.7987*** | 0.2248 | ||||
Credit given out | 0.0001*** | 0.0000 | ||||
Cons | -5.4899*** | 1.9649 | 4.2656*** | 0.6364 | 2.1464*** | 0.7801 |
/lns0 | -0.8248*** | 0.1101 | ||||
/lns1 | -1.1436*** | 0.0786 | ||||
/r0 | -0.9506** | 0.4096 | ||||
/r1 | -0.3164 | 0.2445 | ||||
sigma0 | 0.4383 | 0.0483 | ||||
sigma1 | 0.3187 | 0.0250 | ||||
rho0 | -0.7401 | 0.1853 | ||||
rho1 | -0.3062 | 0.2215 | ||||
Wald χ2 (11) = 147.29 Log likelihood = -166.38974 Likelihood Ratio of independent. equations χ2 (2) = 5.12, Prob> χ2=0.0773** χ2 Chi square | ||||||
Treatment effects | Decision stage | ||
|---|---|---|---|
High credit access | Low credit access | Average treatment effects (ATE) | |
ATT: (High credit access) | a) 8.9298 (0.0391) | b) 8.6837 (0.0372) | 0.2461*** |
ATU: (Low credit access) | c) 8.7805 (0.0557) | d) 8.4657 (0.0552) | 0.3149*** |
Heterogeneity effects | 0.1493 | 0.218 | -0.0688 |
Treatment-effects estimation | number of observations = 198 | |||||
|---|---|---|---|---|---|---|
Estimator: Propensity-score matching | matches: Requested = 1 | |||||
Treatment model: Logit | ||||||
Outcome Variable | Treatment Effect | Coefficient | Std. Error | z-value | p-value | 95% Confidence Interval |
Log_Consumption Expenditure | ATE | 0.2099*** | 0.0673 | 3.12 | 0.002 | [0.0779, 0.3419] |
Log_Consumption Expenditure | ATET | 0.2303** | 0.0736 | 3.13 | 0.020 | [0.0859, 0.3746] |
ATE | Average Treatment Effects |
ATET | Average Treatment Effect on Treated |
ATU | Average Treatment Effect on Untreated |
ESR | Endogenous Switching Regression |
PSM | Propensity Score Matching |
ROSCAs | Rotating Savings and Credit Associations |
TLU | Tropical Livestock Unit |
| [1] | Adepoju, A. A., & Oni, O. A. (2012). Investigating Endogeneity Effects of Social Capital on Household Welfare in Nigeria: A Control Function Approach. 1. |
| [2] | Agyepong, L., Kuuwill, A., Kimengsi, J. N., Darfor, K. N., Ampomah, S., Evans, K., Gbogbolu, A., Attado, G. N., & Charles, A. K. (2024). Household Consumption Expenditure Determinants Across Poverty Subgroups in Sub-Sahara Africa: Evidence from the Ghanaian Living Standard Survey. Journal of Poverty, 1–26. |
| [3] | Amanullah, Lakhan, G. R., Channa, S. A., Magsi, H., Koondher, M. A., Wang, J., & Channa, N. A. (2020). Credit constraints and rural farmers’ welfare in an agrarian economy. Heliyon, 6(10), e05252. |
| [4] | Baiyegunhi, L. J. S. (2013). Rural households’ social capital and welfare: A case study of Msinga, KwaZulu-Natal, South Africa. |
| [5] | Baiyegunhi, L. J. S., & Fraser, G. C. G. (2014). Smallholder farmers’ access to credit in the Amathole District Municipality, Eastern Cape Province, South Africa. |
| [6] | Barslund, M., & Tarp, F. (2008). Formal and Informal Rural Credit in Four Provinces of Vietnam. The Journal of Development Studies, 44(4), 485–503. |
| [7] | Bocher, T. F., Alemu, B. A., & Kelbore, Z. G. (2017). Does access to credit improve household welfare? Evidence from Ethiopia using endogenous regime switching regression. African Journal of Economic and Management Studies, 8(1), 51–65. |
| [8] | Caudell, M., Rotolo, T., & Grima, M. (2015). Informal lending networks in rural Ethiopia. Social Networks, 40, 34–42. |
| [9] | Conning, J., & Udry, C. (2007). Chapter 56 Rural Financial Markets in Developing Countries. In Handbook of Agricultural Economics (Vol. 3, pp. 2857–2908). Elsevier. |
| [10] | Dang, L. P. X., Hoang, V.-N., Nghiem, S. H., & Wilson, C. (2023). Social networks with organisational resource, generalised trust and informal loans: Evidence from rural Vietnam. Economic Analysis and Policy, 77, 388–402. |
| [11] | Central Bank of Kenya. (2022). FinAccess household survey report: County perspective (November 2022). |
| [12] | Doss, C., Kovarik, C., Peterman, A., Quisumbing, A., & van den Bold, M. (2015). Gender inequalities in ownership and control of land in Africa: Myth and reality. Agricultural Economics, 46(3), 403–434. |
| [13] | Ebbes, P., Huang, Z., & Rangaswamy, A. (2012). Subgraph Sampling Methods for Social Networks: The Good, the Bad, and the Ugly. SSRN Electronic Journal. |
| [14] | Fafchamps, M., & Lund, S. (2003). Risk-sharing networks in rural Philippines. Journal of Development Economics, 71(2), 261–287. |
| [15] | Gebreselassie, S. M., & Ndlovu, P. (2020). Factors Affecting Consumption Expenditure in Ethiopia: The Case of Amhara National Regional State (ANRS). International Journal of Engineering and Management Research, 10(01), 15–20. |
| [16] | Hasebe, T. (2020). Endogenous switching regression model and treatment effects of count-data outcome. The Stata Journal: Promoting Communications on Statistics and Stata, 20(3), 627–646. |
| [17] | Heikkilä, A., Kalmi, P., & Ruuskanen, O.-P. (2016). Social Capital and Access to Credit: Evidence from Uganda. The Journal of Development Studies, 52(9), 1273–1288. |
| [18] | Hoff, K., & Stiglitz, J. E. (1990). Introduction: Imperfect Information and Rural Credit Markets—Puzzles and Policy Perspectives. The World Bank Economic Review, 4(3), 235–250. |
| [19] | Kenya National Bureau of Statistics. (2019). 2019 Kenya population and housing census. Kenya National Bureau of Statistics. |
| [20] | Khaki, A. R., & Sangmi, M. (2016). Financial Inclusion & Social Capital A Case Study of SGSY Beneficiaries in Kashmir Valley. Independent Journal of Management & Production, 7(4), 1005–1033. |
| [21] | Kiplimo, J. C., Ngenoh, E., Koech, W., & Bett, J. K. (2015). Determinants of Access to Credit Financial Services by Smallholder Farmers in Kenya. |
| [22] | Kislat, C. (2015). Why are Informal Loans Still a Big Deal? Evidence from North-east Thailand. The Journal of Development Studies, 51(5), 569–585. |
| [23] | Leskovec, J., & Faloutsos, C. (2006). Sampling from large graphs. Proceedings of the 12th ACM SIGKDD International Conference on Knowledge Discovery and Data Mining, 631–636. |
| [24] | Li, R., Li, Q., Huang, S., & Zhu, X. (2013). The credit rationing of Chinese rural households and its welfare loss: An investigation based on panel data. China Economic Review, 26, 17–27. |
| [25] | Li, W., & Hua, X. (2023). The value of family social capital in informal financial markets: Evidence from China. Pacific-Basin Finance Journal, 77, 101922. |
| [26] | Lin, N., Cook, K. S., & Burt, R. S. (2001). Social Capital: Theory and Research. Transaction Publishers. |
| [27] | Linh, T., Long, H., Chi, L., Tam, L., & Lebailly, P. (2019). Access to Rural Credit Markets in Developing Countries, the Case of Vietnam: A Literature Review. Sustainability, 11(5), 1468. |
| [28] | Lokshin, M., & Sajaia, Z. (2004). Maximum Likelihood Estimation of Endogenous Switching Regression Models. The Stata Journal: Promoting Communications on Statistics and Stata, 4(3), 282–289. |
| [29] | Lokshin, M., & Sajaia, Z. (2011). Impact of Interventions on Discrete Outcomes: Maximum Likelihood Estimation of the Binary Choice Models with Binary Endogenous Regressors. The Stata Journal: Promoting Communications on Statistics and Stata, 11(3), 368–385. |
| [30] | Manja, L. P., & Badjie, I. A. (2022). The Welfare Effects of Formal and Informal Financial Access in the Gambia: A Comparative Assessment. SAGE Open, 12(1), 215824402210811. |
| [31] | Mbugua, M., Nzuma, J., Muange, E., & Kunyanga, C. (2020). Social networks and household food consumption smoothing in the presence of idiosyncratic shocks: Insights from rural Kenya. Development in Practice, 30(3), 383–393. |
| [32] | Mwangi, I., & Ouma, S. (2012). Social capital and access to credit in Kenya. American Journal of Social and Management Sciences, 3(1), 8–16. |
| [33] | Nguyen, G. (2020). Changes in the distribution of household consumption in Southeast Asia. Economic Change and Restructuring, 53(1), 39–60. |
| [34] | Okten, C., & Osili, U. O. (2004). Social Networks and Credit Access in Indonesia. World Development, 32(7), 1225–1246. |
| [35] | Putman, D. S. (2022). Social Network Structure and the Radius of Risk Pooling: Evidence from Community Detection in Colombia and Tanzania. 54. |
| [36] | Salima, W., Manja, L. P., Chiwaula, L. S., & Chirwa, G. C. (2023). The impact of credit access on household food security in Malawi. Journal of Agriculture and Food Research, 11, 100490. |
| [37] | Santos, P., & Barrett, C. B. (2006). Informal Insurance in the Presence of Poverty Traps: Evidence from Southern Ethiopia. SSRN Electronic Journal. |
| [38] | Saqib, S. e, Ahmad, M. M., Panezai, S., & Ali, U. (2016). Factors influencing farmers’ adoption of agricultural credit as a risk management strategy: The case of Pakistan. International Journal of Disaster Risk Reduction, 17, 67–76. |
| [39] | Shoji, M., Aoyagi, K., Kasahara, R., Sawada, Y., & Ueyama, M. (2012). Social Capital Formation and Credit Access: Evidence from Sri Lanka. World Development, 40(12), 2522–2536. |
| [40] | Simpson, B., Harrell, A., Melamed, D., Heiserman, N., & Negraia, D. V. (2018). The Roots of Reciprocity: Gratitude and Reputation in Generalized Exchange Systems. American Sociological Review, 83(1), 88–110. |
| [41] | Sofoluwe, N. A., Ologbonsaye, M. A., Osisanwo, B. G., & Idowu, A. O. (2024). Social Capital, Food Consumption Expenditure and Rural Poverty Reduction in Nigeria. Journal of Agribusiness and Rural Development, 73(3). |
| [42] | Tomy, R. E., & Wittenberg-Moerman, R. (2023). Community Membership and Reciprocity in Lending: Evidence from Informal Markets. |
| [43] | Touray, S., & LeMay-Boucher, P. (2021). Persistence of Links in Risk-Sharing Networks: Evidence From Rural Ethiopia. The Journal of Developing Areas, 55(3), 129–150. |
| [44] | Tran, M. C., Gan, C. E. C., & Hu, B. (2016). Credit constraints and their impact on farm household welfare: Evidence from Vietnam’s North Central Coast region. International Journal of Social Economics, 43(8), 782–803. |
| [45] | Viet Nguyen, C., & van den Berg, M. (2014). Informal Credit, Usury, or Support? A Case Study for V ietnam. The Developing Economies, 52(2), 154–178. |
| [46] |
West Pokot County Government. (2023). County integrated development plan 2023-2027. West Pokot County Government.
https://westpokot.go.ke/userfiles/media/default/cidp-final.pdf |
| [47] | Whitham, M. M. (2021). Generalized Generosity: How the Norm of Generalized Reciprocity Bridges Collective Forms of Social Exchange. American Sociological Review, 86(3), 503–531. |
| [48] | Wilkis, A. (2015). The Moral Performativity of Credit and Debt in the Slums of Buenos Aires. Cultural Studies, 29(5–6), 760–780. |
| [49] | Wossen, T., Di Falco, S., Berger, T., & McClain, W. (2016). You are not alone: Social capital and risk exposure in rural Ethiopia. Food Security, 8(4), 799–813. |
| [50] | Wydick, B., Karp Hayes, H., & Hilliker Kempf, S. (2011). Social Networks, Neighborhood Effects, and Credit Access: Evidence from Rural Guatemala. World Development, 39(6), 974–982. |
| [51] | Yadav, S., Otsuka, K., & David, C. C. (1992). Segmentation in rural financial markets: The case of Nepal. World Development, 20(3), 423–436. |
| [52] | Yuan, Y., & Xu, L. (2015). Are poor able to access the informal credit market? Evidence from rural households in China. China Economic Review, 33, 232–246. |
APA Style
Odari, C. A., Ngigi, M., Muluvi, A. (2025). Access to Informal Lending Networks and Its Impact on Household Consumption Expenditure: A Case of Marginalized Agropastoral Communities in Kenya. International Journal of Agricultural Economics, 10(1), 18-29. https://doi.org/10.11648/j.ijae.20251001.13
ACS Style
Odari, C. A.; Ngigi, M.; Muluvi, A. Access to Informal Lending Networks and Its Impact on Household Consumption Expenditure: A Case of Marginalized Agropastoral Communities in Kenya. Int. J. Agric. Econ. 2025, 10(1), 18-29. doi: 10.11648/j.ijae.20251001.13
AMA Style
Odari CA, Ngigi M, Muluvi A. Access to Informal Lending Networks and Its Impact on Household Consumption Expenditure: A Case of Marginalized Agropastoral Communities in Kenya. Int J Agric Econ. 2025;10(1):18-29. doi: 10.11648/j.ijae.20251001.13
@article{10.11648/j.ijae.20251001.13,
  author = {Calvin Ambolwa Odari and Margaret Ngigi and Augustus Muluvi},
  title = {Access to Informal Lending Networks and Its Impact on Household Consumption Expenditure: A Case of Marginalized Agropastoral Communities in Kenya
},
  journal = {International Journal of Agricultural Economics},
  volume = {10},
  number = {1},
  pages = {18-29},
  doi = {10.11648/j.ijae.20251001.13},
  url = {https://doi.org/10.11648/j.ijae.20251001.13},
  eprint = {https://article.sciencepublishinggroup.com/pdf/10.11648.j.ijae.20251001.13},
  abstract = {Informal lending networks play a vital role in marginalized communities by providing financial support where formal institutions are limited. These networks enable households to access credit for financing agricultural activities, smoothing consumption, and managing risks. This study examines the effects of informal credit access through lending networks on the consumption expenditure of agropastoral households in rural Kenya. Using a subgraph sampling methodology, 198 network nodes were analyzed, and an endogenous switching regression model was employed to identify key determinants and impacts of informal credit access. The findings reveal that households with higher incomes, greater social group memberships, and stronger network centrality are significantly more likely to access informal credit. Access to informal credit positively influences household consumption expenditure, with high-access households experiencing a 24.61% increase in consumption expenditure. Additionally, low-access households have the potential to increase their consumption expenditure by 31.49% if they achieve higher informal credit access. These results underscore the critical role of informal lending networks in improving economic welfare in marginalized communities. Strengthening informal lending networks through policy interventions such as fostering social capital, promoting social and welfare groups and promoting income diversification can enhance economic development and support sustainable livelihoods among marginalized agropastoral households in rural Kenya.
},
 year = {2025}
}
TY  - JOUR
T1  - Access to Informal Lending Networks and Its Impact on Household Consumption Expenditure: A Case of Marginalized Agropastoral Communities in Kenya

AU  - Calvin Ambolwa Odari
AU  - Margaret Ngigi
AU  - Augustus Muluvi
Y1  - 2025/02/17
PY  - 2025
N1  - https://doi.org/10.11648/j.ijae.20251001.13
DO  - 10.11648/j.ijae.20251001.13
T2  - International Journal of Agricultural Economics
JF  - International Journal of Agricultural Economics
JO  - International Journal of Agricultural Economics
SP  - 18
EP  - 29
PB  - Science Publishing Group
SN  - 2575-3843
UR  - https://doi.org/10.11648/j.ijae.20251001.13
AB  - Informal lending networks play a vital role in marginalized communities by providing financial support where formal institutions are limited. These networks enable households to access credit for financing agricultural activities, smoothing consumption, and managing risks. This study examines the effects of informal credit access through lending networks on the consumption expenditure of agropastoral households in rural Kenya. Using a subgraph sampling methodology, 198 network nodes were analyzed, and an endogenous switching regression model was employed to identify key determinants and impacts of informal credit access. The findings reveal that households with higher incomes, greater social group memberships, and stronger network centrality are significantly more likely to access informal credit. Access to informal credit positively influences household consumption expenditure, with high-access households experiencing a 24.61% increase in consumption expenditure. Additionally, low-access households have the potential to increase their consumption expenditure by 31.49% if they achieve higher informal credit access. These results underscore the critical role of informal lending networks in improving economic welfare in marginalized communities. Strengthening informal lending networks through policy interventions such as fostering social capital, promoting social and welfare groups and promoting income diversification can enhance economic development and support sustainable livelihoods among marginalized agropastoral households in rural Kenya.

VL  - 10
IS  - 1
ER  -
Department of Agricultural Economics and Agri-Business Management, Egerton University, Njoro, Kenya
Department of Agricultural Economics and Agri-Business Management, Egerton University, Njoro, Kenya
Department of Economics, Egerton University, Njoro, Kenya
Information