Maize (Zea mays L.) is one of the most principal cereal crops ranking first in production in Ethiopia, predominantly produced and consumed directly by the smallholder farmers in the Great Rift Valley (GRV) of Ethiopia. Common bean (Phaseolus vulgaris) is also the most important legume crops as the source of protein and export commodity in the GRV. However, the average maize and common bean yields in Ethiopia are still low due to abiotic, biotic and socioeconomic constraints. In this regard, Crop simulation models (CSMs) are used in predicting growth and yield of crops and associated yield gaps under various management options and changing climatic parameters that are profitable with minimal unwanted impacts on the environment. Before using the CSMs, it is necessary to specify model parameters and understand the uncertainties associated with simulating variables that are needed for decision-making. Therefore, the research objective of this study was to calibrate and evaluate the performance of the CERES-Maize and CROPGRO-Dry bean CSMs of the Decision Support System for Agrotechnology Transfer (DSSAT) in the GRV of Ethiopia. The generalized likelihood uncertainty estimation (GLUE) method was used to estimate the genetic parameters of the CSM-CERES-Maize and CROPGRO-Dry bean models. Root mean squared error (RMSE) and Index of agreement (I) were used to evaluate the performance of the models. The DSSAT model reasonably reproduced observations for days to anthesis, days to physiological maturity, and grain yields, with values for the index of agreement of 0.97, 0.88 and 0.61 for CERES-Maize and 0.84, 0.75 and 0.51 for CROPGRO-Dry bean. Similarly, root mean square errors were moderate for days to anthesis (1.2 and 1.2 days), maturity (4.1 and 1.6 days), and yield (0.8 and 1.1 t/ha) for CERES-Maize and CROPGRO-Dry bean, respectively. The model has been successfully calibrated and evaluated for maize and common bean crop varieties and can now it can be taken for further applications in evaluating various crop and soil management options including climate smart agriculture technologies and climate change impact studies.
| Published in | International Journal of Applied Agricultural Sciences (Volume 10, Issue 4) |
| DOI | 10.11648/j.ijaas.20241004.11 |
| Page(s) | 149-156 |
| Creative Commons |
This is an Open Access article, distributed under the terms of the Creative Commons Attribution 4.0 International License (http://creativecommons.org/licenses/by/4.0/), which permits unrestricted use, distribution and reproduction in any medium or format, provided the original work is properly cited. |
| Copyright |
Copyright © The Author(s), 2024. Published by Science Publishing Group |
Crop Simulation Model, DSSAT, Model Calibration, Model Evaluation, Maize, Common Bean, Ethiopia
Trait | Definition of trait |
|---|---|
P1 | Degree days (base 8°C) from emergence to end of juvenile phase |
P2 | Photoperiod sensitivity coefficient (0-1.0) |
P5 | Degree days (base 8°C) from silking to physiological maturity |
G2 | Potential kernel number |
G5 | Potential kernel growth rate mg/ (kernel d) |
PHINT | Degree days required for a leaf tip to emerge (phyllochron interval) (°C d) |
Trait | Definition of trait |
|---|---|
CSDL | Critical short-day length below which reproductive development progresses with no daylength effect (for short day plants) (h) |
PPSEN | Slope of the relative response of development to photoperiod with time (positive for short day plants) (1/h) |
EM-FL | Time between plant emergence and flower appearance (R1) (photothermal days) |
FL-SH | Time between first flower and first pod (R3) (photothermal days) |
FL-SD | Time between first flower and first seed (R5) (photothermal days) |
SD-PM | Time between first seed (R5) and physiological maturity (R7) (photothermal days) |
FL-LF | Time between first flower (R1) and end of leaf expansion (photothermal days) |
LFMAX | Maximum leaf photosynthesis rate at 30°C, 350 vpm CO2, and high light (mg CO2/m2-s) |
SLAVR | Specific leaf area of cultivar under standard growth conditions (cm2/g) |
SIZELF | Maximum size of full leaf (three leaflets) (cm2) |
XFRT | Maximum fraction of daily growth that is partitioned to seed + shell |
WTPSD | Maximum weight per seed (g) |
SFDUR | Seed filling duration for pod cohort at standard growth conditions |
SDPDV | Average seed per pod under standard growing conditions (#[seed]/pod) |
PODUR | Time required for cultivar to reach final pod load under optimal conditions (photothermal days) |
THRESH | The maximum ratio of (seed/ (seed + shell)) at maturity causes seed to stop growing as their dry weight increases until shells are filled in a cohort |
SDPRO | Fraction protein in seeds (g[protein]/g[seed]) |
SDLIP | Fraction oil in seeds (g[oil]/g[seed]) |
Maize (MH140) | Common bean (Awash miten) | ||||
|---|---|---|---|---|---|
Parameter | Value | Parameter | Value | Parameter | Value |
P1 | 240.0 | CSDL | 12.17 | SIZELF | 135.0 |
P2 | 0.700 | PPSEN | 0.020 | XFRT | 1.000 |
P5 | 810.0 | EM-FL | 27.0 | WTPSD | 0.230 |
G2 | 750.0 | FL-SH | 3.5 | SFDUR | 15.4 |
G3 | 8.20 | FL-SD | 11.0 | SDPDV | 3.30 |
PHINT | 46.00 | SD-PM | 23.50 | PODUR | 6.0 |
FL-LF | 18.00 | THRSH | 78.0 | ||
LFMAX | 0.99 | SDPRO | .235 | ||
SLAVR | 270. | SDLIP | .030 | ||
Variable name | Maize_ MH 140 | Common bean_ Awash Miten | ||||||||
|---|---|---|---|---|---|---|---|---|---|---|
OBS | SIM | R2 | RMSE | I | OBS | SIM | R2 | RMSE | I | |
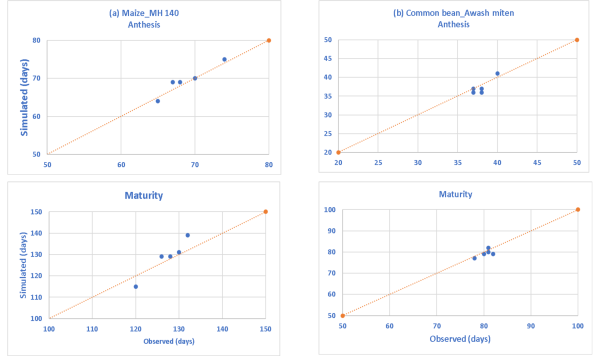
Anthesis (days) | 69 | 69 | 0.92 | 1.2 | 0.97 | 38 | 37 | 0.78 | 1.2 | 0.84 |
Maturity (days) | 127 | 129 | 0.94 | 4.1 | 0.88 | 80 | 79 | 0.74 | 1.6 | 0.75 |
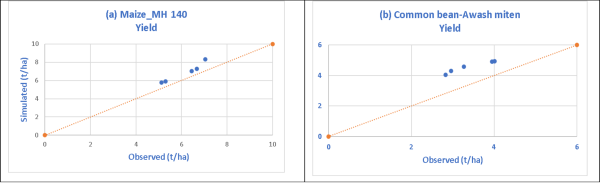
Yield (t/ha) | 6.1 | 6.9 | 0.86 | 0.8 | 0.81 | 3.4 | 4.5 | 0.95 | 1.1 | 0.51 |
CSM | Crop Simulation Model |
CSCP | Climate-Smart Crop Production |
DAP | Diammonium Phosphate |
DSSAT | Decision Support System for Agrotechnology Transfer |
EIAR | Ethiopian Institute of Agricultural Research |
GLUE | The Generalized Likelihood Uncertainty Estimation |
GRV | Great Rift Valley |
NVT | National Variety Trial |
RMSE | Root Mean Squared Error |
| [1] | WMO, Guide to Agricultural Meteorological Practices, no. 134. 2010. |
| [2] | K. Tesfaye et al., “Climate Risk Management Potential bene fi ts of drought and heat tolerance for adapting maize to climate change in tropical environments,” Clim. Risk Manag., vol. 19, no. April 2017, pp. 106–119, 2018, |
| [3] | T. Abate, B. Shiferaw, A. Menkir, D. Wegary, and Y. Kebede, “Factors that transformed maize productivity in Ethiopia,” pp. 965–981, 2015, |
| [4] | S. Bakure, T. Yoseph, and D. Ejigu, “Effect of Interrow Spacings on Growth, Yield, and Yield Components of Common Bean (Phaseolus vulgaris L.) Varieties in the Central Rift Valley of Ethiopia,” vol. 2023, 2023. |
| [5] | N. Hailu, C. Fininsa, and T. Tana, “Effect of climate change resilience strategies on productivity of common bean (Phaseolus vulgaris L.) in Semi-arid areas of eastern Hararghe, Ethiopia,” vol. 10, no. 15, pp. 1852–1862, 2015, |
| [6] | M. S. Teshome, Abebe, Yared D., “Determinants of Productivity and Profitability Performance of Smallholder Common Bean Producers in Central Rift Valley of Etiyopya Merkezi Rift Vadisinde Küçük Ölçekli Fasulye Üreticilerinin Verimlilik ve Karlılık Performansının Belirleyicileri,” vol. 5, no. 1, pp. 27–48, 2021. |
| [7] | M. Getnet, K. Descheemaeker, M. K. van Ittersum, and H. Hengsdijk, “Narrowing crop yield gaps in Ethiopia under current and future climate: A model-based exploration of intensification options and their trade-offs with the water balance,” F. Crop. Res., vol. 278, no. October 2021, p. 108442, 2022, |
| [8] | IPCC, “Future Global Climate: Scenario-based Projections and Near-term Information,” 2021, pp. 553–672. |
| [9] | WMO, State of the Climate in Africa, no. 1275. 2021. |
| [10] | FAO, “Ethiopia Climate-Smart Agriculture Scoping Study,” 2016. |
| [11] | FAO, Climate-smart agriculture Sustainable Development Goals. 2019. |
| [12] | H. C. Jansen et al., “Land and water resources assessment in the Ethiopian Central Rift Valley,” Alterra Wageningen UR, no. July 2007, p. 44, 2007. |
| [13] | D. B. R. and O. E. K. Tesfaye, A. Khatri-Chhetri, P. K. Aggarwal, F. Mequanint, P. B. Shirsath, C. M. Stirling, M. L. Jat, “Assessing climate adaptation options for cereal-based systems in the eastern Indo-Gangetic Plains, South Asia,” J. Agric. Sci., 2019. |
| [14] | J. W. Jones et al., The DSSAT cropping system model, vol. 18, no. 3–4. 2003. |
| [15] | A. Araya, P. V. V Prasad, P. H. Gowda, Z. Zambreski, and I. A. Ciampitti, “Science of the Total Environment Management options for mid-century maize (Zea mays L.) in Ethiopia,” Sci. Total Environ., vol. 758, p. 143635, 2021, |
| [16] | J. M. Yang, J. Y. Yang, S. Liu, and G. Hoogenboom, “An evaluation of the statistical methods for testing the performance of crop models with observed data,” Agric. Syst., vol. 127, pp. 81–89, 2014, |
| [17] | M. Roja, M. K. Gumma, and M. D. Reddy, “Crop modelling in agricultural crops,” Current Science, vol. 124, no. 8. pp. 910–920, 2023, |
| [18] | G. Hoogenboom, J. W. Jones, P. C. S. Traore, and K. J. Boote, “Improving Soil Fertility Recommendations in Africa using the Decision Support System for Agrotechnology Transfer (DSSAT),” in Improving Soil Fertility Recommendations in Africa using the Decision Support System for Agrotechnology Transfer (DSSAT), 2012, pp. 9–18. |
| [19] | P. Rugira, J. Ma, L. Zheng, C. Wu, and E. Liu, “Application of DSSAT CERES-Maize to Identify the Optimum Irrigation Management and Sowing Dates on Improving Maize Yield in Northern China,” 2021. |
| [20] | A. Cravero, S. Pardo, P. Galeas, J. López Fenner, and M. Caniupán, “Data Type and Data Sources for Agricultural Big Data and Machine Learning,” Sustain., vol. 14, no. 23, pp. 1–37, 2022, |
APA Style
Sisay, T., Tesfaye, K., Getnet, M., Dechassa, N., Ketema, M. (2024). Calibration and Evaluation of CERES-Maize and CROPGRO-Dry Bean Crop Simulation Models of the DSSAT in the Great Rift Valley Region of Ethiopia. International Journal of Applied Agricultural Sciences, 10(4), 149-156. https://doi.org/10.11648/j.ijaas.20241004.11
ACS Style
Sisay, T.; Tesfaye, K.; Getnet, M.; Dechassa, N.; Ketema, M. Calibration and Evaluation of CERES-Maize and CROPGRO-Dry Bean Crop Simulation Models of the DSSAT in the Great Rift Valley Region of Ethiopia. Int. J. Appl. Agric. Sci. 2024, 10(4), 149-156. doi: 10.11648/j.ijaas.20241004.11
AMA Style
Sisay T, Tesfaye K, Getnet M, Dechassa N, Ketema M. Calibration and Evaluation of CERES-Maize and CROPGRO-Dry Bean Crop Simulation Models of the DSSAT in the Great Rift Valley Region of Ethiopia. Int J Appl Agric Sci. 2024;10(4):149-156. doi: 10.11648/j.ijaas.20241004.11
@article{10.11648/j.ijaas.20241004.11,
  author = {Theodrose Sisay and Kindie Tesfaye and Mezegebu Getnet and Nigussie Dechassa and Mengistu Ketema},
  title = {Calibration and Evaluation of CERES-Maize and CROPGRO-Dry Bean Crop Simulation Models of the DSSAT in the Great Rift Valley Region of Ethiopia
},
  journal = {International Journal of Applied Agricultural Sciences},
  volume = {10},
  number = {4},
  pages = {149-156},
  doi = {10.11648/j.ijaas.20241004.11},
  url = {https://doi.org/10.11648/j.ijaas.20241004.11},
  eprint = {https://article.sciencepublishinggroup.com/pdf/10.11648.j.ijaas.20241004.11},
  abstract = {Maize (Zea mays L.) is one of the most principal cereal crops ranking first in production in Ethiopia, predominantly produced and consumed directly by the smallholder farmers in the Great Rift Valley (GRV) of Ethiopia. Common bean (Phaseolus vulgaris) is also the most important legume crops as the source of protein and export commodity in the GRV. However, the average maize and common bean yields in Ethiopia are still low due to abiotic, biotic and socioeconomic constraints. In this regard, Crop simulation models (CSMs) are used in predicting growth and yield of crops and associated yield gaps under various management options and changing climatic parameters that are profitable with minimal unwanted impacts on the environment. Before using the CSMs, it is necessary to specify model parameters and understand the uncertainties associated with simulating variables that are needed for decision-making. Therefore, the research objective of this study was to calibrate and evaluate the performance of the CERES-Maize and CROPGRO-Dry bean CSMs of the Decision Support System for Agrotechnology Transfer (DSSAT) in the GRV of Ethiopia. The generalized likelihood uncertainty estimation (GLUE) method was used to estimate the genetic parameters of the CSM-CERES-Maize and CROPGRO-Dry bean models. Root mean squared error (RMSE) and Index of agreement (I) were used to evaluate the performance of the models. The DSSAT model reasonably reproduced observations for days to anthesis, days to physiological maturity, and grain yields, with values for the index of agreement of 0.97, 0.88 and 0.61 for CERES-Maize and 0.84, 0.75 and 0.51 for CROPGRO-Dry bean. Similarly, root mean square errors were moderate for days to anthesis (1.2 and 1.2 days), maturity (4.1 and 1.6 days), and yield (0.8 and 1.1 t/ha) for CERES-Maize and CROPGRO-Dry bean, respectively. The model has been successfully calibrated and evaluated for maize and common bean crop varieties and can now it can be taken for further applications in evaluating various crop and soil management options including climate smart agriculture technologies and climate change impact studies.
},
 year = {2024}
}
TY  - JOUR
T1  - Calibration and Evaluation of CERES-Maize and CROPGRO-Dry Bean Crop Simulation Models of the DSSAT in the Great Rift Valley Region of Ethiopia

AU  - Theodrose Sisay
AU  - Kindie Tesfaye
AU  - Mezegebu Getnet
AU  - Nigussie Dechassa
AU  - Mengistu Ketema
Y1  - 2024/07/15
PY  - 2024
N1  - https://doi.org/10.11648/j.ijaas.20241004.11
DO  - 10.11648/j.ijaas.20241004.11
T2  - International Journal of Applied Agricultural Sciences
JF  - International Journal of Applied Agricultural Sciences
JO  - International Journal of Applied Agricultural Sciences
SP  - 149
EP  - 156
PB  - Science Publishing Group
SN  - 2469-7885
UR  - https://doi.org/10.11648/j.ijaas.20241004.11
AB  - Maize (Zea mays L.) is one of the most principal cereal crops ranking first in production in Ethiopia, predominantly produced and consumed directly by the smallholder farmers in the Great Rift Valley (GRV) of Ethiopia. Common bean (Phaseolus vulgaris) is also the most important legume crops as the source of protein and export commodity in the GRV. However, the average maize and common bean yields in Ethiopia are still low due to abiotic, biotic and socioeconomic constraints. In this regard, Crop simulation models (CSMs) are used in predicting growth and yield of crops and associated yield gaps under various management options and changing climatic parameters that are profitable with minimal unwanted impacts on the environment. Before using the CSMs, it is necessary to specify model parameters and understand the uncertainties associated with simulating variables that are needed for decision-making. Therefore, the research objective of this study was to calibrate and evaluate the performance of the CERES-Maize and CROPGRO-Dry bean CSMs of the Decision Support System for Agrotechnology Transfer (DSSAT) in the GRV of Ethiopia. The generalized likelihood uncertainty estimation (GLUE) method was used to estimate the genetic parameters of the CSM-CERES-Maize and CROPGRO-Dry bean models. Root mean squared error (RMSE) and Index of agreement (I) were used to evaluate the performance of the models. The DSSAT model reasonably reproduced observations for days to anthesis, days to physiological maturity, and grain yields, with values for the index of agreement of 0.97, 0.88 and 0.61 for CERES-Maize and 0.84, 0.75 and 0.51 for CROPGRO-Dry bean. Similarly, root mean square errors were moderate for days to anthesis (1.2 and 1.2 days), maturity (4.1 and 1.6 days), and yield (0.8 and 1.1 t/ha) for CERES-Maize and CROPGRO-Dry bean, respectively. The model has been successfully calibrated and evaluated for maize and common bean crop varieties and can now it can be taken for further applications in evaluating various crop and soil management options including climate smart agriculture technologies and climate change impact studies.

VL  - 10
IS  - 4
ER  -
Africa Centre of Excellence for Climate Smart Agriculture and Biodiversity Conservation, Haramaya University, Dire Dawa, Ethiopia; Ethiopian Institute of Agricultural Research (EIAR), Addis Ababa, Ethiopia
International Maize and Wheat Improvement Centre (CIMMYT), Addis Ababa, Ethiopia
Ethiopian Institute of Agricultural Research (EIAR), Addis Ababa, Ethiopia
School of Plant Science, College of Agriculture and Environmental Sciences, Haramaya University, Dire Dawa, Ethiopia
School of Agriculture and Agribusiness, Haramaya University, Dire Dawa, Ethiopia
Information