2. Cancer Analytics
In the United States, there were approximately 299,010 new cases and 35,250 deaths in 2024
. Several risk factors contribute to the development of prostate cancer. Age is the most significant factor, as the incidence of the disease increases dramatically in men over 50
| [5] | Bray, F., Ferlay, J., Soerjomataram, I., Siegel, R. L., Torre, L. A., & Jemal, A. (2018). Global cancer statistics: GLOBOCAN estimates of incidence and mortality worldwide for 36 cancers in 185 countries. CA: A Cancer Journal for Clinicians, 68, 394–424. https://doi.org/10.3322/caac.21492 |
[5]
. Genetic predisposition also plays an important role. Men with a family history of prostate cancer, particularly those with affected first-degree relatives, have a higher probability of developing the disease. Certain inherited mutations, including those in the BRCA1 and BRCA2 genes, have been associated with increased prostate cancer risk
| [6] | Sandhu, S., Moore, C. M., Chiong, E., Beltran, H., Bristow, R. G., & Williams, S. G. (2021). Prostate cancer. The Lancet, 398, 1075–1090. https://doi.org/10.1016/S0140-6736(21)00950-8 |
[6]
. In addition to genetic factors, lifestyle and environmental influences may contribute to disease development. Diets high in saturated fats, obesity, and limited physical activity have been suggested as possible contributors, although the exact mechanisms remain under investigation
| [7] | Desai, M. M., Cacciamani, G. E., Gill, K., Zhang, J., Liu, L., Abreu, A., & Gill, I. S. (2022). Trends in incidence of metastatic prostate cancer in the US. JAMA Network Open, 5, e222246. https://doi.org/10.1001/jamanetworkopen.2022.2246 |
[7]
. A recent study accurately predicted survival in various cancers, including prostate cancer
| [8] | De Melo, P., DiLella, M., Holman, T., & McElveen, S. (2025). Accurate prediction of survival based on Kaplan–Meier analytics. Cancer Research Journal, 13(4), 173–185.
https://doi.org/10.11648/j.crj.20251304.14 |
[8]
.
Early detection of prostate cancer relies heavily on screening methods that identify abnormal biological markers or structural changes in the prostate. The most used clinical test is the prostate-specific antigen (PSA) blood test, which measures the concentration of PSA produced by prostate cells. Elevated PSA levels may indicate the presence of cancer, although they can also result from benign conditions such as prostatitis or benign prostatic hyperplasia. Digital rectal examination (DRE) is another diagnostic method used to detect irregularities in the prostate gland. If abnormalities are detected, further diagnostic procedures such as prostate biopsy and magnetic resonance imaging (MRI) are typically performed to confirm the presence of cancer and determine its extent.
Once diagnosed, prostate cancer is classified according to tumor stage and grade, which helps guide treatment decisions. Tumor staging describes how far the cancer has spread, while tumor grading evaluates how aggressive the cancer cells appear under a microscope. The Gleason grading system, widely used in clinical practice, assigns scores based on the histological appearance of prostate tumor cells. Higher Gleason scores indicate more aggressive cancers with a greater potential for rapid progression and metastasis. Accurate staging and grading allow clinicians to categorize patients into risk groups and design appropriate treatment strategies.
Treatment options for prostate cancer depend on several factors, including the stage of the disease, tumor aggressiveness, patient age, overall health status, and patient preferences. For patients with low-risk or localized tumors, active surveillance may be recommended. In this approach, cancer is closely monitored through regular PSA testing, imaging studies, and biopsies without immediate intervention. Active surveillance aims to avoid unnecessary treatments and their associated side effects when the cancer is unlikely to progress rapidly.
When intervention is required, several therapeutic strategies are available. Surgery, specifically radical prostatectomy, involves the removal of the prostate gland and surrounding tissues. This approach is commonly used for localized cancer and can be highly effective when the disease has not spread beyond the prostate. Radiation therapy is another widely used treatment and may involve external beam radiation or brachytherapy, where radioactive sources are implanted directly into the prostate. Radiation therapy works by damaging the DNA of cancer cells, thereby preventing their replication and promoting tumor regression
| [5] | Bray, F., Ferlay, J., Soerjomataram, I., Siegel, R. L., Torre, L. A., & Jemal, A. (2018). Global cancer statistics: GLOBOCAN estimates of incidence and mortality worldwide for 36 cancers in 185 countries. CA: A Cancer Journal for Clinicians, 68, 394–424. https://doi.org/10.3322/caac.21492 |
[5]
. Hormone therapy, also known as androgen deprivation therapy (ADT), is frequently used in advanced or metastatic prostate cancer. Prostate cancer cells often rely on male hormones, particularly testosterone, to grow and proliferate. By reducing or blocking androgen levels, ADT can slow tumor growth and alleviate symptoms. However, long-term hormone therapy may lead to treatment resistance, resulting in a more aggressive form known as castration-resistant prostate cancer. In such cases, additional treatment options such as chemotherapy, targeted therapy, or immunotherapy may be considered
| [6] | Sandhu, S., Moore, C. M., Chiong, E., Beltran, H., Bristow, R. G., & Williams, S. G. (2021). Prostate cancer. The Lancet, 398, 1075–1090. https://doi.org/10.1016/S0140-6736(21)00950-8 |
[6]
.
In recent years, advances in molecular biology and medical imaging have significantly improved the understanding of prostate cancer biology. Researchers have identified numerous molecular pathways involved in tumor development, including signaling mechanisms related to androgen receptors, DNA repair processes, and cell cycle regulation
| [5] | Bray, F., Ferlay, J., Soerjomataram, I., Siegel, R. L., Torre, L. A., & Jemal, A. (2018). Global cancer statistics: GLOBOCAN estimates of incidence and mortality worldwide for 36 cancers in 185 countries. CA: A Cancer Journal for Clinicians, 68, 394–424. https://doi.org/10.3322/caac.21492 |
[5]
. These discoveries have led to the development of targeted therapies that aim to disrupt specific biological mechanisms responsible for tumor growth. Precision medicine approaches, which integrate genetic information with clinical data, are increasingly used to personalize treatment strategies for individual patients
| [8] | De Melo, P., DiLella, M., Holman, T., & McElveen, S. (2025). Accurate prediction of survival based on Kaplan–Meier analytics. Cancer Research Journal, 13(4), 173–185.
https://doi.org/10.11648/j.crj.20251304.14 |
[8]
.
Despite substantial progress in diagnosis and treatment, prostate cancer remains a complex disease with significant variability in progression and therapeutic response. Some tumors remain indolent for many years, while others rapidly progress and metastasize. This heterogeneity presents major challenges for clinicians attempting to predict disease trajectories and select optimal treatment strategies. As a result, there is growing interest in computational and clinical models that can capture the dynamic and stochastic nature of cancer progression
| [9] | Fokker, A. D. (1914). The median energy of rotating electrical dipoles in radiation fields. Annalen der Physik, 43(5), 810–820. |
[9]
.
Modern health informatics and computational oncology increasingly employ probabilistic frameworks to analyze disease dynamics. In these approaches, the progression of cancer is viewed as a stochastic process influenced by biological growth mechanisms, environmental factors, and treatment interventions. The proposed model, based on stochastic differential equations and the evolution of probability density, provides tools for describing how tumor states evolve over time across patient populations. Such models offer insights into disease variability, treatment outcomes, and long-term prognosis.
In the case of prostate cancer, stochastic modeling frameworks can represent the evolution of latent disease states, such as tumor burden or PSA dynamics. These models allow researchers to study how deterministic tumor growth interacts with random biological fluctuations, producing the heterogeneous patterns observed in clinical practice. By integrating clinical data with clinical modeling techniques, researchers hope to improve predictive capabilities and support personalized treatment planning.
In summary, prostate cancer is a highly prevalent malignancy with complex biological behavior and diverse clinical outcomes. Advances in screening, diagnostic imaging, molecular biology, and treatment have significantly improved patient survival and quality of life. However, the variability in disease progression and treatment response continues to challenge clinicians and researchers. The integration of clinical knowledge with advanced computational methods offers promising opportunities to better understand the underlying dynamics of prostate cancer and to develop more effective strategies for early detection, treatment optimization, and personalized patient care.
Clinical data demonstrate substantial variability in disease progression, treatment response, and survival outcomes, which cannot be fully captured by deterministic models alone. In this paper, we introduce a new paradigm for prostate cancer progression and treatment based on a probabilistic modeling framework
| [9] | Fokker, A. D. (1914). The median energy of rotating electrical dipoles in radiation fields. Annalen der Physik, 43(5), 810–820. |
[9]
. By incorporating statistical analytics that explicitly account for stochastic variability and data heterogeneity, the proposed approach provides a more realistic representation of cancer dynamics and enables improved analysis of disease progression and treatment effects.
2.1. Prostate Cancer Disease Dynamics: Tumor Growth and Treatment
Previous work in cancer informatics has largely focused on deterministic evaluation and the analysis of nonlinear dynamics
| [10] | Gao, Y., Li, T. J., Li, X. G., & Liu, J. G. (2023). Transition path theory for Langevin dynamics on manifolds: Optimal control and data-driven solver. Multiscale Modeling & Simulation, 21(1), 1–33. https://doi.org/10.1137/21M1437883 |
| [11] | Lowengrub, J. S., Frieboes, H. B., Jin, F., et al. (2010). Nonlinear modeling of cancer: Bridging the gap between cells and tumors. Nonlinearity, 23(1), R1–R9.
https://doi.org/10.1088/0951-7715/23/1/R01 |
[10, 11]
. However, such approaches typically rely on average population behavior and therefore do not adequately represent the heterogeneity observed among individual patients. In this work, we demonstrate that prostate cancer analysis can be substantially improved by incorporating statistical analytics that explicitly account for variability and heterogeneity in clinical data. First, define the latent prostate cancer state x(t) as a stochastic process:
(1)
where:
1) = latent prostate cancer burden (tumor size or PSA-related state)
2) = deterministic drift (tumor growth and treatment effects)
3) = stochastic diffusion (biological variability)
4) = Wiener process representing random fluctuations.
This equation describes how the disease state evolves over time under both deterministic and stochastic influences.
(2)
In (
2),
is the probability density of prostate cancer burden. This equation describes the evolution of the distribution of disease states across a patient population. Tumor progression can be represented by logistic growth:
where: is tumor growth rate and is carrying capacity. This represents biologically limited tumor expansion. Therapy reduces tumor growth:
where: is treatment intensity and is treatment efficacy. Biological variability is modeled as:
where represents stochastic variability due to:
1) mutations
2) patient heterogeneity
3) microenvironment fluctuations.
The initial distribution of tumor burden is:
and assumed Gaussian:
The latent disease state can be linked to patient risk through a hazard model:
where is hazard at time (instantaneous risk of an event such as death, complication, or deterioration), is baseline hazard when , – covariate or predictor (for example, latent health state, PSA level, etc.), is hazard coefficient that determines how changes in modify the risk. When > 0, a higher PSA increases the risk of progression or death; if <0, a higher PSA is associated with lower risk. If = 0, PSA has no effect on risk. In the next sections, we will illustrate a new paradigm on real data.
2.2. Data Description
We analyzed Brazil's nationwide data on prostate cancer (PCa) incidence, mortality, and care, gathered between 2013 and 2021 by the Information Technology Department of SUS (DATA-SUS), and updated monthly using the International Classification of Diseases (ICD-10) codes. PSA values were used as a proxy for latent tumor burden and disease progression. Cancer studies, including mortality, are given in
| [12] | Massuda, A., Hone, T., Leles, F. A. G., de Castro, M. C., & Atun, R. (2018). The Brazilian health system at crossroads: Progress, crisis, and resilience. BMJ Global Health, 3(4), e000829. https://doi.org/10.1136/bmjgh-2018-000829 |
| [13] | Silva, G. A. E., Jardim, B. C., Ferreira, V. M., Junger, W. L., & Girianelli, V. R. (2020). Cancer mortality in the capitals and in the interior of Brazil: A four-decade analysis. Revista de Saúde Pública, 54, 126.
https://doi.org/10.11606/s1518-8787.2020054002255 |
[12, 13]
. We also used data available in Fundación Oncocentro de São Paulo (FOSP). In total, the data set used in this work had 106 patients with prostate cancer with different Gleason scores and an age of>50. We focused on the PSA marker and traced the cancer progression over 6 years.
The evolution of PSA distributions over time was simulated using the Fokker–Planck equation (2), which models the probabilistic dynamics of the disease state under the combined influence of deterministic tumor growth, treatment effects, and stochastic biological variability. Model parameters were selected to produce PSA ranges consistent with typical clinical observations: PSA values below 4 ng/mL are generally considered within normal limits, and elevated PSA levels may indicate disease progression
| [14] | Siegel, R. L., Miller, K. D., Wagle, N. S., & Jemal, A. (2023). Cancer statistics, 2022. CA: A Cancer Journal for Clinicians, 73(1), 17–48. https://doi.org/10.3322/caac.21763 |
[14]
.
3. Results
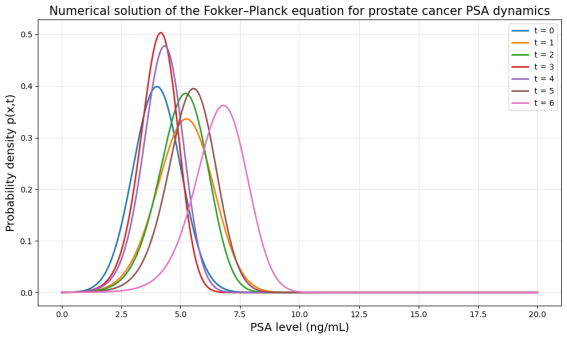
Figure 1 shows the numerical solution of the Fokker–Planck equation describing the temporal evolution of prostate-specific antigen (PSA) levels in a modeled population of prostate cancer patients. The horizontal axis represents the PSA concentration measured in nanograms per milliliter (ng/mL), a widely used clinical biomarker associated with prostate tumor burden. The vertical axis shows the probability density
, which represents the distribution of PSA values across the population at a given time
. Each curve corresponds to a different time point (
), illustrating how the probability distribution of PSA levels evolves over time under the combined effects of tumor growth dynamics, treatment influence, and stochastic biological variability.
At the initial time (), the distribution is centered around PSA values near 4 ng/mL, indicating that most individuals in the modeled population begin with relatively moderate PSA levels that may correspond to early-stage disease or elevated PSA under clinical monitoring. As time progresses, the peak of the distribution gradually shifts toward higher PSA values. This rightward shift in the distribution reflects the deterministic component of the model, represented by the drift term in the Fokker–Planck equation, which captures the biological tendency for tumor burden to increase as prostate cancer progresses. In clinical terms, this shift corresponds to increasing PSA levels associated with tumor growth or worsening disease severity.
In addition to the shift in the mean PSA level, the distributions gradually widen over time. This widening arises from the diffusion term of the Fokker–Planck equation, which represents stochastic fluctuations in the disease dynamics. Biologically, this diffusion reflects heterogeneity among patients due to factors such as genetic variability, differences in tumor aggressiveness, variability in immune response, treatment effectiveness, and noise measurement in PSA testing. As a result, patients who initially have similar PSA levels may experience different disease trajectories over time, leading to a broader distribution of PSA values in the population.
The curves' decreasing height at very high PSA levels does not imply that the probability of cancer decreases as PSA increases. Instead, it reflects the statistical nature of the distribution: extremely high PSA levels occur in fewer patients, so the probability density declines in the right tail. The total area under each curve remains equal to one, indicating that the curves represent normalized probability distributions describing the entire patient population at each time point.
Overall, the figure illustrates how a stochastic modeling framework based on the Fokker–Planck equation can capture both deterministic disease progression and random biological variability in prostate cancer dynamics. By representing PSA levels as a probabilistic distribution rather than a single deterministic trajectory, the model provides a population-level description of disease evolution. Such probabilistic approaches are useful for understanding heterogeneity in cancer progression, evaluating treatment strategies, and developing predictive models that incorporate uncertainty in clinical outcomes.
Figure 1. Numerical solution of the Fokker–Planck equation describing the temporal evolution of prostate-specific antigen (PSA) levels in a modeled population of prostate cancer patients.
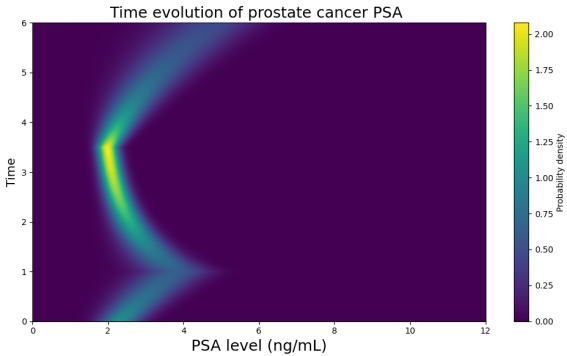
Figure 2. This heatmap illustrates the temporal evolution of the probability density of prostate-specific antigen (PSA) levels in a modeled population of prostate cancer patients. The horizontal axis represents PSA level in nanograms per milliliter (ng/mL), while the vertical axis represents time. The color bar indicates the magnitude of the probability density: darker colors correspond to lower density, whereas brighter yellow-green regions indicate PSA values where the population is most concentrated at a given time.
The figure should be interpreted as a population-level probability map rather than as the trajectory of a single patient. At each point, the horizontal slice across the heatmap corresponds to the probability of distribution of PSA values in the population. Thus, the bright ridge marks the most likely PSA range over time, while the surrounding spread reflects heterogeneity among patients. In other words, the figure shows how the “center of mass” of the PSA distribution moves as the modeled disease state evolves under the combined influence of deterministic tumor progression, treatment response, and stochastic biological variability.
At the initial stage, near time , the highest probability density is concentrated around a PSA value slightly above 2 ng/mL. This indicates that the modeled population begins with relatively low to moderate PSA levels, consistent with an early or monitored phase of prostate cancer. As time increases, the bright ridge shifts to the right toward PSA values near 4 ng/mL. This early rightward motion represents increasing tumor burden or worsening disease activity. In the clinical model, this phase is produced by a positive drift term in the Fokker–Planck equation, which pushes the distribution toward higher PSA values. Clinically, this corresponds to a period of disease progression in which PSA is rising.
A notable feature of the figure appears after approximately , where the ridge bends sharply to the left. Between about and , the most likely PSA level declines from around 4 ng/mL down toward approximately 2 ng/mL. This leftward movement is the signature of treatment response. In the model, it corresponds to a reversal of the drift term, meaning that therapeutic effects dominate tumor growth and drive the disease state toward lower PSA values. In clinical interpretation, this phase can represent successful androgen deprivation therapy or another treatment that suppresses tumor activity and reduces PSA levels. The shape of the bend is important because it visually separates the pre-treatment growth phase from the treatment-induced decline phase.
Around this time , the ridge reaches its lowest PSA level and then bends again, this time back toward the right. From to , the bright ridge steadily moves toward higher PSA values, eventually approaching 5–6 ng/mL. This late rightward shift represents a relapse, renewed tumor progression, or the development of treatment resistance. In prostate cancer, such a pattern is clinically meaningful because an initial PSA decline after therapy is often followed, in some patients, by biochemical recurrence or emergence of castration-resistant disease. Thus, the figure captures three clinically relevant phases in a single probabilistic framework: initial progression, treatment response, and post-treatment relapse.
The thickness of the ridge also provides important information. The ridge is not a thin line but a band of finite width, reflecting stochastic variability in the modeled patient population. This width arises from the diffusion term of the Fokker–Planck equation. Biologically, the diffusion term represents inter-patient heterogeneity, including differences in tumor aggressiveness, genetic instability, microenvironmental influences, variability in treatment response, and measurement uncertainty in PSA. If all patients behaved identically, the ridge would be much narrower. Instead, its width indicates that even when the population has a common overall trend, individual PSA trajectories differ, producing a spread of probable PSA values at each time point.
The brighter portions of the ridge indicate times and PSA values where the distribution is more concentrated. For example, the strong bright region around the turning point near suggests that many modeled trajectories accumulate near that lower PSA range before the relapse phase begins. This can be interpreted as a transient stabilization zone under therapy, where treatment brings many patients into a similar PSA range before variability and renewed progression begin to disperse the distribution again. The gradual fading of intensity away from the ridge shows that PSA values far from the main trend are less likely but still possible within the stochastic model.
It is important to note that the color intensity does not represent the probability of cancer itself. The figure assumes a population already under a prostate cancer modeling framework. The heatmap instead shows the probability density of PSA levels within that population. Therefore, lower intensity at very high or very low PSA values does not mean cancer is absent; it means fewer modeled patients are expected to occupy those PSA ranges at that specific time. The total probability across all PSA values at a given time remains normalized.
From a methodological perspective, the figure demonstrates the advantage of the Fokker–Planck approach over a purely deterministic model. A deterministic model would yield a single PSA trajectory, which may be too simplistic for real oncology populations. By contrast, the Fokker–Planck framework evolves an entire probability distribution, allowing one to capture uncertainty, variability, and phase transitions induced by treatment. This is especially relevant in prostate cancer, where patients with similar initial PSA values may experience very different clinical outcomes depending on tumor biology and therapeutic sensitivity.
Overall, the figure provides a compact visual summary of prostate cancer dynamics under therapy. The initial rightward movement indicates disease progression and rising PSA. The middle leftward bend indicates therapeutic suppression of PSA. The later rightward movement indicates relapses or renewed disease advancement. The width of the ridge reflects patient heterogeneity and stochastic biological variability. Thus, the figure can be interpreted as a probabilistic map of how PSA-linked prostate cancer burden evolves over time in a heterogeneous population, offering a clinically meaningful representation of progression, treatment response, and recurrence within a unified stochastic framework.
Figure 2. Time evolution of prostate cancer PSA distribution modeled by the Fokker–Planck equation.
The figure illustrates three characteristic phases of prostate cancer dynamics: an initial rise in PSA associated with tumor progression, a decline in PSA following the initiation of therapy, and a subsequent increase reflecting relapse or treatment resistance (androgen deprivation therapy, ADT).
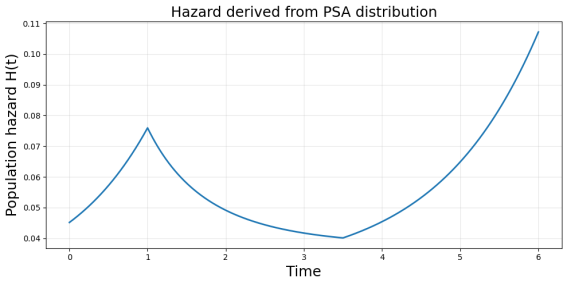
It shows the temporal evolution of the mean prostate-specific antigen (PSA) level derived from the stochastic model of prostate cancer dynamics. PSA values initially increase, reflecting tumor progression before treatment. Around , the trajectory reverses, indicating the initiation of therapy and a reduction in tumor activity, leading to declining PSA levels. The minimum PSA occurs around , representing the strongest treatment response. After this point, PSA levels rise again, suggesting disease relapse or the emergence of treatment-resistant tumor cells. Because the clinical hazard is modeled as an exponential function of the latent disease state, the hazard follows the same qualitative pattern as the PSA trajectory. Hazard increases during the initial progression phase, decreases during treatment when PSA declines, and rises again during relapse as PSA levels increase. Thus, the PSA trajectory serves as a proxy for the latent tumor burden, linking the stochastic disease model to the time-dependent risk of adverse clinical outcomes, such as progression or metastasis.
Figure 3. Mean PSA trajectory and corresponding hazard dynamics in prostate cancer progression. This chart shows the hazard reflects all patients simultaneously.
3.1. Reconstruction of a Latent State
Let
1) = latent tumor burden or hidden disease severity
2) = observed PSA data
Then we assume PSA is a noisy measurement of the hidden state, for example:
PSA is not the latent state itself. It is an observable signal generated by the latent state. The latent disease state cannot be observed directly in prostate cancer patients, but it can be estimated from longitudinal PSA measurements by treating PSA as a noisy observation of the underlying tumor burden. In this framework, a stochastic state equation describes the hidden evolution of disease severity, while an observation equation links the latent state to measured PSA values. The chain becomes:
Stochastic Artificial Intelligence Hazard Analysis (SAIHA), developed under the Allied Health Program of Norfolk State University
, can serve as a framework for reconstructing a hidden tumor-burden state from observed PSA measurements and then linking that latent state to hazard. How does SAIHA fit prostate cancer? In this setting, observed data represent PSA measurements over time, the latent state is the hidden prostate cancer burden, aggressiveness, or progression state, SAIHA is the stochastic framework that infers the hidden state from noisy observations and links it to risk.
So instead of treating PSA as the disease itself, SAIHA treats PSA as a noisy manifestation of an underlying biological process.
In the present study, SAIHA provides a natural framework for modeling prostate cancer progression as a latent stochastic process observed indirectly through PSA measurements. The hidden state represents the underlying burden of tumor or disease severity, while the observed PSA values are treated as noisy manifestations of that latent process. This formulation allows reconstruction of the disease trajectory from longitudinal PSA data and supports estimation of time-dependent hazard as a function of the inferred latent state. In this way, SAIHA integrates stochastic disease dynamics, biomarker observations, and clinical risk into a unified probabilistic framework. SAIHA is especially helpful because prostate cancer is:
1) slow and heterogeneous
2) noisy in its observed biomarkers
3) affected by treatment response and relapses
4) not fully captured by PSA alone
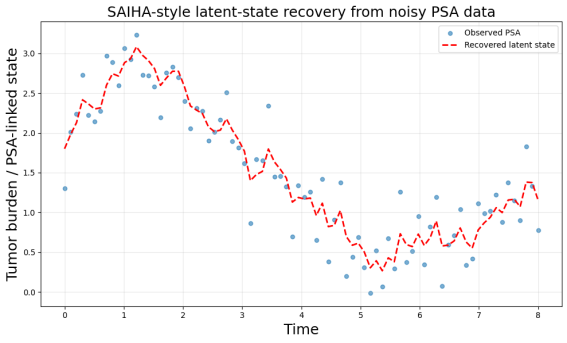
Figure 4 illustrates the recovery of the hidden tumor-burden trajectory using a stochastic latent-state model. The blue solid curve represents the true latent disease state governing prostate cancer dynamics, while the scattered points correspond to observed prostate-specific antigen (PSA) measurements, which are affected by observational noise and biological variability. The dashed orange curve shows the latent state estimated from the PSA data using a SAIHA-style filtering approach. Despite the noise in the observed biomarker, the reconstructed trajectory closely follows the underlying disease dynamics, capturing key phases of prostate cancer evolution, including initial progression, treatment-induced decline, and subsequent relapse. This example demonstrates how SAIHA can infer hidden disease processes from clinical biomarker data and provide a probabilistic representation of tumor burden over time.
Figure 4. SAIHA-based reconstruction of the latent prostate cancer state from noisy PSA observations, a representative latent disease trajectory consistent with the observed PSA data.
Tumor burden represents the amount of cancer present in the body.
In our model, it is the latent state . Examples of tumor burden indicators:
1) tumor size
2) number of cancer cells
3) tumor volume
4) PSA-linked disease severity.
The red dashed line represents the latent tumor burden trajectory. So tumor burden describes how severe the disease is.
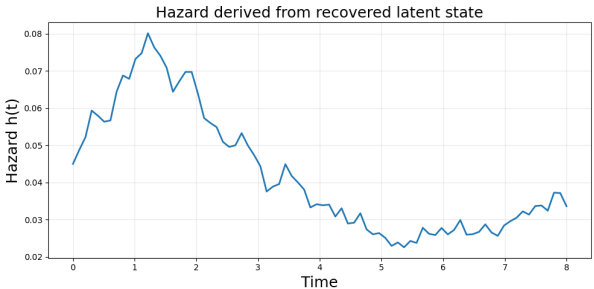
Figure 5 shows the time-dependent hazard
computed from the recovered latent tumor-burden trajectory inferred from noisy PSA observations. Hazard represents the instantaneous risk of an adverse clinical event, such as disease progression or relapse, and is modeled as an exponential function of the latent disease state
. The hazard initially increases as tumor burden rises during the early progression phase, reaching a maximum near
. As treatment reduces the underlying tumor burden, the hazard declines and reaches its minimum around
. A gradual increase in hazard toward the end of the time interval reflects relapses or renewed tumor growth after the treatment response. This curve, therefore, translates the reconstructed latent disease dynamics into a clinically interpretable risk trajectory over time.
Figure 5. Hazard function derived from the reconstructed latent prostate cancer state.
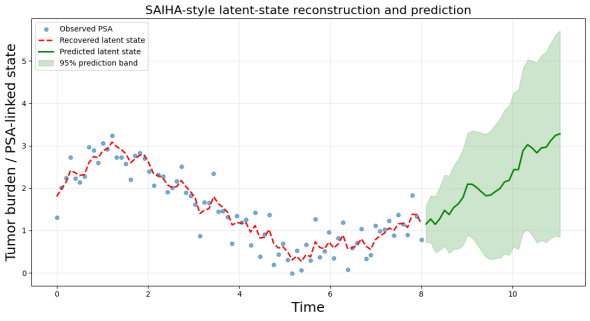
Figure 6 shows the SAIHA-style latent-state reconstruction and prediction of prostate cancer progression from PSA data. Blue points represent observed prostate-specific antigen (PSA) measurements affected by noise and biological variability. The red dashed curve shows the reconstructed latent tumor-burden state inferred from the PSA observations using the SAIHA-based filtering approach. Starting from the final reconstructed state, the model propagates the latent dynamics forward to generate a prediction of future tumor burden, shown by the green curve. The shaded region represents the 95% prediction interval, illustrating the uncertainty associated with future disease evolution. The increasing predicted trajectory suggests potential disease progression or relapses after the observation period. This example demonstrates how SAIHA can use reconstructed latent states derived from clinical biomarkers to forecast future disease dynamics and support risk-based prediction in prostate cancer.
Figure 6. SAIHA-style latent-state reconstruction and prediction of prostate cancer progression from PSA data.
In the figure, the observed PSA points remain within relatively moderate ranges, yet the reconstructed latent state reveals an underlying tumor-burden trajectory. This reflects the fact that PSA is only an indirect indicator of the disease process. The latent-state reconstruction, therefore, captures the hidden biological dynamics that may not be directly visible from the biomarker alone. Tumor burden may exist even when PSA levels remain within clinically normal ranges because PSA is an indirect biomarker rather than a direct measure of tumor size. The latent-state reconstruction captures the underlying disease dynamics that generate the observed PSA measurements, thereby enabling inference of hidden tumor progression from noisy biomarker data.
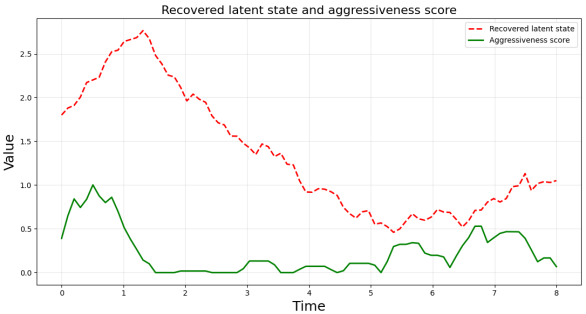
3.2. Cancer Aggressiveness
It defines aggressiveness as the positive part of the slope:
So:
1) The negative slope shows treatment response
2) A zero slope manifests stable disease
3) A positive slope indicates progression
4) A large positive slope shows a more aggressive progression
Figure 7. Recovered latent tumor-burden trajectory and model-based aggressiveness score derived from PSA observations.
Figure 7 shows the recovered latent tumor-burden trajectory and model-based aggressiveness score derived from PSA observations. The red dashed curve represents the reconstructed latent disease state inferred from noisy PSA measurements using a SAIHA-style latent-state filtering approach. The green curve shows the aggressiveness score computed from the positive slope of the latent-state trajectory, reflecting the rate of tumor progression over time. Higher values of the aggressiveness score correspond to periods of rapid tumor growth, whereas values near zero indicate stable disease or treatment response. The figure illustrates how the latent-state dynamics derived from PSA data can be transformed into a quantitative indicator of disease progression and potential aggressiveness in prostate cancer.
4. Discussion
This study presents a stochastic modeling framework for prostate cancer progression based on the Fokker–Planck equation within the broader Stochastic Artificial Intelligence Hazard Analysis (SAIHA) framework, with prostate-specific antigen (PSA) levels used as a proxy for the underlying disease state. Unlike deterministic models that describe a single tumor trajectory, the proposed approach characterizes the evolution of the probability distribution of PSA values across a population of patients. Within SAIHA, PSA measurements are interpreted as observable manifestations of an underlying latent disease state representing tumor burden. This probabilistic perspective allows the model to capture both the systematic dynamics of tumor growth and the variability observed in clinical populations while simultaneously linking latent disease dynamics to hazard estimation.
The simulation results demonstrate several clinically meaningful patterns in PSA dynamics. At early stages, PSA levels tend to rise, reflecting tumor growth and increasing disease burden in the absence of effective treatment. This phase corresponds to the natural progression of prostate cancer, during which tumor cells proliferate, and PSA levels gradually rise. In the model, this behavior is produced by the drift component of the Fokker–Planck equation, which represents deterministic biological processes such as tumor proliferation and androgen-driven growth. In the SAIHA framework, this drift component describes the deterministic evolution of the latent tumor state that generates PSA observations.
A key feature of the results is the subsequent reversal in the distribution, with PSA values decreasing during the treatment phase. This behavior corresponds to therapeutic intervention, such as androgen deprivation therapy, which suppresses tumor activity and reduces PSA levels. The model captures this effect by changing the drift term, which temporarily drives the disease state toward lower PSA values. Within SAIHA, this transition can be interpreted as a modification of the latent-state dynamics due to treatment input, illustrating how therapeutic effects can be incorporated into the stochastic disease evolution model.
Following the treatment phase, the model exhibits a renewed increase in PSA levels, representing relapses or the emergence of treatment-resistant disease. Clinically, this phenomenon is frequently observed in prostate cancer patients, particularly in cases where tumors evolve toward castration-resistant prostate cancer. The simulated relapse phase demonstrates the stochastic framework's ability to capture long-term disease dynamics, including the transition from treatment response to disease recurrence. In the SAIHA context, this relapse corresponds to a renewed increase in the latent tumor-burden state, which subsequently leads to an increase in the hazard of adverse clinical outcomes.
An important aspect of the model is the widening of the probability distribution over time. This spreading effect arises from the diffusion term of the Fokker–Planck equation and reflects the increasing heterogeneity among patients. In clinical settings, individuals with similar initial PSA levels may experience very different disease trajectories due to genetic variability, tumor aggressiveness, immune system interactions, and differences in treatment response. The diffusion component, therefore, provides a mathematical representation of this biological variability, enabling the model to capture the diversity of outcomes observed in real patient populations. Within the SAIHA framework, this variability directly influences the distribution of latent disease states and, in turn, affects the population-level hazard dynamics.
From a methodological perspective, the combined Fokker–Planck–SAIHA framework offers several advantages for modeling cancer dynamics. First, it allows researchers to analyze disease progression at the population level rather than focusing solely on individual patient trajectories. Second, it naturally incorporates stochastic variability, which is an inherent feature of biological systems. Third, the probabilistic formulation enables integration with clinical biomarkers such as PSA levels while allowing the latent tumor state to be reconstructed from noisy observations and linked directly to hazard estimation.
The modeling framework also highlights the broader connection between biological systems and physical processes. The mathematical structure of the Fokker–Planck equation originates in statistical physics and diffusion theory, where it describes the evolution of probability distributions in systems subject to both deterministic forces and random fluctuations. Similar mathematical structures arise in the Schrödinger equation of quantum mechanics, emphasizing deep conceptual parallels between probabilistic dynamics in physical systems and stochastic processes in biological systems. In the context of healthcare analytics, SAIHA leverages these stochastic principles to reconstruct latent disease states from observed clinical data and translate them into risk measures such as hazard functions.
Despite its conceptual strengths, the model presented here remains a simplified representation of prostate cancer progression. Real clinical systems involve additional factors such as spatial tumor growth, metastatic spread, immune interactions, and complex treatment protocols. Furthermore, PSA levels may not perfectly reflect tumor burden in all patients, particularly in advanced disease stages. Future work could extend the current framework by incorporating spatial dynamics, multi-scale biological mechanisms, and patient-specific data derived from electronic health records or clinical trials. Within the SAIHA paradigm, such extensions would enable more accurate reconstruction of latent disease trajectories and improved estimation of individualized risk profiles.
In summary, the combined Fokker–Planck and SAIHA framework provides a flexible and interpretable approach for modeling prostate cancer dynamics using PSA as a clinically meaningful biomarker. By representing disease progression as the evolution of a probability distribution rather than a single deterministic trajectory, the model captures key features of prostate cancer behavior, including tumor growth, treatment response, relapses, and patient heterogeneity. The SAIHA perspective further enables reconstruction of the latent disease state and derivation of clinically interpretable hazard functions from observed biomarker data. Such probabilistic models may contribute to improved understanding of disease progression and support the development of predictive tools for personalized oncology and health informatics applications.
5. Conclusion
Recent advances in cancer informatics have substantially expanded the ability to characterize tumor progression through computational, evolutionary, and single-cell approaches
. This work demonstrated that cancer progression can be understood through the framework of adaptive cellular fitness and evolutionary dynamics, underscoring the need for informatics models that account for tumor plasticity and selective pressure. Agarwal and Owzar further showed that next-generation distributed computing provides the computational foundation necessary for handling large, heterogeneous cancer datasets, thereby enabling scalable analysis and translational discovery
| [16] | Agarwal, P., & Owzar, K. (2015). Next generation distributed computing for cancer research. Cancer Informatics, 13(Suppl 7), 97–109. https://doi.org/10.4137/CIN.S16344 |
[16]
. More recently, Chen et al. applied single-cell analysis to identify anti-apoptotic subpopulations linked to malignant progression and prognosis in bladder cancer, illustrating how high-resolution informatics can uncover clinically meaningful cellular heterogeneity that is not visible in aggregate-level data
| [17] | Chen, L., Hao, Y., Zhai, T., Yang, F., Chen, S., Lin, X., & Li, J. (2025). Single-cell analysis highlights anti-apoptotic subpopulation promoting malignant progression and predicting prognosis in bladder cancer. Cancer Informatics, 24, 11769351251323569. https://doi.org/10.1177/11769351251323569 |
[17]
. Collectively, these studies indicate that contemporary cancer informatics is advancing toward integrative frameworks that combine biological complexity, computational scalability, and cellular-level precision to improve prediction, prognosis, and personalized intervention.
This study introduces a novel stochastic modeling framework for prostate cancer progression based on the Fokker–Planck equation within the broader framework of Stochastic Artificial Intelligence Hazard Analysis (SAIHA), using prostate-specific antigen (PSA) levels as a proxy for the underlying disease state. By describing the temporal evolution of the probability density of PSA values, the model provides a population-level representation of prostate cancer dynamics that incorporates both deterministic biological processes and stochastic variability among patients. Within the SAIHA framework, PSA measurements are interpreted as observable manifestations of a latent tumor-burden state that evolves stochastically over time. This probabilistic approach allows the analysis of disease progression beyond a single deterministic trajectory and captures the heterogeneity commonly observed in clinical oncology while linking latent disease dynamics to hazard estimation.
The numerical simulations demonstrate several clinically relevant phases of prostate cancer dynamics. The initial increase in PSA reflects tumor growth and disease progression in the absence of treatment. The subsequent decline in PSA represents the therapeutic effect of treatment interventions such as androgen deprivation therapy. Finally, the renewed rise in PSA levels illustrates relapse or the development of treatment resistance, a phenomenon frequently observed in advanced prostate cancer. The widening of the probability distribution over time further reflects biological variability among patients, including differences in tumor aggressiveness, treatment response, and other patient-specific factors. Within the SAIHA perspective, these stochastic variations correspond to differences in latent disease trajectories that ultimately influence patient-specific hazard profiles.
The Fokker–Planck framework provides an effective clinical tool for studying such complex disease dynamics. By modeling the evolution of the entire distribution of disease states, the approach captures uncertainty and heterogeneity that are difficult to represent in deterministic models. This probabilistic formulation also facilitates the integration of clinical biomarkers, such as PSA measurements, with clinical descriptions of tumor growth and treatment effects. In the SAIHA context, the reconstructed latent state derived from PSA observations can be used to estimate time-dependent hazard functions, linking biomarker dynamics directly to clinical risk.
More broadly, this work highlights the value of interdisciplinary approaches that bridge clinical physics and healthcare analytics. The mathematical structure of the Fokker–Planck equation, which has its origins in statistical physics and diffusion theory, proves useful for describing stochastic processes in biological systems. Similar mathematical structures appear in other areas of physics, emphasizing the deep conceptual parallels between probabilistic dynamics in physical systems and stochastic processes in biological systems. In healthcare analytics, SAIHA leverages these stochastic principles to infer hidden disease states from clinical observations and translate them into clinically interpretable measures such as hazard and risk.
Although the present model is intentionally simplified, it provides a conceptual foundation for future research. Extensions of this framework could incorporate patient-specific data, spatial tumor growth, metastatic processes, and adaptive treatment strategies. Integrating stochastic disease models with clinical data from electronic health records and imaging studies may ultimately support more accurate prediction of disease trajectories and more personalized treatment planning. Within the SAIHA paradigm, such developments could enable improved reconstruction of latent disease states and more precise estimation of individualized hazard profiles.
In conclusion, modeling prostate cancer dynamics through the Fokker–Planck equation within the SAIHA framework offers a very promising probabilistic approach for understanding tumor progression, treatment response, and relapse. By capturing both deterministic biological mechanisms and stochastic variability, this approach contributes to the growing field of computational oncology and may help inform future data-driven strategies for prostate cancer management.