Research Article | | Peer-Reviewed

Performance Evaluation of Linseed (Linum usitatissimum L.) Varieties in Buno Bedele Zone, South Western Oromia

Received: 20 April 2024     Accepted: 15 May 2024     Published: 20 September 2024
Views:       Downloads:
Abstract

Linseed (Linum usitatissimum L.) is one of the most important oil crops of Ethiopia and it is considered as the main food crop and the least expensive source of oil for the farmers in many highlands of the country. Even though numerous improved linseed varieties have been released in Ethiopia, the mean seed yield per unit area of the crop remains low due to poor access to improved varieties. To improve the crop’s production and productivity, testing the performance of improved linseed varieties in potential agro ecologies where the varieties have never been grown before is an essential activity. A study was carried out with the objective of testing the performance of improved linseed varieties and their genetic variability for seed yield and related traits in Bedele, Dabo Hana and Didesa districts of Buno Bedele zone, south western Oromia, Ethiopia. This experiment was carried out using twelve linseed varieties were used for investigation (Bekoji-14, Kassa-2, Welen, Bekoji, Kuma, Yadano, Furtu, Bakalcha, Dibane, Horesoba & Jitu) and one local check were sown in randomized complete block design with three replications during the 2022/2023 and 2023/2024 main cropping seasons. Six (6) quantitative morphological traits were collected and analyzed by using R-software accordingly. Combined analysis of data from the three locations revealed that there is significant difference among varieties for days to flowering, days to maturity and grain yield, but non-significant for plant height (cm), number of primary branches per plant and number of capsules per plant. Significant effect of location was observed in plant height, number of primary branch per plant, number of capsule per plant and grain yield however non-significant in days to flowering and days to maturity. The interaction of Variety X location was significant for days to flowering, days to maturity, plant height and grain yield, however non-significant for number of primary branch per plant and number of capsule per plant. The maximum seed yield was recorded in varieties Kuma (1588.9 kgha-1) followed by Beokoji-14 (1476.7 kgha-1) and the lowest yield (978.9 kg/ha-1) was obtained from local check. The combine AMMI analysis for seed yield across environments revealed significantly affected by environments that hold 26.6% of the total variation. The genotype and genotype by environmental interaction were significant and accounted for 12.40% and 19.42% respectively. Principal component 1 and 2 accounted for 10.78 % and 6.13% of the GEI respectively with a total of 16.91% variation. In general, Kuma and Bekoji-14 varieties were identified as the best varieties for yielding ability, stability and recommended in the area and with similar agro-ecologies.

Published in Bioprocess Engineering (Volume 8, Issue 2)
DOI 10.11648/j.be.20240802.11
Page(s) 24-35
Creative Commons

This is an Open Access article, distributed under the terms of the Creative Commons Attribution 4.0 International License (http://creativecommons.org/licenses/by/4.0/), which permits unrestricted use, distribution and reproduction in any medium or format, provided the original work is properly cited.

Copyright

Copyright © The Author(s), 2024. Published by Science Publishing Group

Keywords

Evaluation, Linseed, Varieties, Interactions and Significant

1. Introductions
Oil crops occupy third position following cereal and pulse crops in the agricultural economy of Ethiopia. Among oil crops linseed (Linum usitatissimum L.) is one of the ancient oilseeds cultivated for oil, food and fiber . Linseed (Linum usitatissimum L.) is an annual field crop that belongs to the family Linaceae. The haploid chromosome number of Linseed is 15 (n =15), and the diploid chromosome number is 30 (2n =30). It is an important oil crop cultivated worldwide for oil and fiber. Ethiopia’s oilseed crop, which is quickly expanding to fulfill both domestic and international demand, is critical to the country’s foreign exchange revenues and income. Oilseed exports account for about 11.5% of Ethiopia’s total export profits. Oilseeds supplied 5.90% (766,167.66 ha) of grain crop area and 2.27% (7,774,444.17 quintals) of grain production to Ethiopia’s national grain total . Niger seed, sesame, and linseed accounted for 1.48% (19.766.00 ha), 2.85% (369,897.32 ha), and 0.61% (78,921.37 ha), respectively, of the grain crop area. These crops account for 0.63%, 0.76%, and 0.24% of grain crop production, respectively. Five countries (Canada, China, Russia, India, and USA) provide 72.50% of global linseed production. The European top producer is the Russian Federation (13.86%) . The crop is largely grown in temperate climates and cool tropics, including the highlands (>2500 m above sea level) of Ethiopia. It thrives best at altitudes of 2200–2800 m above sea level in Ethiopia, but it can also be grown at 1200 m and 3420 m above sea level . Linseed grows in cold weather ranging from 10–30°C, but it produces the best harvests when temperatures are between 21–22°C during the growth period. In fact, linseed is the second biggest oil plant in terms of acreage cultivated and yield in the highland areas of Ethiopia, after Niger seed . In Ethiopia, linseed supplies 10.3% (78,921.37 ha) of the oilseed crop area and 10.35% (80,456.64 tons) of the production of the national oilseed total . Despite its diverse uses for the local oil sector and foreign currency earnings, linseed productivity in Ethiopia is characterized by low yield, with an average yield of 10.2 qt ha-1 , compared to more than 1.5 t/ha in developed countries . In Oromia region linseed covered 27,661.60 hectares of cultivated land and has a production of about 310,824.57 quintals with average yield of 11.24 qt ha-1 . This indicates in the Oromia region linseed production potential is better. Even though there is no production status of the study area for this crop appropriate improved variety is crucial in order to increase the production. Some attempts have been done to improve the limitation of ideal linseed varieties for the area of Buno Bedele zone by Jimma Agricultural Research Center (JARC).
However, that is not enough and satisfying the farmers demand regarding the option and accessibility of improved varieties. Hence, this study was conceived to evaluate the newly released linseed varieties to the agro-ecology of the Buno Bedele zones of south western Oromia region, Ethiopia and identify the most high yielders and stable varieties for the farmers. One of the major production barriers affecting linseed productivity is a lack of access to improved varieties, which is why the majority (>90%) of Ethiopian farmers use unimproved seeds . On the contrary, the Ethiopian Institute of Agricultural Research has released more than 19 improved linseed varieties that, if properly assessed and produced by farmers, have the potential to increase crop output. Every crop improvement effort begins with a breeder looking into the existence of genetic variability for the desired traits . According to Adugna , Ethiopia is believed to be the secondary place of variation, and it is the world’s fifth largest linseed producer. Ethiopia’s diverse agro climatic conditions may have led to the country’s linseed crop diversification. However, having variance in a population is not enough to improve desired qualities and little or no research on the genetic variability of released linseed varieties has been conducted. As a result, breeders must evaluate the degree and distribution of genetic diversity in the genetic materials that are readily available.
The crop genotypes grown in different environments would frequently encounter significant fluctuations in yield performance, particularly when the growing environments are distinctly different, the test genotypes differentially respond to changes in the growing environments or both. AMMI is a multivariate tool, which was highly effective for the analysis of multi environment trials and in the recent years, this method has often been used by international agricultural development agencies . The most recent method, the GGE (genotype main effect (G) plus G x E interaction) biplot model, provides breeders a more complete and visual evaluation of all aspects of the data by creating a biplot that simultaneously represents mean performance and stability, as well as identifying mega-environments (Ding et al., 2007; Yan and Kang, 2003).
In this study, we attempted to apply AMMI and sites regression GGE biplot statistical model for determination of the magnitude and pattern of G × E interaction effects and performance stability of seed yield of 12 linseed genotypes.
2. Materials and Methods
2.1. Description of the Study Areas
The field experiment was conducted during the 2022 – 2023 G.C main cropping seasons for two years at three districts of Buno Bedele Zone, South Western Oromia where agro ecology assumed to be conducive for Linseed production. The locations were Bedele, Dabo Hana and Didesa districts. The detailed agro-ecological conditions of the locations are presented below (Table 1).
2.2. Experimental Materials
Twelve linseed varieties from the Holetta, Kulumsa and Sinana Agricultural Research Centers, as well as one local check from farmers, were collected and evaluated for performance and variability over seasons (Table 2).
Table 1. Agro-ecological features of the experimental Locations.

Locations

Altitude (m.a.s.l)

R/fall (mm)

Soil Type

Geographical Coordinates

Ave. Tem. (°C)

Latitude N

Longitude E

Max.

Min.

Bedele

1300-2200

1200-1800

Nitosols

8°28'60.00"

36°20'60.00"

28.5

12.5

Dabo Hana

1791-1990

1300-1945

Nitosols

8°55ʹ60 20”

36°26ʹ 19.00”

25.8

12.9

Didessa

1945-2340

1250-2000

Nitosols

8°04'60.00"

36°39'59.99"

28

13

Source: Different literatures
Table 2. Description of Linseed Varieties used in this Study.

Varieties

Year of release

Releasing center/Maintainer

Seed Color

Bekoji-14

2014

HARC (EIAR)

Brown

Kassa-2

2012

HARC (EIAR)

Yellow

Welen

2019

KARC (EIAR)

Brown

Bekoji

-

SARC (EIAR)

Brown

Kuma

2016

KARC (EIAR)

Brown

Yadano

2015

KARC (EIAR)

Brown

Furtu

2013

KARC (EIAR)

Brown

Bakalcha

2010

KARC (EIAR)

Brown

Dibanne

2009

SARC (OARI)

Brown

Horesoba

2019

SARC (OARI)

Brown

Jitu

2012

SARC (OARI)

Brown

Local

-

-

Brown

Remark: HARC=Holeta Agricultural Research Center, KARC=Kulumsa Agricultural Research Center, SARC=Sinana Agricultural Research Center, EIAR=Ethiopia Institute of Agricultural Research, OARI=Oromia Agricultural Research Institute
2.3. Experimental Design and Field Work
The treatments were laid with a randomized completed block design (RCBD) with three replications was used in the study. The experimental plots were 1.5 m × 2 m (3m2) in size, with rows separated by 0.3 m. The distance between plots and blocks was 0.5 m and 1m, respectively. Each plot had five rows, with the middle three used for the collection of the data and the two outermost rows were used as border rows. The experimental sites were plowed three times with draught animals called oxen before planting, and 25 kg ha−1 was used for planting. After weighing the seeds with a sensitive balance, they were assigned to each row, and drilling was used for planting. Planting occurred during 2022 and 2023 main cropping seasons, following the onset of rain and when the locations received the moisture required for germination. Hand weeding was used three times during the experiment’s growing seasons, and 30 kg ha−1 of urea and 50 kg ha−1 of NPS fertilizer were used according to crop recommendations. Harvesting begins in the last week of November of each cropping year, based on the maturity time of the varieties.
2.4. Data Collection
Data on flowering days, maturity days, number of primary branch/plant, capsule number/plant, plant height, and seed yield per plot were collected from the three middle rows. Data for days to flowering, days to maturity, and seed yield were collected on a plot basis on three middle rows.
1. Days to flowering- were calculated from the date of planting when 75% of the crop stand produced the first flower.
2. Days to maturity- The number of days from planting to physiological maturity of the plants was used to compute the days to maturity.
3. Plant height- the average height of five randomly selected plants, measured from the base to the tip of the plant.
4. The number of primary branch/plant- was recorded as the average number of primary branch from five randomly sampled plants taken from the three middle rows of the plots.
5. The number of capsules per plant- It was calculated as the mean number of capsules collected from five randomly selected from the three middle rows of the plots.
6. Seed yield (kg plot−1) - It was calculated as the entire seed yield produced from the plants harvested and threshed and converted into seed yield per hectare.
2.5. Analysis of Variance
The ANOVA was run for the three locations separately and combined over the three locations for all characters using R software. Analysis of variance was carried out to partition the variance due to genotype, environment and genotype by environment interaction, replication within environment and block within replication. The combined analysis of variance was carried out to estimate the additive effects of the environment, genotype and GEI. Analysis of variance was done using R-Software after testing the ANOVA assumptions. Mean separations were estimated using Least Significant Difference (LSD) for the comparison among the experimental varieties at 0.05 probability level.
ANOVA model for a single location as:
Yijk= µ +Gi+Rj+Bkj+Eijk
ANOVA model for the combined over locations as:
Yijkr= µ +Gi+Lj+Rk(Lj) + Br(LjRk) +GiLj+Eijkr.
Where Y is the performance of genotype i in jth location, kth replication and rth incomplete block, μ is the mean effect, Lj is the effect of jth location, Rk(Lj) the effect of the kth replication in location J, Br (LjRk) is the effect of rth incomplete block in jth location and kth replication, GiLj is the interaction effect of genotype i and location j and εijkr is the error associated with the ith genotype, jth location, kth replication, rth incomplete block.
2.6. Stability Analysis
Yield stability of the genotypes was evaluated using different models: Yield stability index (YSI), AMMI Stability Value (ASV), Additive Main Effect and Multiplicative Interaction (AMMI) model and Genotype Main Effect and Genotype x Environment Interaction Effect (GGE) biplot analysis were used to determine the effects of GEI on yields. These analyses also were performed using R software.
2.6.1. Yield Stability Index (YSI)
This measurement was developed by . Stability by itself should not be the only measurement for selection, because the most stable genotypes would not necessarily give the best yield performance. This method is vital to measure and rank genotypes based on grain yield stability. The summation of rank of ASV and rank of yield are used to calculate YSI. The genotype with least YSI is considered as the most stable with high grain yield .
YSI was calculated as:
YSI = RASV + RY
Where: RASV is the rank of AMMI stability value, RY is the rank of mean yield of genotypes across environments.
2.6.2. AMMI Stability Value
The ASV is the distance from the coordinate point to the origin in a two dimensional scatter length of IPCA1 scores against IPCA2 scores in the AMMI model . AMMI Stability Value (ASV), length of genotype and environment markers of the origin in a two dimensional plot of IPCA1 scores against IPCA2 scores was calculated as follow
ASV=IPCA1 Sum SquaresIPCA2 Sum SquaresIPCA1 Score2+[IPCA2 Score]2
Where: IPCA1= interaction principal component axis 1; IPCA2 = interaction principal component, axis 2. Genotypes with lower values of the ASV are considered to be more stable.
2.6.3. Additive Main Effect and Multiplicative Interaction (AMMI) Model
Additive Main Effect and Multiplicative Interaction (AMMI) is one of most widely used model to explain G×E interaction of multi-environment genotype trial and categorizing the genotypes into narrow or wider adaptation . The AMMI analysis uses analysis of variance (ANOVA) followed by a principal component analysis applied to the sums of squares allocated by the ANOVA to the GEI .
The AMMI Model Equation is:
Ῡijk=µ+Gi+Ej+Σmk=1λkαikγjk +Рij
Where: Ῡijk. = the yield of the ith genotype in the jth environment, Gi = the mean of the ith genotype minus the grand mean, Ej = the mean of the jth environment minus the grand mean, λk = the square root of the Eigen value of the kth IPCA axis, αik and γjk = the principal component scores for IPCA axis k of the ith genotypes and the jth environment, Рij = the deviation from the model.
2.6.4. Genotype Main Effect and Genotype by Environment Interaction (GGE) Biplot
The GGE biplot model is: Yij -μ-βj = λ1Ԑi1ηj1 + λ2Ԑi2ηj2 + Ԑij where: Yij= the performance of the ith genotype in the jth environment; μ = the grand mean; βj = The main effect of the environment j: λl and λ2 = Singular value for IPCA1 and IPCA2 respectively:
Ԑi1 and Ԑi2 = Eigen vectors of genotype i IPCA1 and IPCA2 respectively: ηj1 and ηj2 = Eigen vectors of environment j for IPCA1 and IPCA2 respectively; Ԑij = Residual associated with genotype i and environment j.
3. Results and Discussions
3.1. Analysis of Variance
The ANOVA revealed highly significant differences (p<0.01) for seed yield at Bedeele-2023 only and significance differences (p<0.05) at Dabo Hana-2022, Dabo hana-2023, Bedele-2022 and Didesa-2023.
3.1.1. Seed Yield
The average environmental seed yield across varieties ranged from the lowest of 1088.7 kgha-1 at Didesa -2023 to the highest of 1662.9 kgha-1 at Dabo Hana-2023), with a grand mean of 1294.6 kgha-1 (Table 4). The varieties average seed yield across environments ranged from the lowest of 978.9 kgha-1 for local check to the highest of 1588.9a kgha-1 for Kuma (Table 3). This difference could be due to their genetic potential of the varieties, and also environment explained large variation indicated the existence of diverse mega environments.
Table 3. Mean seed yield (kgha-1) of twelve (12) linseed varieties evaluated at six environments.

Mean of seed yield of 12 linseed varieties across environment

Varieties

D/Hana-2022

D/Hana-2023

Bedele-2022

Bedele-2023

Didesa-2023

Mean

Bekoji 14

2288.89a

1400.00bc

1233.33abc

1444.4a

1016.7bc

1476.7ab

Kassa-2

1633.33bcd

1434.44abc

1177.78bc

1077.8abc

1000.0bc

1260.2bc

Welen

1511.11bcd

1544.44ab

1144.44bc

1400.0a

1066.7bc

1333.3abc

Bekoji

1633.33bcd

1355.56bcd

1033.33c

773.3cd

1225.6ab

1204.2cd

Kuma

1788.89b

1527.78abc

1566.67a

1627.8a

1433.3a

1588.9a

Yadano

1322.22cd

1722.22a

1077.78c

1244.4abc

1277.8ab

1328.9bc

Furtu

1755.56bc

1416.67bc

1455.56ab

788.9bcd

1233.3ab

1330.0abc

Bakalcha

1577.78bcd

1090.00d

1146.67bc

1264.4abc

794.4c

1174.7cd

Dibanne

1744.44bcd

1473.33abc

1077.78c

1466.7a

983.3bc

1349.1abc

Horesoba

1725.00bcd

1296.67bcd

1250.00abc

1373.3ab

1058.3bc

1319.3bc

Jitu

1750.00bcd

1368.33bcd

1000.00c

694.4cd

950.0bc

1191.3cd

Local

1255.56d

1244.44cd

1066.67c

338.9d

988.9bc

978.9d

Mean

1662.96

1404.17

1192.78

1124.5

1088.7

1294.6

LSD (0.05)

440.23

291.80

378.56

590.61

322.2

259.8

CV %

16.08

12.16

17.87

31.02

16.95

27.8

P-value

*

*

*

**

*

**

3.1.2. Yield Related Traits
The results of the combined analysis of variance are depicted in Table 4. The combined analysis of variance over the five sites for two seasons revealed a significant (P < 0.01) difference in flowering days and maturity days however, non-significant for plant height, number of primary branch and number of capsule per plant between the studied varieties. Accordingly, the tested linseed varieties shows statistically significant variation that ranged from 47.1 (Kassa-2) and 85.0 (Local check) for days to flowering and 127.8 (Kassa-2) to 153.4 (local check) for days to maturity. From this result kassa-2 was the earliest to maturity whereas local check was the late maturing variety. A similar result was reported by (F. Amsalu et al., 2020).
Table 4. Combined mean yield and other parameters of linseed variety adaptation trial across the three locations.

Varieties

DTF (days)

DTM (days)

PLH (cm)

NPB/PL

NC/PL

Dis. Reac.

Bekoji-14

59.2cd

144.9b

80.4

5.2

27.6

0

Kassa-2

47.1g

127.8f

81.2

5.7

27.9

0

Welen

52.9f

131.5e

74.7

4.4

23.8

0

Bekoji

56.9de

142.9bcd

80.1

4.9

26.9

0

Kuma

62.8bc

142.0d

79.4

5.2

27.3

0

Yadano

56.9de

144.3bc

70.9

4.2

23.3

0

Furtu

63.7b

131.7e

77.9

4.4

22.1

0

Bakalcha

54.0ef

130.0e

73.8

4.4

21.6

0

Dibanne

57.3de

142.8bcd

78.3

4.0

23.8

0

Horesoba

57.2de

142.2cd

76.5

4.6

23.5

0

Jitu

56.6de

142.6cd

79.3

4.4

25.1

0

Local

85.0a

153.4a

78.4

4.5

22.7

0

Grand Mean

59.1

139.68

77.6

4.7

24.6

LSD (0.05)

3.6

2.15

6.9

1.0

6.2

CV %

8.5

2.14

12.3

9.6

14.7

P-value

***

***

NS

NS

NS

3.2. Combined Analysis of Variance for Seed Yield and Yield-Related Traits
The combined analysis of variance showed that significant differences were recorded across location for most of parameters except number of primary branch per plant and number of capsule per plant. After testing the homogeneity of error variances of the test locations, the combined analysis of variance was conducted for each trait with special focus on grain yield and other agronomic traits in order to examine the presence of significant effect of locations, varieties and varieties x location interactions. The mean square of analysis of variance (ANOVA) is presented in Table 5. Significant differences were detected among the main and the interaction effects at (p ≤ 0.05) and (p<0.001) for most of the parameters.
Table 5. Mean square value of combined Analysis of Variance (ANOVA) for seed yield and yield related traits of twelve (12) Linseed varieties tested at three locations for two years.

SOV

DF

DTF (days)

DTM (days)

PLH (cm)

NPB/PL (no)

NC/PL (no)

SY (kgha-1)

Loc.

4

11.07ns

9.20ns

1947.41***

15.22***

1222.38**

2064407**

Rep.

2

0.71ns

21.05*

37.44ns

0.3098ns

26.87ns

3895ns

Yr.

1

18.78ns

1.00ns

2557.94***

56.94***

1047.82***

962579***

Var.

11

1278.28***

877.47***

141.46***

2.86*

76.42ns

356370**

Var.*Loc.

22

151.33***

28.26***

69.06**

2.17ns

51.63ns

104936*

Var.*yr.

11

4.54ns

10.44*

90.67*

1.35ns

71.10ns

166036**

Loc.*yr.

2

2.35ns

3.55ns

40.30ns

0.04ns

1205***

163402*

Var.*Loc.*yr.

22

1.17ns

3.37ns

13.10ns

0.89ns

18.51ns

182392**

Pooled error

118

6.19

5.42

38.56

1.52

41.73

60645

CV

8.50

2.14

12.30

9.60

14.70

27.80

Remark: SOV=source of variations, DF=degree of freedom, DTF=days to flowering, DTM=days to maturity, PLH=plant height, NPBPPL=number of primary branch per plant, NCPPL=number of capsule per plant, GY=grain yield, Loc.=Location, Rep=replication, yr.=year, Var.=variety, CV=coefficient of variations, *=significant 0.05 probability level, **=significant at 0.01 probability level, ***=significant at 0.001 probability level
3.3. Stability Analysis
3.3.1. Yield Stability Index (YSI)
Yield stability index incorporates both mean yield and stability in a single criterion. The minimum values of YSI desirable genotypes with high mean yield and stability.
3.3.2. AMMI Stability Value (ASV)
The ASV measure was proposed to cope up the fact that the AMMI model does not make a provision for a quantitative stability measure . Depending on this method, genotype with least ASV score is the stable, accordingly, variety Kassa-2 followed by Kuma and Horesoba were the most stable respectively. While local, Bekoji-4, Furtu, Dibanne and Jitu were unstable varieties (Table 6). The greater the IPCA scores (Negative or Positive), the more specifically adapted variety is to certain environment. The closer the IPCA scores to zero, the more stable the genotype over the tested locations. The further away from zero the IPCA score for the environments is the more interaction the environment has with the genotypes, thus making difficult to choose genotypes for that environment.
Table 6. The first and second IPCA, Grain Mean yield and different yield stability statistics investigated in linseed varieties over locations.

Code

Varieties

Yield (kgha-1)

rY

PCA1

PCA2

ASV

rASV

YSI

1

Bekoji-14

1476.7

2

9.72

-16.40

23.69

11

13

2

Kassa-2

1260.2

8

-0.29

0.68

0.85

1

9

3

Welen

1333.3

4

6.44

8.88

14.38

4

8

4

Bekoji

1204.2

9

-9.45

-1.37

16.67

5

14

5

Kuma

1588.9

1

5.04

5.01

10.74

2

3

6

Yadano

1328.9

6

-1.48

17.55

17.74

6

12

7

Furtu

1330.0

5

-12.22

-5.04

22.06

10

15

8

Bakalcha

1174.7

11

10.04

-2.98

17.90

7

18

9

Dibanne

1349.1

3

10.5

1.01

18.47

9

12

10

Horesoba

1319.3

7

7.85

-0.22

13.80

3

10

11

Jitu

1191.3

10

-9.02

-9.02

18.25

8

18

12

Local

978.9

12

-17.49

1.91

30.79

12

24

Remark: rY=rank in yield, PCA=principal component Axis, ASV=AMMI stability value, rASV=rank in AMMI stability value, YSI=yield stability value
3.3.3. Additive Main Effects and Multiple Interaction (AMMI) Model
The mean squares for all varieties evaluated under different environmental condition for seed yield are presented below (Table 7). The result indicated that differences among all varieties were significant (P ≤ 0.01). Variation due to genotypes by environments interaction was significant for the studied traits, indicated that genotypes differ genetically in their response to different environment. The genotypes by environments interaction was significant effect on the seed yield, which explained 19.42% of the total variation whiles the genotypes, contributed 12.40% of the variation. However, large portion (26.11%) of the total variation was attributed to the environmental effect. The environment explains a major amount of the yield differential, showing that the environments were different, according to AMMI.
Table 7. Additive main effect and multiplicative interaction analysis of variances (AMMI) for seed yield of twelve Linseed varieties.

Source

D.F.

S.S.

EX.SS %

M.S.

Environments

4

8257629

26.11

2064407**

Block

10

467602

1.48

46760ns

Genotypes

11

3920071

12.40

356370*

Interactions (G x E)

44

6141309

19.42

139575**

PCA1

14

3408677

10.78

243477*

PCA2

12

1939471

6.13

161623*

PCA3

10

642666

2.03

64267ns

PCA4

8

150494

0.48

18812ns

Residuals

110

6696354

21.17

60876

Total

223

31624273

100

141813

Remark: DF=degree of freedom, SS=sum of square, EXSS=explained sum of square, MS=mean sum of square, PCA= = Interaction Principal Component Axis
(i). AMMI 1 Biplot
In AMMI biplot 1 showing main effects means on the abscissa and principal component (IPCA) values as the ordinates, genotypes (environments) that appear almost on a perpendicular line have similar means and those that fall on the almost horizontal line have similar interaction patterns. Genotypes that group together have similar adaptation while environments which group together influences the genotypes in the same way. Genotypes (environments) with large IPCA1 scores (either positive or negative) have high interactions whereas genotypes (environments) with IPCA1 score near zero have small interactions.
AMMI-I consider genotype and locations main effects plus the PCA1 to interpret the residual matrix and represented genotype productivity. It is further stated that any genotype with PCA1 value close to zero shows general adaptation to the tested locations whereas a large genotypic PCA1 score reflects more specific adaptation to location with PCA1 scores of the same size. Genotypes and locations with IPCA1 scores of the same sign produce positive interaction suggesting adaptation of genotypes in those locations whereas the reverse sign of PCA value of genotypes and locations depicts negative interaction i.e., poor performance of genotypes in such locations. In summary, a stable genotype might not be the highest yielding. Genotypes having a zero IPCA1 score are less influenced by the locations and adapted to all locations. The closer the IPCA score to zero, the more stable the genotypes over the tested locations. Since IPCA1 scores of soybean varieties Welen, Horesoba and Kassa-2, were close to zero, they were more stable varieties that across these locations. However, the mean yield of Kassa-2 had a mean yield below average, therefore, they are least preferable. A variety showing high positive interaction in location has the ability to exploit the agro ecological and agro-management conditions of the specific location and is therefore best suited to that location. In this case, Kuma and Bekoji-14 linseed varieties are suited for Dabo Hana. Furtu is suited for Dabo Hana-2023, Bakalcha is suited for Bedele-2023 & Jitu variety is suite for Bedele-2022.
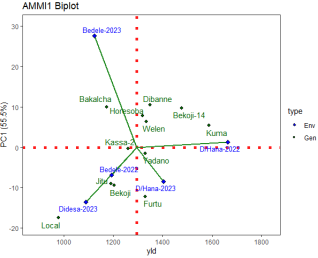
Figure 1. AMMI bi plot of IPCA 1 against grain yield of 12 linseed varieties across locations.
(ii). AMMI 2 Biplot
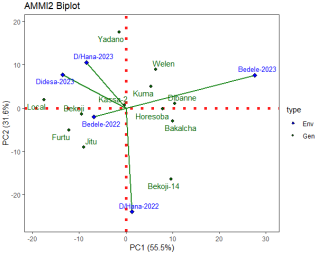
Figure 2. AMMI bi plot of IPCA 1 against PCA2 of 12 linseed varieties across locations.
In AMMI2 biplot, the distances from the biplot origin are indicative of the amount of interaction exhibited by genotypes over environments or environments over genotypes. Genotypes located near the biplot origin are less responsive than the vertex genotypes indicating general adaptability to all environments. Environments with longer vectors are very interactive and discriminate the differences among genotypes more than environments with shorter vectors. Shorter vectors are less interactive and provide little or no information about the differences among genotypes' performances . In this study local check, Yadano, Furtu and Bekoji-14 linseed varieties placed farthest away from the biplot origin & expressed a highly interactive behavior (positively or negatively) whereas Kassa-2, Kuma and Horesoba placed relatively close to the biplot origin expressed less interaction and more adaptable to all locations. In AMMI 2 biplot, those environments having shorter length of arrow do not create strong interaction while those with long length of arrow has strong interaction and they are not favorable to all genotypes. In the present study, Bedele-2022 and Dabo Hana-2023 having shorter spokes interact less with the genotypes whereas Bedele-2023, Dabo Hana-2022 and Didesa-2023 having longer spokes or length of the arrow line exerts high interaction with the genotypes (Figure 2).
3.3.4. GGE Bi-plot Analysis for Grain Yield
(i). Ranking of Genotypes
Stability can be identified using concentric circles and also ideal genotypes are at the center of the concentric circle. The ideal genotype is the one that with the highest mean performance and absolutely stable . The genotypes that are closer to the ideal genotypes are the best performing genotypes. Hence, the GGE bi plots shows that Kuma is an ideal variety, with other varieties, like Dibane, Horesoba, Welen and Bekoji-14 are desirable varieties as they are closer to the ideal variety on the bi plot. The varieties local and Jitu are the most undesirable varieties as they are too far to the ideal variety on the bi plot.
(ii). Ranking of Environments
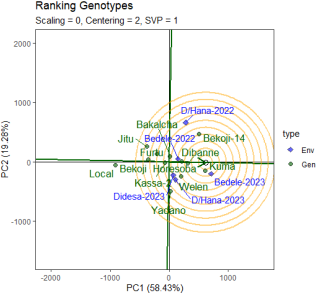
Figure 3. Ranking of the genotypes based on the ideal genotype.
The most representative of the locations (ability to represent the megaenvironment) and the most powerful to discriminate varieties reported that the ideal environment is the one located at the center of the concentric circles, and it is possible to identify desirable environments based on their closeness to the ideal environment reported that a testing location has less power to discriminate genotypes when located far away from the center of the concentric circle or to an ideal location. Therefore, among the test locations, location Bedele which fell into the center of concentric circles was an ideal test location in terms of being the most representative of the overall locations and the most powerful to discriminate the performance of the tested genotypes. Next to the first concentric circle location, locations Dabo Hana-2022 is close to the ideal location while, Didesa is detected as the weakest locations to discriminate varieties.
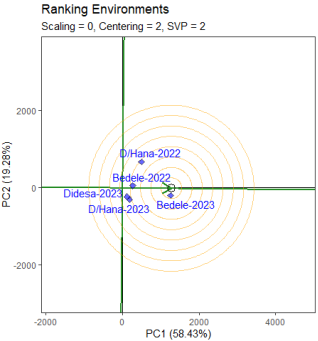
Figure 4. Ranking of the locations based on the ideal locations.
(iii). Which-Won-Where Pattern
The polygon view of GGE bi plot indicates the best genotypes in each environment and group of environments . In this situation, the polygon is formed by connecting the genotypes that are farthest away from the bi plot origin, such that all the other genotypes are contained in the polygon. In this case, the polygon connects all the farthest genotypes and perpendicular lines divide the polygon into sectors. Sectors help to visualize the mega-environments. This means that winning genotypes for each sector are placed at the vertex. Polygon view of the linseed varieties tested at three locations presented in (figure 5). The genotypes found at the vertex of the polygon perform best in the environments within the sector . Six rays divide the bi plot in to six sector and the locations fall in to three different mega-environments (Figure 5).
Accordingly, Yadano, Kuma, Bekoji-14, Jitu and local varieties were the vertex varieties. From this figure, Yadono variety best performer at Didesa and Dabo Hana 2023 in mega environment. The second environment containing the higher yielding environment Bedele-2023, with winner variety Kuma. The third environment includes Dabo Hana-2022 with a winner variety Bekoji-14. From the figure, Jitu and local had no environment on the vertex. This indicates that varieties in the vertex without environment performed poorly in all the locations.
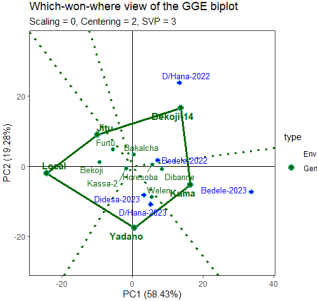
Figure 5. Which won where pattern.
4. Conclusion and Recommendation
Combined analysis of variance (ANOVA) result revealed significant difference of seed yield and most of yield contributing traits among evaluated Linseed varieties across locations, years and the interactions. This indicated that, the location and fluctuation of weather condition over the cropping season had affected performance of varieties. Although the GEI of grain yield partitioned in to different IPCAs using AMMI model analysis, the first principal component axis for interaction alone explains most of the interaction sum of squares. The sign and magnitude of IPCA scores showed the relative contribution of each genotype and environment for the genotype and environment interactions.
This helps to summarize the pattern and magnitude of GEI and main effects that reveal clear insight into the adaptation of genotypes to environments. This shows that, Kuma and Bekoji-14 varieties are fewer contributors to the interaction effect and have consistent performances across locations. Therefore, Kuma and Bekoji-14 were identified as the best varieties in terms of yielding ability, stability and better agronomic performance.
Abbreviations

ANOVA

Analysis of Variance

GGE

Genotype, Genotype by Environment Interaction

JARC

Jimma Agricultural Research Center

LSD

Least Significant Difference

IPCA

Interactive Principal Component Axis

RCBD

Randomized Complete Block Design

Acknowledgments
The authors greatly acknowledged Oromia Agricultural Research Institute (IQQO) for the fincial support and Sinana, Kulumsa and Holetta Agricultural Research Centers are also highly acknowledged for providing the linseed improved varieties for the experiment.
Author Contributions
Mohammed Tesiso: Conceptualization, Data curation, Formal Analysis, Funding acquisition, Investigation, Methodology, Resources, Software, Supervision, Visualization, Writing – original draft, Writing – review & editing
Garoma Firdisa: Conceptualization, Resources, Supervision
Conflicts of Interest
The authors declare no conflicts of interest.
References
[1] Nozkova, J., P. Martin, B. Marie, B. Nina, T. Eva, P. Elezaveta and B. Jan. 2016. Descriptor list of flax (Linum usitatissimum L.). Slovak University of Agriculture. ISBN978-80-552-1484-9.
[2] CSA (Central Statistical Authority), Agricultural Sample Survey Report on Area and Production for Major Crops (Private Peasant Holdings Meher Season) for 2020/2021. The Federal Democratic Republic of Ethiopia, Statistical Bulletin, Addis Ababa, Ethiopia, 2021.
[3] V. Popovic, A. Marjanovic Jeromela, Z. Jovovic et al., “Linseed (Linum usitatissimum L.),” Book Title: Serbia: Current Issues and Challenges in the Areas of Natural Resources, Agriculture and Environment, pp. 123–147, NOVA Science Publishers, Inc, New York, NY, USA, 2019.
[4] S. Yechalew, H. Mesfn, A. Behailu, and T. Abush, Linseed (Linum usitatissimum L.) Variety Adaptation at South Western Ethiopia, vol. 5, no. 4, pp. 41–45, 2019.
[5] W. Adugna, “Assessment of tissue culture drived regenerants of linseed (Linum usitatissimum L.) in Ethiopia,” M.S.C. thesis, Department of Plant Breeding, Faculty of Agriculture, University of the Free State, Bloemfontein, South Africa, 2000.
[6] FAO (Food and Agricultural Organization), Area Harvested, Total Production and Productivity of Crops, 2008,
[7] FAO/Wfp (Food and Agriculture Organization and World Food Program), Crop and Food Security Assessment Midsession to Ethiopia, 2010,
[8] MoA (Ministry of Agriculture and Natural Resources), Plant Variety Release, Protection and Seed Quality Control Directorate, Crop Variety Register, no. 19, Addis Ababa, Ethiopia, 2016.
[9] A. G. Birhanu, K. Kahsay, and N. Kidane, “Yield evaluation and character association of linseed (Linum usitatissimum L.) genotypes in moisture stress areas of South Tigray, Ethiopia,” Journal of Cereals and Oilseeds, vol. 11, no. 1, pp. 16–20, 2020.
[10] W. Adugna, “Linseed (Linum usitatissimum L.),” in Vegetable Oils and Fats, Plant Resources of Tropical Africa (PROTA) No. 14, In: H. A. M. van der Vossen and G. S. Mkamilo, Eds., pp. 108–115, PROTA Foundation, Wageningen, Te Netherlands, 2007.
[11] Grüneberg, W. J., K. Manrique, D. Zhang and M. Hermann. 2005. Genotype × Envinronment Interactions for a Diverse Set of Sweetpotato Clones Evaluated across Varying Ecogeographic Conditions in Peru. Crop Science, 45: 2160-2171.
[12] Purchase, J. L., Hatting, H., & Deventer, C. S. van. (2000). Genotype × environment interaction of winter wheat (Triticum aestivum L.) in South Africa: II. Stability analysis of yield performance. South African Journal of Plant and Soil, 17(3), 101–107.
[13] Yan, W. and Hunt, L. A., 2002. Biplot analysis of diallel data. Crop science, 42(1), pp. 21-30.
[14] Tinker, N. A., and W. Yan. "Information systems for crop performance data." Canadian journal of plant science 86.3 (2006): 647-662.
[15] Rad, MR Naroui, et al. "Genotype environment interaction by AMMI and GGE biplot analysis in three consecutive generations of wheat (Triticum aestivum) under normal and drought stress conditions." Australian Journal of Crop Science 7.7 (2013): 956.
[16] Purchase, H., 1997, September. Which aesthetic has the greatest effect on human understanding? In International Symposium on Graph Drawing (pp. 248-261). Springer, Berlin, Heidelberg.
[17] Farshadfar, E., Zali, H. and Mohammadi, R., 2011. Evaluation of phenotypic stability chickpea genotypes using GGE-Biplot. Ann. Biol. Res, 2(6), pp. 282-292.
[18] Dabessa A, Alemu B, Abebe Z, Lule D (2016). Genotype by Environment Interaction and Kernel Yield Stability of Groundnut (Arachis hypogaea L.) Varieties in Western Oromia, Ethiopia. Journal of Agriculture and Crops 2(11): 113-120.
[19] Crossa, J., Gauch Jr, H. G. and Zobel, R. W., 1990. Additive main effects and multiplicative interaction analysis of two international maize cultivar trials. Crop Science, 30(3), pp. 493-500.
[20] Kempton, R. A., 1984. The use of biplots in interpreting variety by environment interactions. The Journal of Agricultural Science, 103(1), pp. 123-135.
Cite This Article
  • APA Style

    Tesiso, M., Firdisa, G. (2024). Performance Evaluation of Linseed (Linum usitatissimum L.) Varieties in Buno Bedele Zone, South Western Oromia. Bioprocess Engineering, 8(2), 24-35. https://doi.org/10.11648/j.be.20240802.11

    Copy | Download

    ACS Style

    Tesiso, M.; Firdisa, G. Performance Evaluation of Linseed (Linum usitatissimum L.) Varieties in Buno Bedele Zone, South Western Oromia. Bioprocess Eng. 2024, 8(2), 24-35. doi: 10.11648/j.be.20240802.11

    Copy | Download

    AMA Style

    Tesiso M, Firdisa G. Performance Evaluation of Linseed (Linum usitatissimum L.) Varieties in Buno Bedele Zone, South Western Oromia. Bioprocess Eng. 2024;8(2):24-35. doi: 10.11648/j.be.20240802.11

    Copy | Download

  • @article{10.11648/j.be.20240802.11,
      author = {Mohammed Tesiso and Garoma Firdisa},
      title = {Performance Evaluation of Linseed (Linum usitatissimum L.) Varieties in Buno Bedele Zone, South Western Oromia
    },
      journal = {Bioprocess Engineering},
      volume = {8},
      number = {2},
      pages = {24-35},
      doi = {10.11648/j.be.20240802.11},
      url = {https://doi.org/10.11648/j.be.20240802.11},
      eprint = {https://article.sciencepublishinggroup.com/pdf/10.11648.j.be.20240802.11},
      abstract = {Linseed (Linum usitatissimum L.) is one of the most important oil crops of Ethiopia and it is considered as the main food crop and the least expensive source of oil for the farmers in many highlands of the country. Even though numerous improved linseed varieties have been released in Ethiopia, the mean seed yield per unit area of the crop remains low due to poor access to improved varieties. To improve the crop’s production and productivity, testing the performance of improved linseed varieties in potential agro ecologies where the varieties have never been grown before is an essential activity. A study was carried out with the objective of testing the performance of improved linseed varieties and their genetic variability for seed yield and related traits in Bedele, Dabo Hana and Didesa districts of Buno Bedele zone, south western Oromia, Ethiopia. This experiment was carried out using twelve linseed varieties were used for investigation (Bekoji-14, Kassa-2, Welen, Bekoji, Kuma, Yadano, Furtu, Bakalcha, Dibane, Horesoba & Jitu) and one local check were sown in randomized complete block design with three replications during the 2022/2023 and 2023/2024 main cropping seasons. Six (6) quantitative morphological traits were collected and analyzed by using R-software accordingly. Combined analysis of data from the three locations revealed that there is significant difference among varieties for days to flowering, days to maturity and grain yield, but non-significant for plant height (cm), number of primary branches per plant and number of capsules per plant. Significant effect of location was observed in plant height, number of primary branch per plant, number of capsule per plant and grain yield however non-significant in days to flowering and days to maturity. The interaction of Variety X location was significant for days to flowering, days to maturity, plant height and grain yield, however non-significant for number of primary branch per plant and number of capsule per plant. The maximum seed yield was recorded in varieties Kuma (1588.9 kgha-1) followed by Beokoji-14 (1476.7 kgha-1) and the lowest yield (978.9 kg/ha-1) was obtained from local check. The combine AMMI analysis for seed yield across environments revealed significantly affected by environments that hold 26.6% of the total variation. The genotype and genotype by environmental interaction were significant and accounted for 12.40% and 19.42% respectively. Principal component 1 and 2 accounted for 10.78 % and 6.13% of the GEI respectively with a total of 16.91% variation. In general, Kuma and Bekoji-14 varieties were identified as the best varieties for yielding ability, stability and recommended in the area and with similar agro-ecologies.
    },
     year = {2024}
    }
    

    Copy | Download

  • TY  - JOUR
    T1  - Performance Evaluation of Linseed (Linum usitatissimum L.) Varieties in Buno Bedele Zone, South Western Oromia
    
    AU  - Mohammed Tesiso
    AU  - Garoma Firdisa
    Y1  - 2024/09/20
    PY  - 2024
    N1  - https://doi.org/10.11648/j.be.20240802.11
    DO  - 10.11648/j.be.20240802.11
    T2  - Bioprocess Engineering
    JF  - Bioprocess Engineering
    JO  - Bioprocess Engineering
    SP  - 24
    EP  - 35
    PB  - Science Publishing Group
    SN  - 2578-8701
    UR  - https://doi.org/10.11648/j.be.20240802.11
    AB  - Linseed (Linum usitatissimum L.) is one of the most important oil crops of Ethiopia and it is considered as the main food crop and the least expensive source of oil for the farmers in many highlands of the country. Even though numerous improved linseed varieties have been released in Ethiopia, the mean seed yield per unit area of the crop remains low due to poor access to improved varieties. To improve the crop’s production and productivity, testing the performance of improved linseed varieties in potential agro ecologies where the varieties have never been grown before is an essential activity. A study was carried out with the objective of testing the performance of improved linseed varieties and their genetic variability for seed yield and related traits in Bedele, Dabo Hana and Didesa districts of Buno Bedele zone, south western Oromia, Ethiopia. This experiment was carried out using twelve linseed varieties were used for investigation (Bekoji-14, Kassa-2, Welen, Bekoji, Kuma, Yadano, Furtu, Bakalcha, Dibane, Horesoba & Jitu) and one local check were sown in randomized complete block design with three replications during the 2022/2023 and 2023/2024 main cropping seasons. Six (6) quantitative morphological traits were collected and analyzed by using R-software accordingly. Combined analysis of data from the three locations revealed that there is significant difference among varieties for days to flowering, days to maturity and grain yield, but non-significant for plant height (cm), number of primary branches per plant and number of capsules per plant. Significant effect of location was observed in plant height, number of primary branch per plant, number of capsule per plant and grain yield however non-significant in days to flowering and days to maturity. The interaction of Variety X location was significant for days to flowering, days to maturity, plant height and grain yield, however non-significant for number of primary branch per plant and number of capsule per plant. The maximum seed yield was recorded in varieties Kuma (1588.9 kgha-1) followed by Beokoji-14 (1476.7 kgha-1) and the lowest yield (978.9 kg/ha-1) was obtained from local check. The combine AMMI analysis for seed yield across environments revealed significantly affected by environments that hold 26.6% of the total variation. The genotype and genotype by environmental interaction were significant and accounted for 12.40% and 19.42% respectively. Principal component 1 and 2 accounted for 10.78 % and 6.13% of the GEI respectively with a total of 16.91% variation. In general, Kuma and Bekoji-14 varieties were identified as the best varieties for yielding ability, stability and recommended in the area and with similar agro-ecologies.
    
    VL  - 8
    IS  - 2
    ER  - 

    Copy | Download

Author Information
  • Abstract
  • Keywords
  • Document Sections

    1. 1. Introductions
    2. 2. Materials and Methods
    3. 3. Results and Discussions
    4. 4. Conclusion and Recommendation
    Show Full Outline
  • Abbreviations
  • Acknowledgments
  • Author Contributions
  • Conflicts of Interest
  • References
  • Cite This Article
  • Author Information