Abstract
Walking accounts for the dominant share over other modes of transport in Ethiopia. In the course of walking from place to place in built-up areas, pedestrians cross road-traffic streams that pose a risk of road crash fatalities and injuries. Pedestrian’s crossing behavior and the risk of pedestrian crashes vary with various factors including pedestrians’ physical and mental states, safety awareness, and socioeconomic characteristics as well as the adequacy of road crossing facilities. The aim of this research is to investigate and model the gap acceptance behavior of pedestrians at road mid-block crossings in Bahir Dar City. A field survey was carried out at four road mid-block pedestrian crossing locations on different streets of Bahir Dar city. Pedestrian crossings were videotaped in real traffic conditions and variables of pedestrian characteristics and their road crossing behaviors, vehicular and roadway characteristics were extracted using playback technique with AVS Video Editor Software and analyzed using SPSS-20. The statistical analysis of the combined data resulted in critical (50th percentile) and 85th percentile accepted gaps of 5.0 seconds and 7.2 seconds to cross at road mid-blocks, respectively. Multiple linear regression (MLR) and binary logistic regression (BLR) analyses showed pedestrian road crossing behavior as the main factor for both pedestrian gap acceptance and crossing decision compared to driver, roadway, and vehicular characteristics.
Keywords
Pedestrians’ Behavior, Gap Acceptance, Crossing Decision, Road Mid-Block
1. Introduction
Walking is the dominant mode of personal mobility in low- and middle-income countries, as is the case in Bahir Dar City. Despite high pedestrian traffic volumes, road-crossing facilities are not adequately available for pedestrians to cross traffic streams safely. This forces pedestrians to cross traffic at road mid-blocks and intersections randomly, which negatively impacts the safety of pedestrians in the city. It is worth mentioning a recent study conducted in Bahir Dar city
| [1] | Gashaw, M. The effects of selected crash parameters and traffic volume on crash frequency: The case of Bahir Dar city. MSc Thesis, Addis Ababa University, Ethiopia, 2018. |
[1]
in which pedestrian road fatalities were found to constitute 89% of all road crash deaths. This aligns with broader national safety concerns about high-risk pedestrian safety variables in similar metropolitan corridors assessed using ordinal logistic regression techniques
| [14] | Bishaw, T. W., Nurye, G., & Singh, R. Investigating factors of pedestrian safety using ordinal logistic regression in Addis Ababa City roads. Frontiers in Sustainable Cities, 2024, 6(1488387), 1-15. https://doi.org/10.3389/frsc.2024.1488387 |
[14]
.
This paper presents a study conducted on pedestrians' gap acceptance behavior when crossing at road mid-blocks. Models were developed for minimum accepted pedestrian gaps and crossing decisions with selected variables such as pedestrian characteristics and their road crossing behaviors, driver and traffic characteristics, and roadway features. Pedestrian gap acceptance behavior is closely related to the road crash risk-taking behavior of individuals. The findings of this investigation are thus highly beneficial to policymakers, transport planners, and traffic engineers in the provision of pedestrian facilities as part of road infrastructure.
2. Literature Review
Ethiopia is one of the low and middle-income countries where built-up areas are dominated by a high volume of pedestrians crossing erratically at road mid-blocks even where traffic is speeding, which poses a high risk of pedestrian road crashes
| [2] | Tulu, G. S. Pedestrian crashes in Ethiopia: Identification of contributing factors through modelling of exposure and road environment variables. PhD Thesis, Queensland University of Technology, Australia, 2015. |
[2]
. In Ethiopian cities like Dukem, Shanko et al. showed that pedestrian gap acceptability in mixed traffic environments is still quite vulnerable to diverse vehicle splits and unexpected traffic dynamics
| [15] | Shanko, S., Reddy, R., & Torban, J. Pedestrian Gap Acceptance Behavior at Un-Signalized Intersections under Mixed Traffic Conditions - A Case Study at Dukem City, Ethiopia. Journal of Road and Traffic Engineering, 2025, 71(3), 1-8.
https://doi.org/10.31075/PIS.71.03.01 |
[15]
. Pedestrian safety at mid-block crossings depends on pedestrians’ road crossing behavior, roadway, and traffic characteristics. Researchers have shown how pedestrian road crossing behavior at road mid-blocks follows the gap acceptance theory
| [3] | Alajnaf, I. O., Emhamed, K. M., & Almadani, M. M. Pedestrian Gap Acceptance and Crossing Decision Outside Crossing Facilities along Urban Streets in Malaysia: A Case Study of Rughaya Street, Batu Pahat, Johor, Malaysia. The International Journal of Engineering and Information Technology (IJEIT), 2016, 3(1), 18-22. https://doi.org/10.36602/ijeit.v3i1.275 |
| [4] | Kadali, B. R., & Vedagiri, P. Evaluation of pedestrian accepted vehicle gaps with varied roadway width under mixed traffic conditions. Transportation Letters, 2019, 11(9), 527-534.
https://doi.org/10.1080/19427867.2017.1408204 |
[3, 4]
.
Normally, pedestrians tend to cross a street following a zigzag path (rolling) to use smaller gaps instead of waiting for larger gaps
| [4] | Kadali, B. R., & Vedagiri, P. Evaluation of pedestrian accepted vehicle gaps with varied roadway width under mixed traffic conditions. Transportation Letters, 2019, 11(9), 527-534.
https://doi.org/10.1080/19427867.2017.1408204 |
| [5] | Brewer, M. A., Fitzpatrick, K., Whitacre, J. A., & Lord, D. Exploration of pedestrian gap-acceptance behavior at selected locations. Transportation Research Record, 2006, 1982(1), 132-140. https://doi.org/10.1177/0361198106198200117 |
[4, 5]
. A study in Egypt investigated mean accepted gap sizes for street crossings with and without rolling and found them to be 2.76 s and 5.22 s, respectively
| [6] | Serag, M. S. Modelling pedestrian road crossing at uncontrolled mid-block locations in developing countries. International Journal for Computational Civil and Structural Engineering, 2014, 4(3), 274-285. |
[6]
. Scholars in India have also investigated the rolling behavior of crossing pedestrians in gap acceptance
| [4] | Kadali, B. R., & Vedagiri, P. Evaluation of pedestrian accepted vehicle gaps with varied roadway width under mixed traffic conditions. Transportation Letters, 2019, 11(9), 527-534.
https://doi.org/10.1080/19427867.2017.1408204 |
| [7] | Kadali, B. R., & Perumal, V. Critical gap analysis based on pedestrian behavior during peak-hour traffic at unprotected midblock crosswalks. Asian Transport Studies, 2016, 4(1), 261-277. |
| [8] | Kadali, B. R., Rathi, N., & Perumal, V. Evaluation of pedestrian mid-block road crossing behavior using an artificial neural network (ANN). 14th COTA International Conference of Transportation Professionals, 2014, 1911-1922.
https://doi.org/10.1061/9780784413654.184 |
[4, 7, 8]
. Kadali et al.
| [8] | Kadali, B. R., Rathi, N., & Perumal, V. Evaluation of pedestrian mid-block road crossing behavior using an artificial neural network (ANN). 14th COTA International Conference of Transportation Professionals, 2014, 1911-1922.
https://doi.org/10.1061/9780784413654.184 |
[8]
found mean accepted gaps of 3.05 s and 5.38 s for crossings with and without rolling, respectively. The effect of walking speed was also studied by Brewer et al.
| [5] | Brewer, M. A., Fitzpatrick, K., Whitacre, J. A., & Lord, D. Exploration of pedestrian gap-acceptance behavior at selected locations. Transportation Research Record, 2006, 1982(1), 132-140. https://doi.org/10.1177/0361198106198200117 |
[5]
and Kadali and Vedagiri
| [4] | Kadali, B. R., & Vedagiri, P. Evaluation of pedestrian accepted vehicle gaps with varied roadway width under mixed traffic conditions. Transportation Letters, 2019, 11(9), 527-534.
https://doi.org/10.1080/19427867.2017.1408204 |
[4]
. Alver and Katanalp
| [16] | Alver, Y., & Katanalp, S. Evaluating the Pedestrian Gap Acceptance in Semicontrolled Midblock Crosswalks with an Integrated AHP-FL Approach. Journal of Transportation Engineering, Part A: Systems, 2022, 148(9), 114-123.
https://doi.org/10.1061/JTEPBS.0000720 |
[16]
successfully established integrated analytical frameworks that use hierarchical or fuzzy logic approaches to describe spatial gap measures at semi-controlled crossing layouts in order to handle these behavioral uncertainties more thoroughly. Moreover, Kadali and Vedagiri
| [4] | Kadali, B. R., & Vedagiri, P. Evaluation of pedestrian accepted vehicle gaps with varied roadway width under mixed traffic conditions. Transportation Letters, 2019, 11(9), 527-534.
https://doi.org/10.1080/19427867.2017.1408204 |
[4]
found that pedestrian-accepted gap sizes increased with pedestrian platoon size. Alajnaf et al.
| [3] | Alajnaf, I. O., Emhamed, K. M., & Almadani, M. M. Pedestrian Gap Acceptance and Crossing Decision Outside Crossing Facilities along Urban Streets in Malaysia: A Case Study of Rughaya Street, Batu Pahat, Johor, Malaysia. The International Journal of Engineering and Information Technology (IJEIT), 2016, 3(1), 18-22. https://doi.org/10.36602/ijeit.v3i1.275 |
[3]
also investigated the effect of long waiting times, which often lead pedestrians to make a wrong judgment to arbitrarily accept smaller gaps.
Studies have shown the effect of vehicle speed on the size of gap acceptance
| [6] | Serag, M. S. Modelling pedestrian road crossing at uncontrolled mid-block locations in developing countries. International Journal for Computational Civil and Structural Engineering, 2014, 4(3), 274-285. |
| [9] | Cherry, C., Donlon, B., Yan, X., Moore, S. E., & Xiong, J. Illegal mid-block pedestrian crossings in China: gap acceptance, conflict and crossing path analysis. International Journal of Injury Control and Safety Promotion, 2012, 19(4), 320-330.
https://doi.org/10.1080/17457300.2011.628751 |
| [10] | Kadali, B. R., & Vedagiri, P. Modelling pedestrian road crossing behaviour under mixed traffic condition. European Transport, 2013, 55(3), 1-17. |
[6, 9, 10]
. Yannis et al.
indicated that pedestrians accept larger gaps when facing larger vehicles. Furthermore, Kadali and Vedagiri
| [4] | Kadali, B. R., & Vedagiri, P. Evaluation of pedestrian accepted vehicle gaps with varied roadway width under mixed traffic conditions. Transportation Letters, 2019, 11(9), 527-534.
https://doi.org/10.1080/19427867.2017.1408204 |
[4]
found a significant effect of vehicle type on gap acceptance on two-lane and four-lane divided roads as compared to six-lane divided roads. Sun et al.
| [12] | Sun, D., Ukkusuri, S., Benekohal, R. F., & Waller, S. T. Modeling of motorist-pedestrian interaction at uncontrolled mid-block crosswalks. 82nd Annual Meeting of the Transportation Research Board, 2003, Washington, DC. |
[12]
found a significant reduction of pedestrian gap size with the increase in driver yield behavior at crosswalk locations. Additionally, recent international research in urban networks in low- and middle-income countries (LMICs) has shown that inconsistent vehicle yielding behavior places the full risk calculation load on crossing pedestrians, compelling them to reduce their temporal clearing thresholds
| [17] | Kumari, S., Mukherjee, S., & Mitra, S. Pedestrian safety countermeasure performance assessment and predictive gap analysis in LMIC urban networks. Transportation Safety and Security, 2025, 17(2), 201-218.
https://doi.org/10.1016/j.jss.2024.102201 |
| [18] | Fattah, M. A., Rahman, M. M., & Islam, M. S. Evaluating the Pedestrian Gap Acceptance and Risk Factors in Khulna City Unsignalized Intersections. Asian Transport Studies, 2025, 11(3), 89-102. https://doi.org/10.1016/j.ats.2025.100089 |
[17, 18]
. On the other hand, the effect of zebra crossings on gap acceptance under mixed traffic conditions is less
| [4] | Kadali, B. R., & Vedagiri, P. Evaluation of pedestrian accepted vehicle gaps with varied roadway width under mixed traffic conditions. Transportation Letters, 2019, 11(9), 527-534.
https://doi.org/10.1080/19427867.2017.1408204 |
[4]
. Marked crosswalks were associated with a higher pedestrian crash rate compared to unmarked crosswalks
| [9] | Cherry, C., Donlon, B., Yan, X., Moore, S. E., & Xiong, J. Illegal mid-block pedestrian crossings in China: gap acceptance, conflict and crossing path analysis. International Journal of Injury Control and Safety Promotion, 2012, 19(4), 320-330.
https://doi.org/10.1080/17457300.2011.628751 |
[9]
. Conversely, the advantage of a median on gap acceptance was indicated in another study since medians provide a secure crossing in two stages
| [4] | Kadali, B. R., & Vedagiri, P. Evaluation of pedestrian accepted vehicle gaps with varied roadway width under mixed traffic conditions. Transportation Letters, 2019, 11(9), 527-534.
https://doi.org/10.1080/19427867.2017.1408204 |
[4]
.
3. Materials and Methods
This study was conducted on four arterial road mid-block pedestrian crossing locations in Bahir Dar city. The sites were selected on unobstructed road sections considering the nature of frontage land uses, pedestrian and traffic volumes far from road intersections and access roads, as summarized in
Table 1. The selected road sections are two-way dual carriageways with uniform roadway widths and median openings.
Table 1. Land use, traffic, and roadway characteristics of study sites.
Selected Site | Land Use | Presence of Crosswalk Marking | Road Cross-section Width (meter) | Traffic Volume | Pedestrian Volume |
Left | Median | Right |
Kuchit Market Center | Market Center | Yes | 10.4 | 2.55 | 10.5 | 1,091 | 797 |
Zenbaba Pension | Mixed Use | Yes | 10.3 | 2.5 | 10.3 | 1,532 | 251 |
Martyrs’ memorial monument | Offices & Services | No | 10.3 | 1.9 | 10.3 | 1,208 | 108 |
Habesha guest house | Residential | Yes | 10.3 | 1.9 | 10.3 | 1,240 | 84 |
The site characteristics and road geometry data were collected from the four road mid-blocks through field observations and measurements as appropriate. Video recording was conducted using high-resolution cameras for recording both vehicular and pedestrian flows during 07:00–10:00 and 15:30–18:30. Using the AVS Video Editor software, all required data was extracted using a playback technique with microsecond accuracy.
Table 2 shows gaps extracted from the video records. The total number of accepted (including lags) vehicular gaps extracted from the video was 726. The largest rejected gaps were also recorded for binary logistic regression.
Table 2. Gaps extracted from video records.
Study Site | Duration | Total number of gaps accepted | Total number of largest gaps rejected |
Kuchit Market Centre | 30 minutes | 324 | 307 |
Zenbaba Pension | 1 hour | 176 | 160 |
Martyrs Memorial Monument | 1 hour | 69 | 48 |
Habesha Guest House | 2 hours | 157 | 114 |
Pedestrian characteristics (sex, age, etc.), pedestrian crossing behaviors (rolling, skew crossing, cellphone usage, crossing speed, platoon size, etc.), vehicular characteristics (vehicle type, travel lane, speed, etc.), roadway characteristics (travel lane, adjacent land use, waiting place, etc.), and driver give-way behaviors were extracted from the video recordings. The operating speeds of vehicles were calculated between two points indicated prior to videography with a distance ranging from 20.0 to 30.0 meters. In general, more than 27 explanatory variables were extracted from the video, which are related to pedestrian, driver, roadway, and vehicular characteristics.
Pedestrian road crossing behavior at mid-blocks was investigated using two types of models. The first model is a multiple linear regression (MLR) technique which was used to relate the minimum accepted gaps with pedestrian characteristics and their crossing behaviors, driver, vehicular, and roadway characteristics as follows:
(1)
Where Log-Gap = logarithm of accepted gaps; X1-n = explanatory variables; β1-n = estimated parameters; β0 = constant.
The second model is a binary logistic regression (BLR) used to predict the probability of a pedestrian deciding to cross or reject based on a linear combination function (utility function) expressed as:
(2)
Where Ui = the utility of choosing alternative i; i = the alternative (accept/reject); n = number of independent variables; αi = constant; βi-n = coefficients.
The utility of alternative ‘i’ was transformed into a probability to predict whether a particular available gap was chosen or not. The probability of a pedestrian to cross a street can be given as:
Where Ui: the utility of choosing alternative ‘i’; P (i): the probability of choosing alternative ‘i’; where i =1 for the accepted gap, and i = 0 for the rejected gap.
4. Results and Discussion
The cumulative percentage of pedestrians accepting or rejecting gaps was plotted in accordance with Raff’s definition of determining critical gaps at which 50% of the waiting pedestrians accepted the available gap for crossing at the different study sites. Accordingly, the average and 85
th-percentile crossing speeds and pedestrian gap acceptances found at each site are as summarized in
Table 3.
Table 3. Pedestrian crossing speed and gap acceptance for each study site.
Study site | Crossing Speed in m/s | Gap Acceptance (sec) |
Average | 85th-percentile | Critical gap (50%) | 85%-percentile |
Martyrs Memorial Monument | 1.35 | 1.58 | 6.80 | 7.60 |
Habesha Guest House | 1.59 | 2.00 | 6.50 | 9.10 |
Kuchit Market Center | 1.57 | 1.98 | 4.40 | 6.40 |
Zenbaba Pension | 1.40 | 1.73 | 4.80 | 6.50 |
Combined data | 1.51 | 1.87 | 4.97 | 7.20 |
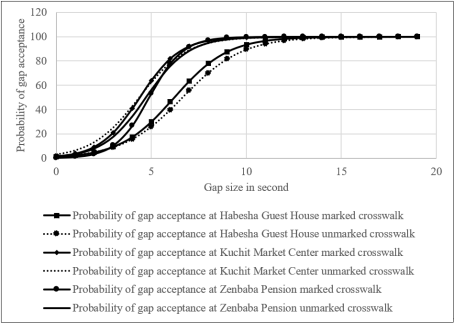
Figure 1 shows the effect of zebra crossings on pedestrian gap acceptance. A one-way analysis of variance was conducted; however, the mean gap acceptance at marked and unmarked crossings was not found to be significantly different. This result is a reflection of drivers’ failure to yield to pedestrians at a marked zebra crossing in accordance with the traffic regulations in Bahir Dar city.
Figure 1. Effect of marked crossing on the probability of gap acceptance.
The distribution, skewness, and kurtosis of the continuous data were checked. There were no irregularities or extreme outliers found in the dataset. The selected variables were also normally distributed. The Variance Inflation Factors (VIFs) showed the nonexistence of collinearity between variables. Furthermore, linearity was tested using a scatter plot of the dependent and independent variables. Following the data scrutiny, regression analyses were made using BLR and MLR methods to investigate pedestrian crossing decisions and minimum accepted gaps, respectively. MLR model was developed for each site as well as for all the sites using combined data with stepwise regression using the Statistical Package for the Social Sciences (SPSS, version 20). The significant variables were established at 95% confidence level for models for both individual sites and combined data. According to the results of the analyses, pedestrians’ safety margin, crossing speed, rolling behavior, type of gap, and vehicular arrival rate were found to be the most important factors that significantly influence the minimum gap acceptance.
Table 4. Pedestrian gap acceptance models at individual sites.
Location | MLR model equation | R-square |
Martyrs Memorial Monument | Log-gap = 1.254 + 0.03*SM-0.212*PCS + 0.107*TOG-0.412*VAR-0.033*Rbeh | 0.915 |
Habesha Guest House | Log-Gap = 0.988 + 0.026*SM-0.089*PCS + 0.161*TOG-0.747*VAR + 0.039*Rbeh + 0.038*PWP + 0.002*WT | 0.942 |
Kuchit Market Center | Log-gap = 0.8 + 0.037*SM-0.607*VAR + 0.111*Rbeh-0.102*PCS + 0.007*WT + 0.138*TOG + 0.053*PWP-0.035*NODC + 0.034*VTL + 0.047*PScc + 0.016*PPS + 0.023*PCD | 0.802 |
Zenbaba Pension | Log-gap = 1.306 + 0.034*SM-0.617*VAR + 0.008*WT-0.298*NOBC-0.112*PCS-0.086*SOC + 0.051*Rbeh + 0.026*VD | 0.894 |
Table 4 presents the summary of the MLR models for each site. The Martyrs Memorial Monument model has a fewer explanatory variables while the Kuchit Market Center site model has a more explanatory variables. Kuchit Market has a higher number of pedestrians where many try to cross the road using different crossing gestures due to slower vehicle speed. The Martyr’s Memorial site, on the other hand, has higher vehicle arrival rate and traffic speed which prevented pedestrians from accepting smaller gap sizes.
The MLR model developed for the combined data is:
(4)
Where Log-gap = Logarithm of pedestrian accepted gap size; SM = Safety margin (sec.); PCS = Pedestrian crossing speed (m/s); TOG = Type of gap; VAR = Vehicular arrival rate (Vehicle/ second); Rbeh = Rolling behavior; PWP = pedestrian waiting place; WT = waiting time (sec.); NODC = number of Observations of the incoming vehicles; NOBC = number of Observation of the incoming vehicles before starting to cross; VTL = vehicular travel lane; PScc = pedestrian speed change condition; PPcc = pedestrian path change condition; PPS = Pedestrian platoon size; SOC = Stage of crossing; VD = Vehicular direction; DYB = driver yield behavior; PCT = Pedestrian crossing tactics; VS = Vehicle speed at crosswalk locations (km/hr).
The estimated coefficient β represents the change in the output variable (gap acceptance) due to unit change in the input. The sign of beta (β) indicates an increase or decrease in accepted gap size with a change in independent variables. The standardized beta describes the elasticity of each of the variables. For example, an increase of 1% in safety margin results in an increase of 58.5% of the traffic gap accepted. In addition, a 1% increase in vehicle arrival rate results in a decrease in traffic gap acceptance by 41.1%. A homoscedasticity test was also performed to ensure the normality of error in terms of the accepted gap parameter. Furthermore, the scatter plot was used to show a linear relationship between the logarithm of pedestrian gap acceptance with the selected 27 explanatory variables. The model was validated using 20% of the data which resulted in an R-square of 0.887 that indicated a very good fit.
As indicated above, the binary logit regression (BLR) model was used to describe pedestrians’ decision to cross a street. Both accepted and the largest of the rejected gaps were used in the development of the model. The merit of the developed BLR model was also checked using Hosmer - Lemeshow test where the Nagelkerke R Square value of 0.681 provided an indication of the amount of variation in the dependent variable explained by the model. In the formulated BLR model, the probability (P) of a pedestrian deciding to cross the road at mid-block locations is expressed as:
(5)
Where U = the utility function of choosing to cross the road at mid-block crosswalks; CRI = Pedestrian crossing initiation; PWP = pedestrian waiting place; WT = waiting time (sec.); VTL = vehicular travel lane; VD = Vehicular direction; VS = Vehicular speed (km/hr); VT = Vehicle type; Age = Age of pedestrian; Gap = time difference between following vehicles.
Further analysis resulted in a Pearson correlation of 0.582 which indicates the moderate capability of the model in predicting pedestrians’ decision to cross a street. Among others, pedestrians’ waiting place and time, vehicle type and speed, and age of pedestrians were the factors found significantly affecting pedestrian decision to accept the available gaps. Sensitivity analysis of the significant variables shows that pedestrians accept smaller gaps in front of small vehicles such as motorcycles, three-wheelers, and vehicles moving at lower speeds.
5. Conclusion
The study provided comprehensive results highlighting important variables related to pedestrians’, drivers’, roadway, and traffic characteristics that affect pedestrian road crossing behavior. The study revealed critical and 85
th percentile accepted gap sizes of 4.97 s and 7.2 s, respectively. Furthermore, the study indicated that zebra marked crossings in Bahir Dar city have no significant effect on gap acceptance. Pedestrian’s gap acceptance was, however, different at different sites in which the critical and the 85
th percentile accepted gaps for Zenbaba Pension and Kuchit Market Center sites were 4.8 and 4.4, and 6.5 and 6.4 s, respectively which are comparable to the values found in USA and India
| [5] | Brewer, M. A., Fitzpatrick, K., Whitacre, J. A., & Lord, D. Exploration of pedestrian gap-acceptance behavior at selected locations. Transportation Research Record, 2006, 1982(1), 132-140. https://doi.org/10.1177/0361198106198200117 |
| [13] | Pawar, D. S., & Patil, G. R. Pedestrian temporal and spatial gap acceptance at Mid-block Street crossing in developing world. Journal of Safety Research, 2015, 52, 39-46.
https://doi.org/10.1016/j.jsr.2014.12.006 |
[5, 13]
. These findings are substantially supported by recent research on uncontrolled urban crossings, which revealed that crucial gaps regularly stabilize between 4.0 and 5.5 seconds depending on oncoming vehicle velocity
| [15] | Shanko, S., Reddy, R., & Torban, J. Pedestrian Gap Acceptance Behavior at Un-Signalized Intersections under Mixed Traffic Conditions - A Case Study at Dukem City, Ethiopia. Journal of Road and Traffic Engineering, 2025, 71(3), 1-8.
https://doi.org/10.31075/PIS.71.03.01 |
| [18] | Fattah, M. A., Rahman, M. M., & Islam, M. S. Evaluating the Pedestrian Gap Acceptance and Risk Factors in Khulna City Unsignalized Intersections. Asian Transport Studies, 2025, 11(3), 89-102. https://doi.org/10.1016/j.ats.2025.100089 |
[15, 18]
. On the other hand, the critical and 85
th percentile accepted gaps at Martyr’s Memorial Monument and Habesha Guest House sites were 6.8 and 6.5, and 7.6 and 9.1 s, respectively, which are higher than those found in other studies. Among other site conditions, these high accepted gaps could be attributed to the high traffic speed (40 km/h) at these sites compared to the traffic speed at Zenbaba Pension (30 km/h) and Kuchit Market Center (24 km/h).
Both the MLR and BLR analyses indicated that multiple variables are significantly influencing pedestrians’ gap acceptance and crossing decision, respectively. In the ML regression analysis using the combined data, 14 explanatory variables out of the 27 considered were found significant with the model’s R square value of 0. 85. Pedestrian crossing speed, rolling behavior and platoon size, driver yielding behavior, and vehicular speed were among the variables found significant in the analysis. In the BL regression analysis using the combined data, 9 explanatory variables out of the 19 considered were found significant with the model’s R square value of 0.681. Age of pedestrian, waiting time, vehicle types, and vehicular speed were some of the variables found significant.
Abbreviations
BLR | Binary Logistic Regression |
CRI | Pedestrian Crossing Initiation Characteristic |
DYB | Driver Yield Behavior |
MLR | Multiple Linear Regression |
NOBC | Number of Observations of Incoming Vehicles Before Starting to Cross |
NODC | Number of Observations of Incoming Vehicles Before Starting to Cross |
PCS | Pedestrian Crossing Speed (m/s) |
PWP | Pedestrian Waiting Place |
Rbeh | Rolling Behavior of Crossing Pedestrians |
SM | Safety Margin (Seconds) |
SPSS | Statistical Package for the Social Sciences Software |
VAR | Vehicular Arrival Rate (vehicles Per Second) |
VD | Vehicular Direction |
VS | Vehicular Speed (km/h) |
VT | Vehicle Type Class |
VTL | Vehicular Travel Lane |
Acknowledgments
The authors greatly acknowledge Bahir Dar Institute of Technology, Bahir Dar University, and Debre Tabor University for providing the necessary support and guidance, and funding throughout the research, respectively.
Conflicts of Interest
The authors declare no conflicts of interest.
References
| [1] |
Gashaw, M. The effects of selected crash parameters and traffic volume on crash frequency: The case of Bahir Dar city. MSc Thesis, Addis Ababa University, Ethiopia, 2018.
|
| [2] |
Tulu, G. S. Pedestrian crashes in Ethiopia: Identification of contributing factors through modelling of exposure and road environment variables. PhD Thesis, Queensland University of Technology, Australia, 2015.
|
| [3] |
Alajnaf, I. O., Emhamed, K. M., & Almadani, M. M. Pedestrian Gap Acceptance and Crossing Decision Outside Crossing Facilities along Urban Streets in Malaysia: A Case Study of Rughaya Street, Batu Pahat, Johor, Malaysia. The International Journal of Engineering and Information Technology (IJEIT), 2016, 3(1), 18-22.
https://doi.org/10.36602/ijeit.v3i1.275
|
| [4] |
Kadali, B. R., & Vedagiri, P. Evaluation of pedestrian accepted vehicle gaps with varied roadway width under mixed traffic conditions. Transportation Letters, 2019, 11(9), 527-534.
https://doi.org/10.1080/19427867.2017.1408204
|
| [5] |
Brewer, M. A., Fitzpatrick, K., Whitacre, J. A., & Lord, D. Exploration of pedestrian gap-acceptance behavior at selected locations. Transportation Research Record, 2006, 1982(1), 132-140.
https://doi.org/10.1177/0361198106198200117
|
| [6] |
Serag, M. S. Modelling pedestrian road crossing at uncontrolled mid-block locations in developing countries. International Journal for Computational Civil and Structural Engineering, 2014, 4(3), 274-285.
|
| [7] |
Kadali, B. R., & Perumal, V. Critical gap analysis based on pedestrian behavior during peak-hour traffic at unprotected midblock crosswalks. Asian Transport Studies, 2016, 4(1), 261-277.
|
| [8] |
Kadali, B. R., Rathi, N., & Perumal, V. Evaluation of pedestrian mid-block road crossing behavior using an artificial neural network (ANN). 14th COTA International Conference of Transportation Professionals, 2014, 1911-1922.
https://doi.org/10.1061/9780784413654.184
|
| [9] |
Cherry, C., Donlon, B., Yan, X., Moore, S. E., & Xiong, J. Illegal mid-block pedestrian crossings in China: gap acceptance, conflict and crossing path analysis. International Journal of Injury Control and Safety Promotion, 2012, 19(4), 320-330.
https://doi.org/10.1080/17457300.2011.628751
|
| [10] |
Kadali, B. R., & Vedagiri, P. Modelling pedestrian road crossing behaviour under mixed traffic condition. European Transport, 2013, 55(3), 1-17.
|
| [11] |
Yannis, G., Papadimitriou, E., & Theofilatos, A. Pedestrian gap acceptance for mid-block street crossing. Transportation Planning and Technology, 2013, 36(5), 450-462.
https://doi.org/10.1080/03081060.2013.818272
|
| [12] |
Sun, D., Ukkusuri, S., Benekohal, R. F., & Waller, S. T. Modeling of motorist-pedestrian interaction at uncontrolled mid-block crosswalks. 82nd Annual Meeting of the Transportation Research Board, 2003, Washington, DC.
|
| [13] |
Pawar, D. S., & Patil, G. R. Pedestrian temporal and spatial gap acceptance at Mid-block Street crossing in developing world. Journal of Safety Research, 2015, 52, 39-46.
https://doi.org/10.1016/j.jsr.2014.12.006
|
| [14] |
Bishaw, T. W., Nurye, G., & Singh, R. Investigating factors of pedestrian safety using ordinal logistic regression in Addis Ababa City roads. Frontiers in Sustainable Cities, 2024, 6(1488387), 1-15.
https://doi.org/10.3389/frsc.2024.1488387
|
| [15] |
Shanko, S., Reddy, R., & Torban, J. Pedestrian Gap Acceptance Behavior at Un-Signalized Intersections under Mixed Traffic Conditions - A Case Study at Dukem City, Ethiopia. Journal of Road and Traffic Engineering, 2025, 71(3), 1-8.
https://doi.org/10.31075/PIS.71.03.01
|
| [16] |
Alver, Y., & Katanalp, S. Evaluating the Pedestrian Gap Acceptance in Semicontrolled Midblock Crosswalks with an Integrated AHP-FL Approach. Journal of Transportation Engineering, Part A: Systems, 2022, 148(9), 114-123.
https://doi.org/10.1061/JTEPBS.0000720
|
| [17] |
Kumari, S., Mukherjee, S., & Mitra, S. Pedestrian safety countermeasure performance assessment and predictive gap analysis in LMIC urban networks. Transportation Safety and Security, 2025, 17(2), 201-218.
https://doi.org/10.1016/j.jss.2024.102201
|
| [18] |
Fattah, M. A., Rahman, M. M., & Islam, M. S. Evaluating the Pedestrian Gap Acceptance and Risk Factors in Khulna City Unsignalized Intersections. Asian Transport Studies, 2025, 11(3), 89-102.
https://doi.org/10.1016/j.ats.2025.100089
|
Cite This Article
-
APA Style
Andargie, A. S., Bezabeh, G. B. (2026). Pedestrian Gap Acceptance Behavior at Road Mid-Block Crossings in Bahir Dar City. American Journal of Traffic and Transportation Engineering, 11(4), 75-81. https://doi.org/10.11648/j.ajtte.20261104.13
 Copy
|
Copy
|
 Download
ACS Style
Andargie, A. S.; Bezabeh, G. B. Pedestrian Gap Acceptance Behavior at Road Mid-Block Crossings in Bahir Dar City. Am. J. Traffic Transp. Eng. 2026, 11(4), 75-81. doi: 10.11648/j.ajtte.20261104.13
Copy
|
Download
AMA Style
Andargie AS, Bezabeh GB. Pedestrian Gap Acceptance Behavior at Road Mid-Block Crossings in Bahir Dar City. Am J Traffic Transp Eng. 2026;11(4):75-81. doi: 10.11648/j.ajtte.20261104.13
Copy
|
Download
-
@article{10.11648/j.ajtte.20261104.13,
  author = {Abebe Sewunet Andargie and Girma Berhanu Bezabeh},
  title = {Pedestrian Gap Acceptance Behavior at Road Mid-Block Crossings in Bahir Dar City},
  journal = {American Journal of Traffic and Transportation Engineering},
  volume = {11},
  number = {4},
  pages = {75-81},
  doi = {10.11648/j.ajtte.20261104.13},
  url = {https://doi.org/10.11648/j.ajtte.20261104.13},
  eprint = {https://article.sciencepublishinggroup.com/pdf/10.11648.j.ajtte.20261104.13},
  abstract = {Walking accounts for the dominant share over other modes of transport in Ethiopia. In the course of walking from place to place in built-up areas, pedestrians cross road-traffic streams that pose a risk of road crash fatalities and injuries. Pedestrian’s crossing behavior and the risk of pedestrian crashes vary with various factors including pedestrians’ physical and mental states, safety awareness, and socioeconomic characteristics as well as the adequacy of road crossing facilities. The aim of this research is to investigate and model the gap acceptance behavior of pedestrians at road mid-block crossings in Bahir Dar City. A field survey was carried out at four road mid-block pedestrian crossing locations on different streets of Bahir Dar city. Pedestrian crossings were videotaped in real traffic conditions and variables of pedestrian characteristics and their road crossing behaviors, vehicular and roadway characteristics were extracted using playback technique with AVS Video Editor Software and analyzed using SPSS-20. The statistical analysis of the combined data resulted in critical (50th percentile) and 85th percentile accepted gaps of 5.0 seconds and 7.2 seconds to cross at road mid-blocks, respectively. Multiple linear regression (MLR) and binary logistic regression (BLR) analyses showed pedestrian road crossing behavior as the main factor for both pedestrian gap acceptance and crossing decision compared to driver, roadway, and vehicular characteristics.},
 year = {2026}
}
Copy
|
Download
-
TY  - JOUR
T1  - Pedestrian Gap Acceptance Behavior at Road Mid-Block Crossings in Bahir Dar City
AU  - Abebe Sewunet Andargie
AU  - Girma Berhanu Bezabeh
Y1  - 2026/08/24
PY  - 2026
N1  - https://doi.org/10.11648/j.ajtte.20261104.13
DO  - 10.11648/j.ajtte.20261104.13
T2  - American Journal of Traffic and Transportation Engineering
JF  - American Journal of Traffic and Transportation Engineering
JO  - American Journal of Traffic and Transportation Engineering
SP  - 75
EP  - 81
PB  - Science Publishing Group
SN  - 2578-8604
UR  - https://doi.org/10.11648/j.ajtte.20261104.13
AB  - Walking accounts for the dominant share over other modes of transport in Ethiopia. In the course of walking from place to place in built-up areas, pedestrians cross road-traffic streams that pose a risk of road crash fatalities and injuries. Pedestrian’s crossing behavior and the risk of pedestrian crashes vary with various factors including pedestrians’ physical and mental states, safety awareness, and socioeconomic characteristics as well as the adequacy of road crossing facilities. The aim of this research is to investigate and model the gap acceptance behavior of pedestrians at road mid-block crossings in Bahir Dar City. A field survey was carried out at four road mid-block pedestrian crossing locations on different streets of Bahir Dar city. Pedestrian crossings were videotaped in real traffic conditions and variables of pedestrian characteristics and their road crossing behaviors, vehicular and roadway characteristics were extracted using playback technique with AVS Video Editor Software and analyzed using SPSS-20. The statistical analysis of the combined data resulted in critical (50th percentile) and 85th percentile accepted gaps of 5.0 seconds and 7.2 seconds to cross at road mid-blocks, respectively. Multiple linear regression (MLR) and binary logistic regression (BLR) analyses showed pedestrian road crossing behavior as the main factor for both pedestrian gap acceptance and crossing decision compared to driver, roadway, and vehicular characteristics.
VL  - 11
IS  - 4
ER  -
Copy
|
Download





 Share This Article
 Twitter
 Linked In
 Facebook