Research Article | | Peer-Reviewed

Impact of ENSO on Drought in Borena Zone, Ethiopia

Received: 4 December 2024     Accepted: 16 December 2024     Published: 31 December 2024
Views:       Downloads:
Abstract

Drought is one of the most frequent natural disasters in the world, droughts has a significantly negative impact on social, economic, and environmental situations. The goal is to assess and define the spatiotemporal analysis of meteorological droughts across ENSO (neutral, El Niño and La Niña) events and provided the guidance of the study area. CHIRPS data gathered from CHG-UCSB for spatial analysis and USGS FEWS NET for temporal analysis, respectively, for the time periods 1981 2020 and 1991–2020. For spatial and temporal analysis SPI was selected due to better for rainfall input over the study area, we employed Python tools and GeoCLIM data analysis methodologies. The findings of this study demonstrate that the Borana zone experienced an increase in droughts during the El Niño, La Niña, and neutral events between 1981 and 2020. The frequency and duration of the dryness were displayed in time steps across short-term drought indices. The extent, duration, and frequency of meteorological (deficit of precipitation) droughts varied, as shown by the time-scale temporal meteorological drought indices in the range of three to twelve months. For the remaining woredas of investigation between the SPI3 and SPI6, SPI6 and SPI12, and SPI9 and SPI12 indices, significantly an increase in the correlation values over short to long durations over the study area was the dominant factor in the meteorological drought severity of the correlation. It is also necessary to conduct additional research on how droughts spread, including the use of various drought indices to gauge the frequency, length, and intensity of droughts over time at the woreda, regional, and national levels. This study will help for different sectors, for knowledge’s and references to better manage irrigation, crop variety selection (drought tolerant seeds), soil conservation, crop production, and better awareness on meteorological droughts over study area.

Published in American Journal of Remote Sensing (Volume 12, Issue 2)
DOI 10.11648/j.ajrs.20241202.13
Page(s) 53-70
Creative Commons

This is an Open Access article, distributed under the terms of the Creative Commons Attribution 4.0 International License (http://creativecommons.org/licenses/by/4.0/), which permits unrestricted use, distribution and reproduction in any medium or format, provided the original work is properly cited.

Copyright

Copyright © The Author(s), 2024. Published by Science Publishing Group

Keywords

Spatial Analysis, Meteorological Drought, ENSO, SPI, Impact

1. Introduction
Natural disasters like droughts are mostly brought on by a worldwide natural decline in the amount of precipitation that is received over an extended period of time . In terms of their consequences on the environment, the economy, and society, droughts are among the worst natural disasters in the world . Droughts have a variety of negative repercussions on the environment, social sectors, and the economy globally . A drought is a persistent, abnormal lack of water supply . One of the most important problems that people around the world are currently facing is the drought phenomenon . claim that the severity of the drought is influenced by the size of the drought-affected area, the length of the drought, and the severity of the moisture shortage. According to M ahto and Mishra (2023), drought is a persistent climate phenomenon that is primarily defined by a sustained below-normal water supply and a drop in precipitation . Drought is a periodic climate phenomenon that affects most parts of the world with varying frequency, intensity, and duration . The World Meteorological Organization (WMO) created the SPI as the meteorological drought index to be used in drought evaluations at the national and regional levels . In past studies, it was found that SPI-3 was highly effective at depicting a dry era .
According to , Ethiopia endures climatic dryness and demonstrates spatiotemporal climate variability. Changes in atmospheric and oceanic circulation are frequently linked to the effects of recent droughts that have occurred in various regions of Ethiopia as well as the spatiotemporal evaluation of drought in that nation . Despite the fact that various studies have examined how climate change is related to Ethiopia's persistent droughts, The El Niño Southern Oscillation (ENSO) phenomenon has a substantial impact on the volume and distribution of Ethiopia's seasonal rainfall. The drought was a rather unanticipated result. The El Niño phenomenon, which happens roughly every three to five years, has significantly increased the severity and frequency of droughts across the country in recent years. However, Ethiopia's drought intensity, frequency, severity, and effects vary by location, with some places being more susceptible to drought than others. The impacts of drought are determined by the degree, length, frequency, and geographic location of the rainfall deficit. The spatial coverage identifies the extent to which a certain drought incidence affects a given area. Severe and strong drought periods often affect greater areas as opposed to mild and moderate drought occurrences, which frequently only affect isolated areas. Ethiopia is also affected by the drought's spread . When water supplies are limited, drought has a significant influence on agricultural output . Droughts can have a substantial impact on Ethiopia's crops because a large percentage of the nation's agriculture is dependent on rain-fed farming.
Drought has a severe impact on the Oromia region's Borana zone . The severity of the meteorological drought in Ethiopia's Rift Valley is distributed differently than elsewhere. According to several studies using standardized precipitation evapotranspiration indexes and standardized precipitation index drought indices , in order to explore the spread of drought in a semi-arid environment using the standardized hydrological cycle, other researchers employed the SGI and the SPI in the Bilate River catchment in the Rift Valley basin of Ethiopia . As the previous study demonstrated drought has extreme and exceptional drought events consequences over pastoral and agro-pastoral over study area. This study uses a standardized precipitation index to evaluate the spatiotemporal pattern of meteorological drought during ENSO (neutral, El Niño and La Niña) years over Borana zone.
This study is crucial to the subject since it will increase awareness of the issues and create a list of the issues that need to be resolved in order of importance. For ENSO (neutral, El Niño and La Niña) years over the research area, an analysis of the spatiotemporal meteorological drought will be performed, along with an evaluation of the spatiotemporal meteorological drought. Determining the precise meteorological drought indicators that affect the Borana zone is the purpose of this study, which aims to increase scientific understanding of drought. This study will help for different sectors, for knowledge’s, for pastoral and agro-pastoral, and references to better manage irrigation, drought tolerant seeds, soil conservation, for livestock management, and better awareness on meteorological droughts over study area.
2. Data and Methodology
2.1. Study Area
This study was conducted in the Borana zone, which is one of the 21 administrative zones of Oromia regional state, in southern Ethiopia. Borana zone is located in the southern part bordered by Kenya, in the north by the West Guji zone, in the east by the Guji zone and Somali region, and in the west by the South Nations and Nationalities Peoples’ Region (SNNPR). The study area is located from 3.51° N to 5.32° N latitude and 36.65° E to 39.75° N longitude. Yabelo is the capital town of the Borana zone and is located about 570 km from Addis Ababa. The zone covers almost 48,360 km2, of which more than 75% is lowland. The research area experiences four distinct seasons: Bega, which lasts from December to February, Belg, which lasts from March to May, Kiremt, which lasts from June to August, and Meher, which lasts from September to November. The zone's rainfall pattern is unique from that of most of the nation and is bi-modal. The majority of the rain that falls in the Borana zone occurs during the Belg ('Adolessa') and Kiremt ('Hagayya') seasons, and no rain during Bega ('Bona') season. 'Bona', 'Ganna', 'Adolessa', and 'Hagayya' are known as season names in the local community and correspond to Bega, Belg, Kiremt, and Meher at the national level, respectively . The Borana zone experiences two rainy seasons from March to May and September to October, with an average annual rainfall ranging from 350 mm to roughly 900 mm . As a result of the zone's very irregular rainfall patterns, several areas of Borana frequently experience drought conditions. According to , rainfall has a bimodal pattern of distribution with an increasing degree of unpredictability, necessitating adaptation and risk management. In the Borana zone, where the mean maximum and lowest temperatures are 24.6°C and 12.96°C, respectively, the mean annual temperature is roughly 19°C. In general, the warmest months of the year are typically March through May, while November through January sees the lowest annual minimum temperatures (National Meteorological Agency . A semi-arid savannah terrain dominates the area, with gently sloping lowlands and flood levels covered primarily with grass and bush land. According to , the geology is made up of sedimentary and volcanic deposits that are deposited on top of a crystalline basement. People work primarily in pastoral and agro-pastoral areas and engage in small-scale subsistence agriculture production.
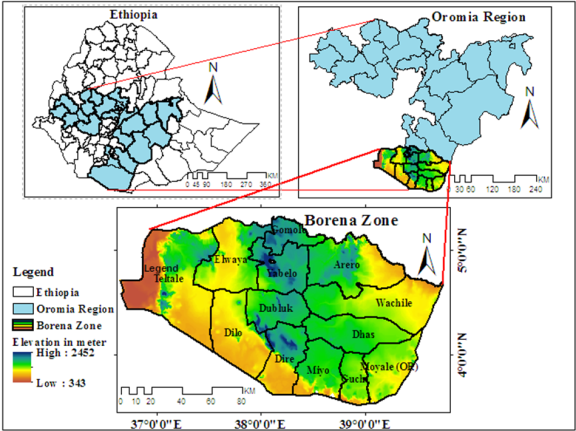
Figure 1. Study area of Borana zone with elevation in meter.
2.2. Data Sources
The satellite data products of Climate Hazards Group Infra-Red Precipitation with Stations (CHIRPS), a gridded rainfall estimate produced in near-real time with a spatial resolution of 0.05 degrees (0.05◦ × 0.05◦) or (~5 km) spatial resolution, a time series from 1981 to 2021. Source of data: https://data.chc.ucsb.edu/products/CHIRPS-2.0/ for spatial rainfall climatology and for SPI spatial analysis. In this study; the SPI monthly time series chirps-month data at a spatial resolution of 0.1 degree resolution similarly 10 km × 10 km considered for the period from 1991 to 2020 for temporal meteorological drought analysis across SPI3, SPI6, SPI9 and SPI12 indices; the source: https://earlywarning.usgs.gov/fews/ewx_lite/index.html over study area.
2.3. Data Analysis
We used the data analysis techniques of GeoCLIM, GIS, and Python tools for spatial and temporal analysis over the study area. The GeoCLIM program is part of a set of agro climate analysis products developed by the FEWS NET and the United States Geological Survey (USGS). In simple inverse distance weighting, the background grid also contributes a weight to the interpolation routine, and the relative weight of the background grid increases with increasing distance to surrounding stations. Python used for temporal meteorological drought analysis across SPI3, SPI6, SPI9 and SPI12 indices in time scale during the period of 1991-2020.
2.3.1. Calculation Formulas for Drought Quantification
In this study, standardized drought indices, such as the standardized precipitation index , were adopted to evaluate meteorological droughts. The drought index was used to analyze the spatiotemporal meteorological drought. Standardized precipitation index was simple to calculate, flexible on time scales, and widely used in meteorological drought monitoring and evaluation. The SPI3, SPI6, SPI9 and SPI12 indices were calculated by precipitation in the same time-scale of trend analysis on meteorological drought during the period of 1991–2020.
2.3.2. Standardized Precipitation Index (SPI)
A rainfall anomaly is presented as a normalized variable through the Standardized Precipitation Index, which communicates the probability significance of the measured or estimated rainfall . Probability distribution functions are fitted for each pixel for each accumulation period to determine the likelihood of occurrence. These probability distribution functions are used to historical data from datasets like CHIRPS which offers a 35-year time series for estimating gamma distribution parameters. The distribution's shape and an estimate of the variance are established by the CHIRPS data. Standardized Precipitation Index (SPI) to identify the onset of a drought over the Arsi zone, we employed the Standardized Precipitation Index . A tool for measuring precipitation shortfall at various time intervals, the SPI index can also be used to gauge the severity of a drought. The following equation was used to determine the SPI:
SPI= (Xij-Xim)/S(1)
Where, Xij= is the seasonal precipitation, Xim is its long-term seasonal mean and S is its standard deviation.
The frequency or probability density function of the gamma distribution describes it as follows:
gx =1βαгαxα-1e-x/β, for x>0 (2)
Wherex is the amount of precipitation, and αis the shape parameter, β is the scale parameter and гɑ=0xα-1eydy is the gamma function. For each station and each relevant time scale, the gamma probability density functions parameters and will estimate (3, 6, 9, 12 months). Estimates of the maximum likelihood for α and β are:
α=14A1+1+4A3, β=x̅α, whereA=lnx̅-lnxn (3)
the number of observations isn.
The cumulative probability of an observed precipitation event for the given month and time scale for the place in question is then determined using the derived parameters. Since a precipitation distribution may contain zeros and the gamma function is undefined for x=0, the cumulative probability is as follows:
Hx=q+1-qGX (4)
By integrating the first formula, which is the distribution function of precipitationG(x), we have the following expression:
Gx=0x1βαταxα-1e-x/βdx, x>0(5)
Where Gxthe cumulative probability of the incomplete gamma is function and q is the chance of no precipitation. If m is the total number of zeros in a time series of precipitation, then m/n can be used to calculate q. The standard normal random variable z, with mean zero and variance one is then transformed from the cumulative probability H(x) to provide the SPI. In Table 1 presents one interpretation of the outcome values .
Table 1. Categorization of drought severity based on SPI values.

No.

SPI Value

Drought Severity Class

1

2.0 and above

No drought

2

1.5 to 1.99

No drought

3

to 1.49

No drought

4

0.99 to -0.99

Slight drought

5

-1.0 to -1.99

Moderate drought

6

-1.5 to -1.99

Severe drought

7

-2.0 and less

Very severe drought

3. Results
The result of this research was a spatiotemporal analysis of drought weather patterns in ENSO years with time-scale linkage and the progression of the drought across SPI3, SPI6, SPI9 and SPI12 indices over the study area. The El Niño–Southern Oscillation, or ENSO, is the interannual fluctuation of the atmosphere–ocean system in the equatorial Pacific and it has three phases: warm (El Niño), cold (La Niña), and Neutral. Although El Niño is considered the warm phase of ENSO and La Niña the cold phase, they are not considered opposites because they occur with differing magnitudes, spatial extent, and duration. Impacts of ENSO stretch far beyond the region through interactions. A rainfall anomaly is presented as a normalized variable through the Standardized Precipitation Index, which communicates the probability significance of the measured or estimated rainfall . Drought of SPI3, SPI6, SPI9 and SPI12 indices represented as three, six, nine and twelve month timescales, respectively, in standardized precipitation index during the periods. For example, for a 3-month time scale, the monthly total rainfall of the month for which the SPI is to be evaluated and the last two months was averaged.
The spatiotemporal distribution of meteorological drought in ENSO years in time series revealed that, over the study zone, the means of drought indices varied from mild, moderate, severe, and extreme droughts between the years of 1981 and 2021. Over the study area, drought frequency, duration, and intensity are shown as time-based indicators. Generally speaking, the spatiotemporal analysis of meteorological droughts varied according to the severity of the drought, with the association between the time scales being notably strong on both short and long time scales. Spatiotemporal analysis of meteorological drought with drought severity strength impacted water availability, soil moisture, irrigation, and stream flow, reservoirs, pastorals, and agricultural productivity over the study area in time scales.
Seasonal and Annual Precipitation Climatology over Borana Zone
Borana zone known with Bio-modal rainfall distribution from February to May and from September to December were the main rainy seasons over study area. The magnitudes of seasonal Bega (October-January), Belg (February-May), and Kiremt (June-September) and annual (January-December) precipitation distribution throughout Borana zone was compared with ten-year intervals of 1981–1990, 1991–2000, 2001–2010, and 2011–2020 (Figure 2). Figures 2 (a) and (b) show the development of precipitation climatology for the Bega and Belg seasons over the research area from 1981 to 1990 (high rainfall amount over Belg season), 1991 to 2000, 2001 to 2010, and 2011 to 2021.
Rainfall in Ethiopia as well as Borana is distributed unevenly and varies greatly over time and space. There are variations in the seasonal and annual rainfall patterns. In certain research, seasonal and annual rainfall were found to be decreasing . However, according to some studies, there is an increase in annual rainfall . Other research revealed a pattern of rainfall that was both increasing and decreasing in many regions . However, some models show increases and some models show decreases in rainfall amounts . The majority of climate change models for Ethiopia, including the Borana zone, suggest minimal change or very slight increases in rainfall. The climatology of precipitation shows that a ten-year comparison shows variations in quantity and distribution from seasons to annuals in spatial coverage. In Figure 2, the distribution of spatial precipitation over the study area is indicated.
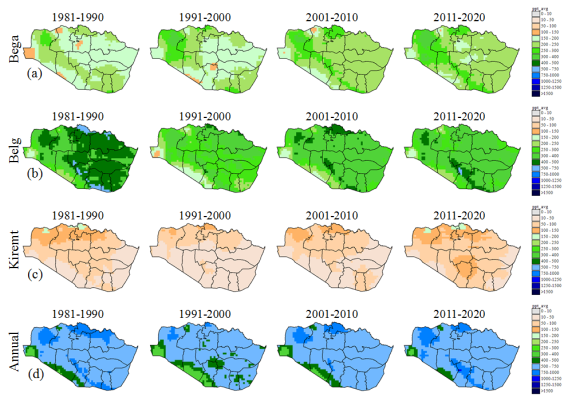
Figure 2. Seasonal (a) Bega (October-January), (b) Belg (February-May) and (c) Kiremt (June-September) and (d) annual (January-December) precipitation climatology of ten year intervals during 1981-1990, 1991-2000, 2001-2010 and 2011-2021 were compared with the magnitudes of their precipitation distribution over Borana zone.
Spatial Analysis of Meteorological Droughts on El Niño Years
Spatial analysis of meteorological droughts for El Niño years demonstrated weak El Niño in 2004, 2006, 2014, and 2018, moderate El Niño in 1986, 1994, 2002, and 2009, and strong El Niño events in 1982, 1987, 1991, 1997, and 2015 with SPI3, SPI6, SPI9 and SPI12 indices over the study area (Figures (3), (4), and (5)). The results show that meteorological droughts were indicated in spatial and area coverage with different magnitudes of drought severity on time scales. In this study, meteorological drought analysis shows a variation of drought severity in spatial and area coverage on a time scale over the zone. Meteorological droughts towards the El Niño years show an increment across weak (2004 and 2014), moderate (2009 only), and strong (1991 only) El Niño events over the Borana zone during the period of 1981–2021.
Weak El Niño Years
The result of the spatial meteorological drought of weak El Niño years 2004, 2006, 2014, and 2018 indicated mild, moderate, severe, and extreme drought in different woredas during the mentioned years. Standardized precipitation index (SPI3) shows that the drought severity indicated severe drought in south, southeast, east and west Borana zone, moderate to extreme drought during 2004. Standardized precipitation index (SPI6) drought indices showed in most parts of study area west, east, northeast, south, southeast and southwest indicated moderate, severe and extreme droughts (Figure 3). In long-term meteorological drought across SPI9 and SPI12, moderate, severe, extreme and exceptional drought conditions were indicated over west, south, southeast, east and northeast Borana zone during 2004 on time scales.
Meteorological drought analysis shows that in short- to long-term indices (SPI3, SPI6, SPI9 and SPI12), drought severity was indicated as mild, moderate to severe over north, central, and few parts of south and east Borana during 2014. In general, weak El Niño years demonstrated the meteorological drought frequency, duration, and intensity during 2004 and 2014 (exceptional drought extended over the zone) in spatial and area coverage (Figure 3). In 2006 and 2018, the meteorological drought severity indicated mild to wet drought and exceptional wet conditions in time scales over the study area.
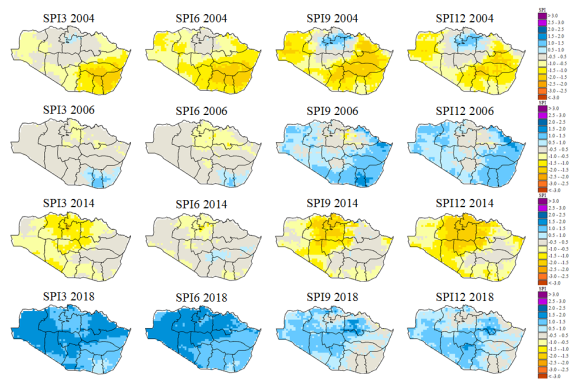
Figure 3. Weak El Niño years 2004, 2006, 2014 and 2018 across SPI3, SPI6, SPI9 and SPI12 indices during 1981-2021.
Moderate El Niño Years
Meteorological droughts in moderate El Niño years were 1986, 1994, 2002, and 2009 during the period 1991–2020. From these the drought severity in spatial and area coverage extended in drought duration and intensity from short-term to long-term drought events over most parts of Borana zone at west, south, southwest, and east parts during 2009 than other (Figure 4). Spatial meteorological drought analysis during 2009 shows that severe, extreme, and exceptional droughts indicated high drought conditions across the SPI3, SPI6, SPI9 and SPI12 indices (Figure 4). The remains drought years were mild to moderate drought events over few parts of study area in time scales during 1994 and 2002.
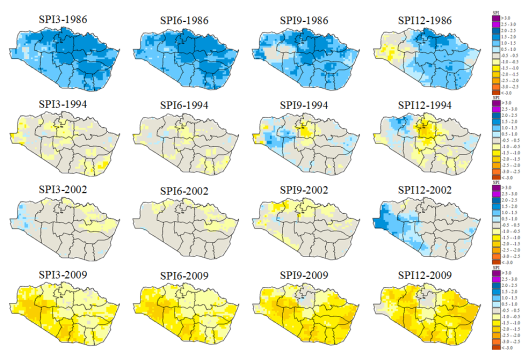
Figure 4. Moderate El Niño years 1986, 1994, 2002 and 2009 across SPI3, SPI6, SPI9 and SPI12 indices during 1981-2021.
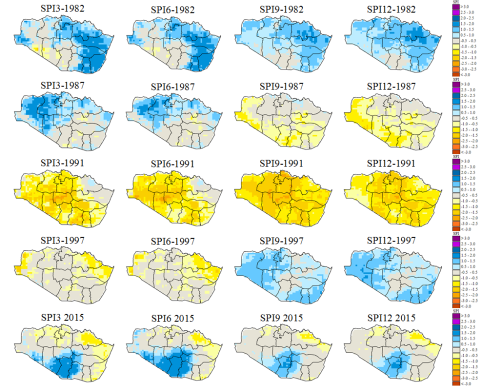
Figure 5. Strong El Niño years 1982, 1987, 1991, 1997 and 2015 across SPI3, SPI6, SPI9 and SPI12 indices during 1981-2021.
Strong El Niño Years
Meteorological drought spatial analysis towards strong El Niño years shows that severe to extreme and exceptional droughts were observed over most parts of Borana zone at north, south, west, east, and central parts across SPI3 to SPI12 in 1991. Drought severity in short-term drought at SPI3 shows that it was severe to extreme across north, south, west, southeast, and central over the study area. In 1991, meteorological droughts show that from mild to moderate droughts across SPI9 and SPI12 indices in time scales over few parts of west, south, central and few parts of southeast. Meteorological drought spatial analysis towards 1997 indicated mild to moderate drought at SPI3 and SPI6, during strong El Niño years (Figure 5). In general, strong El Niño year (1991 extreme and exceptional drought) demonstrated the meteorological drought frequency, duration, and intensity in spatial and area coverage across short time to long time scales.
Spatial Analysis of Meteorological Droughts on La Niña Years
Spatial analysis of meteorological droughts for La Niña years demonstrated weak La Niña in 1983, 1984, 2000, and 2017, moderate La Niña in 2011, and strong La Niña event in 1999 across SPI3 to SPI12 indices over the study area (Figures (6), (7), and (8)). The results show that meteorological droughts are indicated in spatial and area coverage with different magnitudes of drought severity on time scales. In this study, meteorological drought analysis shows a variation of drought severity in spatial and area coverage on a time scale over the zones. Meteorological droughts towards the La Niña years show an increment across weak (1983 and 2000), moderate (2011 across SPI3 and SPI6), and strong (1999 from SPI3, SPI6, SPI9 and SPI12) La Niña events over Borana zone during the period of 1981–2021.
The result of the spatial meteorological drought of weak La Niña years across 1983, 1984, 2000, and 2017 indicated mild, moderate, severe, and extreme drought in different woredas during the mentioned years. Meteorological drought analysis shows that in short- to long-term indices (SPI3, SPI6, SPI9 and SPI12), drought severity was indicated as severe, extreme and exceptional droughts over west, southwest, south, and east during 1983 and over north, west, south and southwest Borana during 2000 in time scales. The drought severity during 1984 and 2017 showed that from mild to moderate demonstrated in most parts of study area (Figure 6).
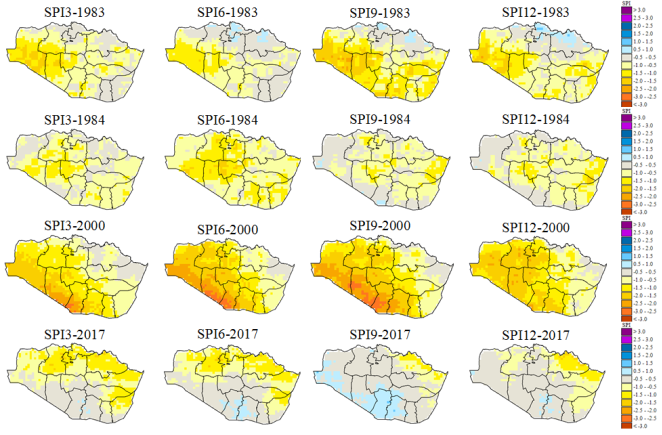
Figure 6. Weak La Niña years 1983, 1984, 2000 and 2017 across SPI3, SPI6, SPI9 and SPI12 indices during 1981-2021.
A meteorological drought in moderate La Niña year was 2011 across SPI3 and SPI6 during the period 1991–2020. The drought severity in spatial and area coverage extended in drought duration and intensity from SPI3 and SPI6 drought indices over most parts of Borana zone (Figure 4). Spatial meteorological drought analysis during 2011 shows that severe, extreme, and exceptional droughts indicated high drought conditions over north, east, central, south and southwest Borana across the SPI3 and SPI6 indices (Figure 7).
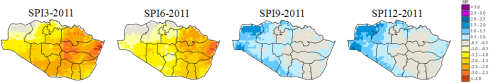
Figure 7. Moderate La Niña year 2011 across SPI3 to SPI16 indices during 1981-2021.
Meteorological drought spatial analysis towards strong La Niña years shows that severe to extreme and exceptional droughts were observed over most parts of Borana zone at north, east, some parts of south, southeast, west and few parts of central across SPI3 to SPI12 during1999. Drought severity in short-term drought at SPI3 shows that it was mild to moderate across north, south, southeast, east and central. Meteorological drought extended from SPI6 to SPI12 in spatial and area coverage with extreme and exceptional droughts in most parts of the zone during 1991 (Figure 8). In general, strong La Niña year (1999 extreme and exceptional drought) demonstrated the meteorological drought frequency, duration, and intensity in spatial and area coverage across short time to long time scales.
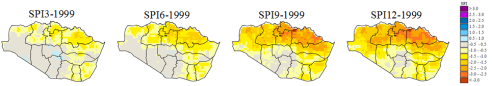
Figure 8. Strong La Niña year 1999 across SPI3, SPI6, SPI9 and SPI12 indices during 1981-2021.
Spatial Analysis of Meteorological Droughts on Neutral Years
The result of spatial analysis show that across SPI3, SPI6, SPI9 and SPI12 from mild, moderate, severe and extreme droughts over neutral years 1992, 1993 and 2019 in time scales. Meteorological drought in 1992 show that from severe, extreme and exceptional droughts over south, southeast, central, some parts of north and east across SPI3 to SPI12 in time scales. In 1993 meteorological drought indicated severe to extreme droughts over west, northwest and southwest of Borana zone and drought extended from SPI3 to SPI9 drought indices. Drought severity extended across SPI3 to SPI6 in most parts of north, northwest, east and south with severe to extreme drought in time scales during 2019 (Figure 9).
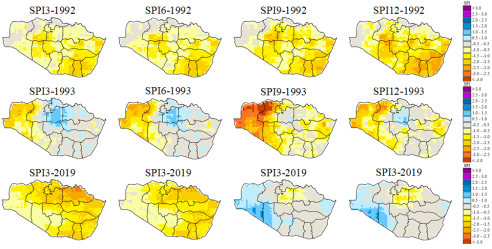
Figure 9. Neutral years 1992, 1993 and 2019 across SPI3, SPI6, SPI9 and SPI12 indices during 1981-2021.
Temporal Analysis of Meteorological Droughts over Borana Zone
The result of the analysis shows that the time scale of meteorological drought trends from short-term to long-term varied in frequency, duration, and intensity of drought severity. In Figure 10, below, the meteorological drought severity is seen in the short term of SPI3 to SPI6 indices and in the long term of SPI9 to SPI12 indices in time scales over the study area. Temporal meteorological droughts in time series show that over the study area, the means of drought indices values were from mild, moderate, severe, and extreme drought frequency during the period of 1991–2020. Temporal analysis shows that in Figure 10, for the initial three-month timescale of meteorological drought on SPI3 indices, the mean SPI3 was observed to have high frequency and drought intensity during the period of 1991–2020. Standard precipitation index (SPI6) analysis shows that in Figure 10 below, there is an extended and slight decrease in the frequency of meteorological drought over the study area. SPI9 and SPI12 trend analysis indicates less frequency and high drought intensity in time scale over the study area. The time-scale temporal meteorological drought indicated in the short term with the association of drought indices depends on the deficiency of precipitation over the zone. Drought severity extended in duration and frequency on SPI3, SPI6 indices compared to SPI9, SPI12 indices across time scales.
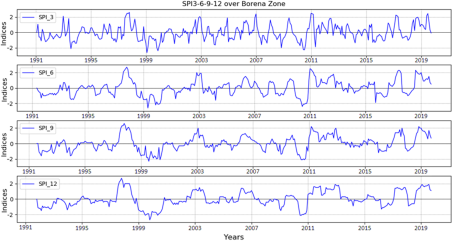
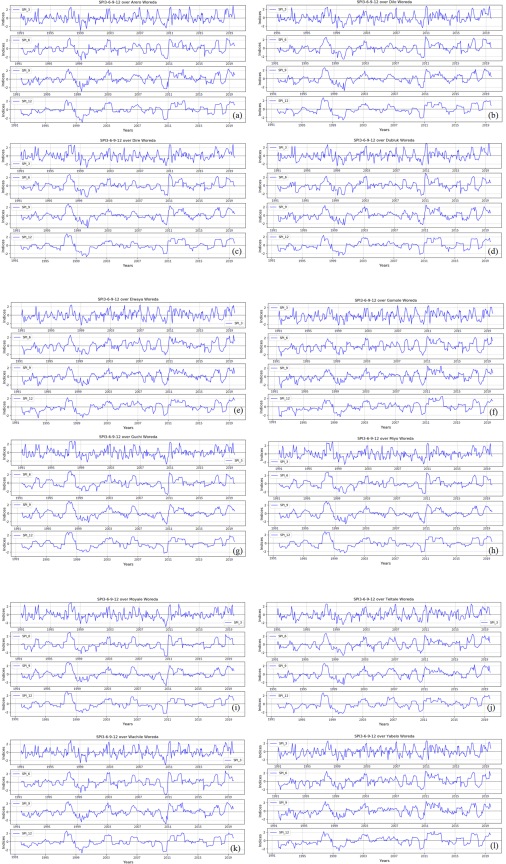
Figure 10. Temporal analysis of meteorological drought across SPI3, SPI6, SPI9 and SPI12 indices over Borana zone during the period of 1991-2020.
Based on three months (SPI3), it shows that in 1991, 1997, 1998, 2001, 2002, 2015, and 2016, there were moderate drought conditions; in 2004, 2008, and 2012, there was severe drought; in 1993, 1999, 2000, 2009, and 2011, there were extreme and exceptional drought over the study area. Meteorological drought across SPI6, SPI9 and SPI12 indices in time series analysis indicated extreme and exceptional droughts during 1999, 2000 and 2011 over the zone. The dryness was visualized with frequency and duration in time-scale across short-term drought indices in time steps. The time-scale temporal meteorological drought indices in three to twelve months (mean SPI3, SPI6, SPI9, SPI12) show that the drought indices varied in magnitude, duration, and frequency in meteorological (deficiency of precipitation) droughts during the period of 1991–2020 over the study area. From meteorological droughts, frequency was high with extended duration compared to the initial to last months of drought indices: moderate, severe, and extreme drought variables, which were considered in this study area. However, as the time scale increases, the shorter duration of meteorological droughts related to severity during 1991–2020 over Borana zone increased. In general, the temporal meteorological drought analysis showed significantly varied from short-term to long-term drought indices during 1991–2020 over the study area (Figure 10).
Temporal Analysis of Meteorological Droughts over Woredas
The resultant meteorological drought analysis trend shows that short-term to long-term drought across SPI3, SPI6, SPI9 to SPI12 indices, respectively, varied in frequency, duration, and drought intensity over Borana zone during 1991–2020. Meteorological drought analysis over selected zones, such as over (a) Arero, (b) Dilo, (c) Dire, (d) Dubluk, (e) Elwaya, (f) Gomole, (g) Guchi, (h) Miyo, (i) Moyale, (j) Teltale, (k) Wachile and (l) Yabelo woreda, in time series drought severity from mild, moderate, severe, and extreme droughts of trend analysis in drought severity across short term indicated a higher influence in frequency and intensity than long-term drought on time scales over the study area. Meteorological drought significantly negatively impacted short-term drought (SPI3) indices across the zones found in the woredas’ during the period of 1991–2020.
Temporal analysis of meteorological drought shows that over woredas found on the result the drought severity demonstrated as severe, extreme and exceptional droughts prevailed in time scales. In short-term drought (SPI3) indices, high drought frequency and drought intensity, which were significant drought influences on time scales, from time series analysis, the SPI6, SPI9, and SPI12 indices show that the drought frequency and intensity of drought significantly extend in time scales over selected woredas. Meteorological drought towards ENSO (El Niño and La Niña year’s) weak, moderate, and strong, and neutral events had an influence on drought severity in trend analysis. Meteorological droughts towards El Niño years show severe to extreme and exceptional droughts with magnitudes of drought severity demonstrated in 1991, 2004, 2009, and 2014 in time scales over mentioned woredas. Meteorological drought towards La Niña years indicated severe to extreme droughts with different magnitudes in 1983, 1984, 1999, 2000, 2011, and 2017 on time scales. In neutral years, meteorological drought severity shows those severe, extreme, and exceptional drought events with different magnitudes in 1992, 1993, and 2019 (at SPI3 and SPI6) over trend analyzed woredas (Figure 11). In general meteorological drought severity dominated over La Niña years than El Niño and Neutral years, which comparison in the drought strength of 6-drought years, 4-drought years and 3-drought years, respectively, prevailed in time scales.
The cross-correlation shows an increment in time steps between SPI3, SPI6, SPI9, and SPI12, with different magnitudes of cross-correlation in the study area. The highest correlation values were indicated between the SPI3 and SPI6 indices, with magnitudes of 0.6661, 0.7070, 0.6997, 0.6626, 0.7126, 0.6694, 0.7079, 0.7062, 0.7079, 0.7382, 0.6754 and 0.6631 over Arero, Dilo, Dire, Dubluk, Elwaya, Gomole, Guchi, Miyo, Moyale, Teltale, Wachile and Yabelo respectively. The values between SPI6 and SPI9 indices with the magnitudes indicated over Arero (0.7961), Dilo (0.8464), Dire (0.8510), Dubluk (0.7831), Elwaya (0.8192), Gomole (0.7783), Guchi (0.8625), Miyo (0.8623), Moyale (0.8499), Teltale (0.8494), Wachile (0.8177), and Yabelo (0.7792), in time scales. Similarly, the values between SPI9 and SPI12 indices analyzed over Arero, Dilo, Dire, Dubluk, Elwaya, Gomole, Guchi, Miyo, Moyale, Teltale, Wachile and Yabelo had magnitudes of 0.8403, 0.8909, 0.8939, 0.8369, 0.8504, 0.8094, 0.8999, 0.8994, 0.8919, 0.8865, 0.8644, and 0.8146, respectively, (Table 2). In general, the meteorological drought severity of correlation for the analysis shown in Table 2 between SPI3 and SPI6, SPI6 and SPI12, and SPI9 and SPI12 indices were dominated by an increment of the correlation values over short to long timescales over the study area.
Table 2. Cross-correlation values over woredas between the meteorological drought of the SPI3, SPI6, SPI9, and SPI12 indices.

Cross-correlation for Woredas

Arero

Dilo

Cross-correlation

SPI3

SPI6

SPI9

SPI12

SPI3

SPI6

SPI9

SPI12

SPI_3

1

1

SPI_6

0.6661

1

0.7070

1

SPI_9

0.5320

0.7961

1

0.6187

0.8464

1

SPI_12

0.4786

0.6855

0.8403

1

0.5463

0.7591

0.8909

1

Dire

Dubluk

Cross-correlation

SPI3

SPI6

SPI9

SPI12

SPI3

SPI6

SPI9

SPI12

SPI_3

1

1

SPI_6

0.6997

1

0.6626

1

SPI_9

0.6183

0.8510

1

0.5354

0.7831

1

SPI_12

0.5644

0.7663

0.8939

1

0.4480

0.6595

0.8369

1

Elwaya

Gomole

Cross-correlation

SPI3

SPI6

SPI9

SPI12

SPI3

SPI6

SPI9

SPI12

SPI_3

1

1

SPI_6

0.7126

1

0.6694

1

SPI_9

0.5792

0.8192

1

0.5059

0.7783

1

SPI_12

0.4859

0.7027

0.8504

1

0.4136

0.6372

0.8094

1

Guchi

Miyo

Cross-correlation

SPI3

SPI6

SPI9

SPI12

SPI3

SPI6

SPI9

SPI12

SPI_3

1

1

SPI_6

0.7079

1

0.7062

1

SPI_9

0.6239

0.8625

1

0.6236

0.8623

1

SPI_12

0.5838

0.7814

0.8999

1

0.5778

0.7779

0.8994

1

Moyale

Teltale

Cross-correlation

SPI3

SPI6

SPI9

SPI12

SPI3

SPI6

SPI9

SPI12

SPI_3

1

1

SPI_6

0.7079

1

0.7382

1

SPI_9

0.6058

0.8499

1

0.6374

0.8494

1

SPI_12

0.5731

0.7614

0.8919

1

0.5495

0.7599

0.8865

1

Wachile

Yabelo

Cross-correlation

SPI3

SPI6

SPI9

SPI12

SPI3

SPI6

SPI9

SPI12

SPI_3

1

1

SPI_6

0.6754

1

0.6631

1

SPI_9

0.5616

0.8177

1

0.5189

0.7792

1

SPI_12

0.5169

0.7231

0.8644

1

0.4195

0.6440

0.8146

1

4. Discussion
Based on the results of the analysis, we find that the intensity of the meteorological drought over the research area's historical periods has had a considerable negative impact on ENSO episodes. The research of the study on the drought's variability revealed considerable spatiotemporal shifts in the relationship between the spread of the drought and its effects on the Borana zone's various precipitation-dependent activities. The zone (woredas) that were more susceptible to drought was identified based on the strength of the link between SPI3, SPI6, SPI9, and SPI12 indices. In the transmission of drought sensitivity and its effects on the output of agricultural activities, crop variety selection, water balance, irrigation efficiency, pastoralists, and water productivity over the study area, the results revealed significant spatiotemporal meteorological drought diversity.
Ethiopia has experienced drought for a very long time, and due to climate change, droughts are occurring more frequently and covering more area . Major contributing causes are both the prolonged absence of precipitation and the increase in temperature . Precipitation in Ethiopia, particularly in the Borana, is significantly impacted by the ENSO (neutral, El Niño and La Niña) phenomenon and climate variability . The drought was an extremely unpredictable outcome. In arid and semi-arid areas, much research has been conducted to evaluate meteorological droughts .
The economic, social, and environmental aspect of the zone has all been impacted by droughts in various ways. Through a variety of channels, drought has an impact on cropping systems both directly and indirectly. Additionally, drought has an impact on livestock output in two ways: directly by increasing heat- and disease-related stress and mortality, and indirectly by affecting grassland productivity and, consequently, the quantity and quality of fodder. The notion that countries, woredas, economic sectors, and social groups differ in their degree of sensitivity to drought is a recurring issue in research on drought consequences and vulnerability. The effects of drought have a substantial influence on the Oromia region of Borana zone . These droughts resulted in famine, the deaths of humans and animals, and different social and political upheavals in the nation . Most of drought severe and extreme droughts recorded in Yabelo woreda of Borana zone. The high frequency and intensity of droughts in those places were primarily caused by irregular rainfall, high levels of land degradation, high populations, and a lack of irrigation agriculture . On temporal scales, the Borana zone is generally affected by the severity of meteorological droughts in terms of crop output, agricultural productivity, irrigation, pastoralist areas, vegetation, forests, animals, water availability, rivers, and lakes. The Oromia region, Borana zone is extremely susceptible to the effects of drought .
The seasonal and yearly droughts may be impacted by the ENSO phase. In other words, ENSO had an effect on precipitation and the complexities of the drought. In the result, the years mentioned in across neutral, El Niño and La Niña phases caused periods of drought. According to , the warm phase of ENSO has been the primary reason for the rain shortages throughout the northern and central areas of Ethiopia during the wet seasons. Many studies have been conducted to characterize the recurrent national and local-scale meteorological drought incidences in different parts of Ethiopia, including the Borana zone. These studies include . According to analyses of the effects of previous droughts in Ethiopia, including Borana zone, the driest years were 1984, 2002, and 2009 . Based on the result, the Borana zone is more susceptible to drought than others due there are geographical, geological, or anthropogenic factors contributing to this susceptibility drought severity.
Even though we made an effort to evaluate the meteorological drought severity in El Niño years in relation to the spread of drought on time scales of SPI3, SPI6, SPI9, and SPI12 indices throughout diverse study areas. Future efforts should also consider the variety of each research activity, as well as agricultural activities, crop variety selection, water balance, irrigation efficiency, pastoral, and agro-pastoral over the study area, in order to better understand the effects of the extreme meteorological droughts on each activity in the research area. Decision-makers can use information from drought monitoring and early warning systems to lessen the negative effects of the natural disaster on people and the environment. Since the vulnerability of agriculture and precipitation is dependent on the Borana zone, future research should examine new phenotypes capable of surviving severe meteorological droughts during ENSO episodes and deliver the research under diverse drought effects on agro-ecological situations. This study was a starting step in analyzing how meteorological drought spread and the possible implications of extreme meteorological droughts toward ENSO phase’s occurrences in the study area; however, more research into the socio-economic and long-term impacts of drought should be examined.
5. Conclusion
In this study, the meteorological droughts occurrence in frequency, duration, and intensity indicated a variation over the central, west, south, and east of Borana zone. Meteorological droughts from short-term to long-term drought indices severity strength and the cross-correlation between them demonstrated high time steps over the study area. In general, the meteorological drought severity of correlation for the remaining zones analysis between SPI3 and SPI6, SPI6 and SPI12, and SPI9 and SPI12 indices was dominated by an increment of the correlation values over short to long timescales over the study area. Drought severity were significantly negative impact on pastoral, agro-pastoral and water available over study area.
Weak El Niño years demonstrated the meteorological drought frequency, duration, and intensity during 2004 and 2014 (exceptional drought extended over the zone) in spatial and area coverage. Spatial meteorological drought analysis of moderate El Niño year during 2009 shows that severe, extreme, and exceptional droughts indicated high drought conditions across the SPI3, SPI6, SPI9 and SPI12 indices. Strong El Niño year 1991 show that extreme and exceptional drought demonstrated the meteorological drought frequency, duration, and intensity in spatial and area coverage across short time to long time scales.
Meteorological drought analysis of weak La Niña years shows that in short- to long-term indices (SPI3, SPI6, SPI9 and SPI12), drought severity was indicated as severe, extreme and exceptional droughts over west, southwest, south, and east during 1983 and over north, west, south and southwest Borana during 2000 in time scales. Spatial meteorological drought analysis moderate La Niña year during 2011 shows that severe, extreme, and exceptional droughts indicated high drought conditions over north, east, central, south and southwest Borana across the SPI3 and SPI6 indices. Strong La Niña year (1999 extreme and exceptional drought) demonstrated the meteorological drought frequency, duration, and intensity in spatial and area coverage across short time to long time scales.
Meteorological drought in neutral of 1992 show that from severe, extreme and exceptional droughts over south, southeast, central, some parts of north and east across SPI3, SPI6, SPI9 and SPI12 indices in time scales. In 1993 meteorological drought indicated severe to extreme droughts over west, northwest and southwest of Borana zone and drought extended from SPI3 to SPI9 drought indices. Drought severity extended across SPI3 to SPI6 in most parts of north, northwest, east and south with severe to extreme drought in time scales during 2019.
The time-scale temporal meteorological drought indices in three to twelve months (mean SPI3, SPI6, SPI9, and SPI12 indices) show that the drought indices varied in magnitude, duration, and frequency in meteorological droughts during the period of 1991–2020 over the study area. In general, the temporal meteorological drought analysis showed a significantly negative effect from short-term to long-term drought indices on pastoral and agro-pastoral during 1991–2020 over the study area.
Overall, in order to improve crop production, water availability, irrigation management, soil conservation, crop variety selection, and for pastoral and agro-pastoral; it is advised that farmers pay attention to weather and climatic information provided by meteorological forecasts, early warning, and agro-meteorology advisory services. As future research recommendations, it is also necessary to conduct additional research on how droughts spread, including the use of several drought indices to determine the frequency, length, and intensity of droughts over time at the woreda, regional, and national levels. Measuring specific conservation outcomes related to drought intensity is not nearly as critical as monitoring and evaluating the quality of partnerships. If the goal is to decrease the severity of the drought at the regional and zonal levels, then all relevant stakeholders must be involved in the collaborative process. Depending on the severity of the drought, it is critical that stakeholders have the chance to collaborate and create their own goals and agendas. It is advised to communicate with local people, various sectors, non-governmental organizations, or other stakeholders since this can offer a more comprehensive view of the problem, the severity of the drought, and potential solutions. Since this might offer a more comprehensive picture of the problem, including the severity of the drought and possible preparation. Besides, the study of drought conditions is instrumental in crop protection, as prolonged dry spells can amplify outbreaks of pests such as the desert locust and African armyworm, posing significant threats to agricultural productivity and food security.
Abbreviations

CHIRPS

Climate Hazards Group Infra-Red Precipitation with Stations

ENSO

El-Niño-Southern Oscillation

FEWS NET

Famine Early Warning Systems Network

SNNPR

South Nations and Nationalities Peoples’ Region

SPI

Standardized Precipitation Index

USGS

United State Geological Survey

Author Contributions
Authors conceived of the presented idea, developed the theory, editing, analysis, interpretations, and performed the computations.
Funding
The authors received no financial support for the research, authorship, and/or publication of this article.
Availability of Data and Materials
The data is available as request.
Conflicts of Interest
The authors declare no conflicts of interest.
References
[1] Gebrechorkos, S. H., Peng, J., Dyer, E., Miralles, D. G., Vicente-Serrano, S. M., Funk, C., Beck, H. E., Asfaw, D. T., Singer, M. B., & Dadson, S. J. (2023). Global High-Resolution Drought Indices for 1981–2022. Earth System Science Data Discussions, 2023, 1–28.
[2] Sanogo, A., Owusu, P. A., Kabange, R. S., Djire, B. I., Donkoh, R. F., & Dia, N. (2023). Meteorological Drought Detection and Forecast Using Standardized Precipitation Index and Univariate Distribution Models: Case Study of Bamako, Mali. Journal of Geoscience and Environment Protection, 11(7), 30–55.
[3] Omar, A. A., Chiang, J.-L., & Daud, B. H. (2023). Spatiotemporal Analysis of Meteorological Drought Using Standardized Precipitation Index (SPI) in Gabiley Region, Somaliland. Journal of Geoscience and Environment Protection, 11(5), 47–59.
[4] Sharma, A. P. M., Jhajharia, D., Yurembam, G. S., Gupta, S., Patle, G. T., & Chanu, T. L. (2023). Spatiotemporal Analysis of Meteorological Drought in Tripura. In Integrated Drought Management, Volume 2 (pp. 57–70). CRC Press.
[5] Serrano, S. M. V., El Kenawy, A., Zabalza-Martínez, J., Noguera, I., Peña-Angulo, D., Juez, C., Franquesa, M., Fernández-Duque, B., Domínguez-Castro, F., & Eklundh, L. (2023). Influence of the interannual variability of meteorological drought on the cross-interactions of ecological and hydrological drought in the central Spanish Pyrenees. GeoFocus. International Review of Geographical Information Science and Technology, 31, 55–85.
[6] Tp, H. (2023). Economic impact of drought on agrarian society: The case study of a village in Maharashtra, India. International Journal of Disaster Risk Reduction, 103912.
[7] Nazneen, S., Ayaz, T., Durrani, Y., Ali, N., Habib, M., & Yousaf, S. (2023). Meteorological Drought Measurement with Deficit in Rainfall Occurrence According to SPI Indices: a case Study of Peshawar, Pakistan. Arid Ecosystems, 13(1), 20–28.
[8] Pandey, V., Pandey, P. K., & Lalrammawii, H. P. (2023). Characterization and return period analysis of meteorological drought under the humid subtropical climate of Manipur, northeast India. Natural Hazards Research.
[9] Yu, H., Wang, L., Zhang, J., & Chen, Y. (2023). A global drought-aridity index: The spatiotemporal standardized precipitation evapotranspiration index. Ecological Indicators, 153, 110484.
[10] Zhang, M., Yang, X., Pan, M., Zhang, L., Fang, X., & Sheffield, J. (2023). Spatio-temporal characteristics and driving factors of the meteorological drought across China based on CMIP6. Hydrology Research, 54(3), 382–400.
[11] Thi, N. Q., Govind, A., Le, M.-H., Linh, N. T., Anh, T. T. M., Hai, N. K., & Ha, T. V. (2023). Spatiotemporal characterization of droughts and vegetation response in Northwest Africa from 1981 to 2020. The Egyptian Journal of Remote Sensing and Space Science, 26(3), 393–401.
[12] Mahto, S. S., & Mishra, V. (2023). Increasing risk of simultaneous occurrence of flash drought in major global croplands. Environmental Research Letters, 18(4), 44044.
[13] LIANG, J., HU, Z., & XIE, Z. (2023). Exogenous melatonin alleviates the physiological effects of drought stress in sweet sorghum seedlings. Acta Prataculturae Sinica, 32(7), 206.
[14] Abi Wijaya Angga Prahatma, W. P. (2023). Drought Analysis Using Standardized Precipitation Index (SPI) Based on Representative Concentration Pathways (RCPs) in Bantul and Gunung Kidul Regencies, DI Yogyakarta. Proceedings of the 3rd International Conference on Smart and Innovative Agriculture (ICoSIA 2022), 29, 424.
[15] Angon, P. B., Mondal, S., Akter, S., Sakil, M. A., & Jalil, M. A. (2023). Roles of CRISPR to mitigate drought and salinity stresses on plants. Plant Stress, 100169.
[16] Bhukya, S., Tiwari, M. K., & Patel, G. R. (2023). Assessment of Spatiotemporal Variation of Agricultural and Meteorological Drought in Gujarat (India) Using Remote Sensing and GIS. Journal of the Indian Society of Remote Sensing, 1–18.
[17] Cárdenas, O. L. (2023). Predictive association between meteorological drought and climate indices in the state of Sinaloa, northwestern Mexico. Arabian Journal of Geosciences, 16(1), 79.
[18] Elbeltagi, A., Pande, C. B., Kumar, M., Tolche, A. D., Singh, S. K., Kumar, A., & Vishwakarma, D. K. (2023). Prediction of meteorological drought and standardized precipitation index based on the random forest (RF), random tree (RT), and Gaussian process regression (GPR) models. Environmental Science and Pollution Research, 30(15), 43183–43202.
[19] Eze, E., Girma, A., Zenebe, A., Okolo, C. C., Kourouma, J. M., & Negash, E. (2022). Predictors of drought-induced crop yield/losses in two agroecologies of southern Tigray, Northern Ethiopia. Scientific Reports, 12(1), 1–14.
[20] Kourouma, J. M., Eze, E., Kelem, G., Negash, E., Phiri, D., Vinya, R., Girma, A., & Zenebe, A. (2022). Spatiotemporal climate variability and meteorological drought characterization in Ethiopia. Geomatics, Natural Hazards and Risk, 13(1), 2049–2085.
[21] Liou, Y.-A., & Mulualem, G. M. (2019). Spatio–temporal assessment of drought in Ethiopia and the impact of recent intense droughts. Remote Sensing, 11(15), 1828.
[22] Degefu, M. A., Rowell, D. P., & Bewket, W. (2017). Teleconnections between Ethiopian rainfall variability and global SSTs: observations and methods for model evaluation. Meteorology and Atmospheric Physics, 129, 173–186.
[23] Funk, C., Michaelsen, J., & Marshall, M. T. (2012). Mapping recent decadal climate variations in precipitation and temperature across eastern Africa. Remote Sensing of Drought: Innovative Monitoring Approaches, 331(7), 331–355.
[24] Zeleke, T. T., Giorgi, F., Diro, G. T., & Zaitchik, B. F. (2017). Trend and periodicity of drought over Ethiopia. International Journal of Climatology, 37(13), 4733–4748.
[25] Huang, S., Zhang, X., Chen, N., Li, B., Ma, H., Xu, L., Li, R., & Niyogi, D. (2021). Drought propagation modification after the construction of the Three Gorges Dam in the Yangtze River Basin. Journal of Hydrology, 603, 127138.
[26] Wossenyeleh, B. K., Kasa, A. S., Verbeiren, B., & Huysmans, M. (2022). Drought propagation in the hydrological cycle in a semiarid region: a case study in the Bilate catchment, Ethiopia. Hydrogeology Journal, 30(3), 751–766.
[27] Shiru, M. S., Shahid, S., Dewan, A., Chung, E.-S., Alias, N., Ahmed, K., & Hassan, Q. K. (2020). Projection of meteorological droughts in Nigeria during growing seasons under climate change scenarios. Scientific Reports, 10(1), 1–18.
[28] Dufera, J. A., Yate, T. A., & Kenea, T. T. (2023). Spatiotemporal analysis of drought in Oromia regional state of Ethiopia over the period 1989 to 2019. Natural Hazards, 1–41.
[29] Hailesilassie, W. T., Ayenew, T., & Tekleab, S. (2023). A comparative study of drought characteristics using meteorological drought indices over the central main Ethiopian Rift. Hydrology Research, 54(3), 313–329.
[30] Kebede, A., Kang, M. S., & Bekele, E. (2019). Advances in mechanisms of drought tolerance in crops, with emphasis on barley. Advances in Agronomy, 156, 265–314.
[31] Moloro, T. L. (2018). Spatio-temporal analysis of rainfall variability and meteorological drought: a case study in Bilate River Basin, Southern Rift Valley, Ethiopia. International Journal of Environmental Sciences & Natural Resources, 14(4), 76–89.
[32] Nasir, J., Assefa, E., Zeleke, T., & Gidey, E. (2021). Meteorological Drought in Northwestern Escarpment of Ethiopian Rift Valley: detection seasonal and spatial trends. Environmental Systems Research, 10, 1–20.
[33] Riché B, Hachileka E, Awuor CB, Hammill A (2009) Climate-related vulnerability and adaptive-capacity in Ethiopia’s Borana and Somali communities. International Institute for Sustainable Development (IISD) report.
[34] Debela N, McNeil D, Bridle K, Mohammed C (2019) Adaptation to climate change in the pastoral and agro pastoral systems of Borana, South Ethiopia: options and barriers. Am J Clim Chang 8: 40–60.
[35] Korecha D, Barnston AG (2007) Predictability of June to September rainfall in Ethiopia. J Am Meteorol Soc. https://doi.org/10.1175/MWR33 04.1
[36] NMA (2007) Initial National Communication of Ethiopia to the United Nations Framework Convention on Climate Change (UNFCCC). National Meteorological Agency, Addis Ababa, Ethiopia.
[37] Gemedo-Dalle MBL, Isselstein J (2006) Rangeland condition and trend in the semiarid Borana lowlands, southern Oromia, Ethiopia. Afr J Range Forage Sci 23: 49–58.
[38] Lasage R, Seifu A, Hoogland M, de Vries A (2010) Report on general characteristics of the Borana zone, Ethiopia. IVM Institute for Environmental Studies. VU University, Amsterdam.
[39] McKee, T. B., Doesken, N. J., & Kleist, J. (1993). The relationship of drought frequency and duration to time scales. Proceedings of the 8th Conference on Applied Climatology, 17(22), 179–183.
[40] Gao, F., Zhang, Y., Ren, X., Yao, Y., Hao, Z., & Cai, W. (2018). Evaluation of CHIRPS and its application for drought monitoring over the Haihe River Basin, China. Natural Hazards, 92, 155–172.
[41] Shen, Z., Yong, B., Gourley, J. J., Qi, W., Lu, D., Liu, J., Ren, L., Hong, Y., & Zhang, J. (2020). Recent global performance of the Climate Hazards group Infrared Precipitation (CHIRP) with Stations (CHIRPS). Journal of Hydrology, 591, 125284.
[42] Abramowitz, M., & Stegun, I. A. (1965). Handbook of mathematical functions Dover Publications. New York, 361.
[43] Tsakiris, G., & Vangelis, H. (2004). Towards a drought watch system based on spatial SPI. Water Resources Management, 18, 1–12.
[44] Asfaw, A., Simane, B., Hassen, A., & Bantider, A. (2018). Variability and time series trend analysis of rainfall and temperature in northcentral Ethiopia: A case study in Woleka sub-basin. Weather and Climate Extremes, 19, 29–41.
[45] Hill, R. V., & Porter, C. (2017). Vulnerability to drought and food price shocks: evidence from Ethiopia. World Development, 96, 65–77.
[46] Gemeda, D. O. (2019). Climate change variability analysis in and around Jinka, southern Ethiopia. With special emphasis on temperature and rainfall.
[47] Hundera, H., Mpandeli, S., & Bantider, A. (2019). Smallholder farmers’ awareness and perceptions of climate change in Adama district, central rift valley of Ethiopia. Weather and Climate Extremes, 26, 100230.
[48] Tesfamariam B, Gessese B, Melgani F (2019) Characterizing the spatiotemporal distribution of meteorological drought as a response to climate variability: the case of rift valley lakes basin of Ethiopia. Weather Climate Extremes 26: 100237.
[49] Wedajo, G. K., Muleta, M. K., Gessesse, B., & Koriche, S. A. (2019). Spatiotemporal climate and vegetation greenness changes and their nexus for Dhidhessa River Basin, Ethiopia. Environmental Systems Research, 8, 1–24.
[50] Cheung, W. H., Senay, G. B., & Singh, A. (2008). Trends and spatial distribution of annual and seasonal rainfall in Ethiopia. International Journal of Climatology: A Journal of the Royal Meteorological Society, 28(13), 1723–1734.
[51] Degefie, D. T., Seid, J., Gessesse, B., & Bedada, T. B. (2019). Agricultural drought projection in Ethiopia from 1981 to 2050: Using coordinated regional climate downscaling experiment climate data for Africa. In Extreme hydrology and climate variability (pp. 311–323). Elsevier.
[52] Eshetu, G., Johansson, T. P., Garedew, W., & Yisahak, T. (2018). Climate variability and small-scale farmer adaptation strategy in setema-Gatira area of Jimmaa, southwestern Ethiopia. American Journal of Biological and Environmental Statistics.
[53] Gebrechorkos, S. H., Hülsmann, S., & Bernhofer, C. (2019). Long-term trends in rainfall and temperature using high-resolution climate datasets in East Africa. Scientific Reports, 9(1), 11376.
[54] Omondi, P. A., Awange, J. L., Forootan, E., Ogallo, L. A., Barakiza, R., Girmaw, G. B., Fesseha, I., Kululetera, V., Kilembe, C., & Mbati, M. M. (2014). Changes in temperature and precipitation extremes over the Greater Horn of Africa region from 1961 to 2010. International Journal of Climatology, 34(4), 1262–1277.
[55] Assefa, D., & Mengistu, M. (2021). Time Series Trend and Variability Analysis of Temperature and Rainfall in West Shewa Zone of Oromia, Ethiopia.
[56] Fazzini, M., Bisci, C., & Billi, P. (2015). The climate of Ethiopia. Landscapes and Landforms of Ethiopia, 65–87.
[57] Ofgeha, G. Y., & Abshire, M. W. (2021). Spatio-temporal variability and trends in rainfall and temperature in anger watershed, Southwestern ethiopia. Journal of Applied Geospatial Information, 5(1), 462–472.
[58] Regassa, S., Givey, C., & Castillo, G. (2010). The rain doesn’t come on time anymore: Poverty, vulnerability, and climate variability in Ethiopia.
[59] Addaney, M., Jarbandhan, D. B., & Dumenu, W. K. (2023). Climate Change in Africa: Adaptation, Resilience, and Policy Innovations. Springer Nature.
[60] Burka, A., Biazin, B., & Bewket, W. (2023). Drought characterization using different indices, theory of run and trend analysis in bilate river watershed, rift valley of Ethiopia. Frontiers in Environmental Science, 11, 1098113.
[61] Mekonnen, E. N., Liou, Y.-A., Damene, S., Gebremariam, E., & Mulualem, G. M. (2023). Geospatial-based climate variability analysis, in Central Ethiopia Rift Valley. Theoretical and Applied Climatology, 152(1–2), 151–165.
[62] Jimma, T. B., Demissie, T., Diro, G. T., Ture, K., Terefe, T., & Solomon, D. (2023). Spatiotemporal variability of soil moisture over Ethiopia and its teleconnections with remote and local drivers. Theoretical and Applied Climatology, 151(3–4), 1911–1929.
[63] Marelign, A., & Gashu, G. (2023). analysis of Observed and Perceived climate change and Variability in gondar Zuria Woreda, northwestern ethiopia. Ethiopian Renaissance Journal of Social Sciences and the Humanities, 10(1), 61–80.
[64] Shiferaw, H., Girma, A., Hadush, K., Mariam, H. G., Yazew, E., & Zenebe, A. (2023). Long-term hydroclimatic variability over the semi-arid Ethiopian highlands in relation to ENSO and IOD teleconnection signals. Theoretical and Applied Climatology, 1–19.
[65] Tamene, H., Ayal, D. Y., Zeleke, T. T., & Ture, K. (2023). Determinants of the choice of adaptation strategies to climate variability and extremes among pastoralist and agro-pastoralist households in Yabello and Arero Districts, Southeast Ethiopia. Climate Services, 30, 100381.
[66] Tofu, D. A., & Mengistu, M. (2023). Observed time series trend analysis of climate variability and smallholder adoption of new agricultural technologies in west Shewa, Ethiopia. Scientific African, 19, e01448.
[67] Aktürk, G., Çıtakoğlu, H., & Demir, V. (2023). Regional Frequency Analysis of Drought Indexes by L-Moments Method.
[68] KARTAL, V. (2023). Drought Assessment of Siirt using SPI and SPEI. International Conference on Recent Academic Studies, 1(1), 11–17.
[69] Muse, N. M., Tayfur, G., & Safari, M. J. S. (2023). Meteorological Drought Assessment and Trend Analysis in Puntland Region of Somalia. Sustainability, 15(13), 10652.
[70] Wubneh, M. A., Alemu, M. G., Fekadie, F. T., Worku, T. A., Demamu, M. T., & Aman, T. F. (2023). Meteorological and hydrological drought monitoring and trend analysis for selected gauged watersheds in the Lake Tana basin, Ethiopia: Under future climate change impact scenario. Scientific African, 20, e01738.
[71] Sara P, Wekesa M (2008) Improving drought response in pastoral areas of Ethiopia Somali and Afar Regions and Borana Zone of Oromiya Region. Humanitarian Policy Group.
[72] Birhanu Z, Ambelu A, Berhanu N, Tesfaye A, Woldemichael K (2017) Understanding resilience dimensions and adaptive strategies to the impact of recurrent droughts in Borana Zone, Oromia Region, Ethiopia: a grounded theory approach. Int J Environ Res Public Health 14: 118. https://doi.org/10.3390/ijerp h1402 0118
[73] Getahun, Y. S., & Li, M.-H. (2023). Flash drought evaluation using evaporative stress and evaporative demand drought indices: a case study from Awash River Basin (ARB), Ethiopia. Theoretical and Applied Climatology, 1–20.
[74] Lambe, B. T., & Kundapura, S. (2023). Recent Changes in Hydrometeorological Extremes in the Bilate River Basin of Rift Valley, Ethiopia. Journal of Hydrologic Engineering, 28(7), 5023014.
[75] Edossa DC, Babel MS, Gupta AD (2010) Drought analysis in the Awash river basin Ethiopia. Water Resour Manag. 24: 1441–1460.
[76] Gebrehiwot T, van der Veena A, Maathuis B (2011) Spatial and temporal assessment of drought in the Northern highlands of Ethiopia. Int J Appl Earth Obs Geoinf. 13: 309–321
[77] Viste E, Korecha D, Sorteberg A (2013) Recent drought and precipitation tendencies in Ethiopia. Theor Appl Climatol 112: 535–551. https://doi.org/10.1 007/s00704-012-0746-3
[78] Degefu MA, Bewket W (2014) Trends and spatial patterns of drought incidence in the omo ghibe river basin, Ethiopia. Geografiska Annaler A Phys Geogr.
[79] Gizachew, Shimelis (2014) Analysis and mapping of climate change risk and vulnerability in central rift valley of Ethiopia. Afr Crop Sci J 22(Issue Supplement s4): 807–818.
[80] Muluneh A, Biazin B, Stroosnijder L, Bewket W, Keesstra S (2014) Impact of predicted changes in precipitation and atmospheric carbondioxide on maize and wheat yields in the central rift Valleyof Ethiopia. Reg Environ Chang 15(6): 1105–1119.
[81] Mohammed Y, Yimer F, Tadesse M, Tesfaye K (2017) Meteorological drought assessment in north east highlands of Ethiopia. Int J Climate Change Strateg Manage 10(1): 142–160.
Cite This Article
  • APA Style

    Tullu, G. M., Habtegebriel, A. K., Agboka, K. M. (2024). Impact of ENSO on Drought in Borena Zone, Ethiopia. American Journal of Remote Sensing, 12(2), 53-70. https://doi.org/10.11648/j.ajrs.20241202.13

    Copy | Download

    ACS Style

    Tullu, G. M.; Habtegebriel, A. K.; Agboka, K. M. Impact of ENSO on Drought in Borena Zone, Ethiopia. Am. J. Remote Sens. 2024, 12(2), 53-70. doi: 10.11648/j.ajrs.20241202.13

    Copy | Download

    AMA Style

    Tullu GM, Habtegebriel AK, Agboka KM. Impact of ENSO on Drought in Borena Zone, Ethiopia. Am J Remote Sens. 2024;12(2):53-70. doi: 10.11648/j.ajrs.20241202.13

    Copy | Download

  • @article{10.11648/j.ajrs.20241202.13,
      author = {Gezahegn Mergia Tullu and Abebe Kebede Habtegebriel and Komi Mensah Agboka},
      title = {Impact of ENSO on Drought in Borena Zone, Ethiopia
    },
      journal = {American Journal of Remote Sensing},
      volume = {12},
      number = {2},
      pages = {53-70},
      doi = {10.11648/j.ajrs.20241202.13},
      url = {https://doi.org/10.11648/j.ajrs.20241202.13},
      eprint = {https://article.sciencepublishinggroup.com/pdf/10.11648.j.ajrs.20241202.13},
      abstract = {Drought is one of the most frequent natural disasters in the world, droughts has a significantly negative impact on social, economic, and environmental situations. The goal is to assess and define the spatiotemporal analysis of meteorological droughts across ENSO (neutral, El Niño and La Niña) events and provided the guidance of the study area. CHIRPS data gathered from CHG-UCSB for spatial analysis and USGS FEWS NET for temporal analysis, respectively, for the time periods 1981 2020 and 1991–2020. For spatial and temporal analysis SPI was selected due to better for rainfall input over the study area, we employed Python tools and GeoCLIM data analysis methodologies. The findings of this study demonstrate that the Borana zone experienced an increase in droughts during the El Niño, La Niña, and neutral events between 1981 and 2020. The frequency and duration of the dryness were displayed in time steps across short-term drought indices. The extent, duration, and frequency of meteorological (deficit of precipitation) droughts varied, as shown by the time-scale temporal meteorological drought indices in the range of three to twelve months. For the remaining woredas of investigation between the SPI3 and SPI6, SPI6 and SPI12, and SPI9 and SPI12 indices, significantly an increase in the correlation values over short to long durations over the study area was the dominant factor in the meteorological drought severity of the correlation. It is also necessary to conduct additional research on how droughts spread, including the use of various drought indices to gauge the frequency, length, and intensity of droughts over time at the woreda, regional, and national levels. This study will help for different sectors, for knowledge’s and references to better manage irrigation, crop variety selection (drought tolerant seeds), soil conservation, crop production, and better awareness on meteorological droughts over study area.
    },
     year = {2024}
    }
    

    Copy | Download

  • TY  - JOUR
    T1  - Impact of ENSO on Drought in Borena Zone, Ethiopia
    
    AU  - Gezahegn Mergia Tullu
    AU  - Abebe Kebede Habtegebriel
    AU  - Komi Mensah Agboka
    Y1  - 2024/12/31
    PY  - 2024
    N1  - https://doi.org/10.11648/j.ajrs.20241202.13
    DO  - 10.11648/j.ajrs.20241202.13
    T2  - American Journal of Remote Sensing
    JF  - American Journal of Remote Sensing
    JO  - American Journal of Remote Sensing
    SP  - 53
    EP  - 70
    PB  - Science Publishing Group
    SN  - 2328-580X
    UR  - https://doi.org/10.11648/j.ajrs.20241202.13
    AB  - Drought is one of the most frequent natural disasters in the world, droughts has a significantly negative impact on social, economic, and environmental situations. The goal is to assess and define the spatiotemporal analysis of meteorological droughts across ENSO (neutral, El Niño and La Niña) events and provided the guidance of the study area. CHIRPS data gathered from CHG-UCSB for spatial analysis and USGS FEWS NET for temporal analysis, respectively, for the time periods 1981 2020 and 1991–2020. For spatial and temporal analysis SPI was selected due to better for rainfall input over the study area, we employed Python tools and GeoCLIM data analysis methodologies. The findings of this study demonstrate that the Borana zone experienced an increase in droughts during the El Niño, La Niña, and neutral events between 1981 and 2020. The frequency and duration of the dryness were displayed in time steps across short-term drought indices. The extent, duration, and frequency of meteorological (deficit of precipitation) droughts varied, as shown by the time-scale temporal meteorological drought indices in the range of three to twelve months. For the remaining woredas of investigation between the SPI3 and SPI6, SPI6 and SPI12, and SPI9 and SPI12 indices, significantly an increase in the correlation values over short to long durations over the study area was the dominant factor in the meteorological drought severity of the correlation. It is also necessary to conduct additional research on how droughts spread, including the use of various drought indices to gauge the frequency, length, and intensity of droughts over time at the woreda, regional, and national levels. This study will help for different sectors, for knowledge’s and references to better manage irrigation, crop variety selection (drought tolerant seeds), soil conservation, crop production, and better awareness on meteorological droughts over study area.
    
    VL  - 12
    IS  - 2
    ER  - 

    Copy | Download

Author Information
  • Ethiopian Meteorology Institute, Addis Ababa, Ethiopia; Faculty of Meteorology and Hydrology, Water Technology Institute, Arba Minch University, Arba Minch, Ethiopia

  • Faculty of Meteorology and Hydrology, Water Technology Institute, Arba Minch University, Arba Minch, Ethiopia

  • International Centre of Insect Physiology and Ecology (icipe), Nairobi, Kenya