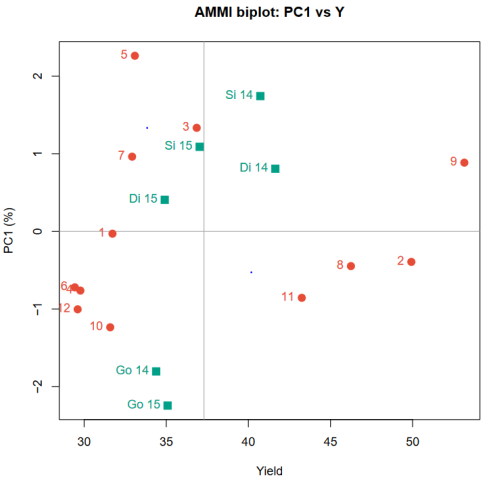
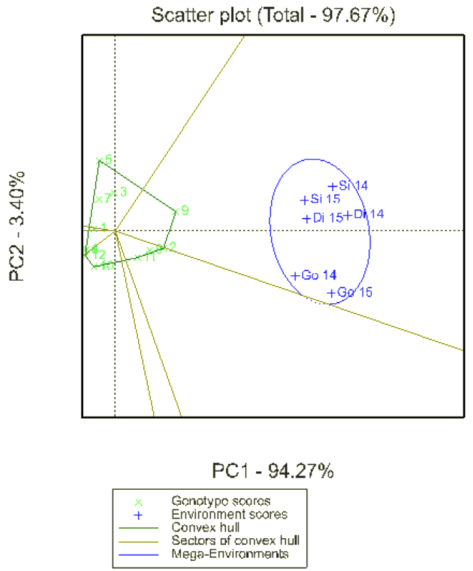
Multi-location experiments are commonly conducted in breeding and variety performance evaluation trials to recognize stable genotype(s) with better crop stand in various environments. In this experiment twelve potato varieties were evaluated for stability across locations (Dinsho, Gobba and Sinana) in Bale Zone from 2021 to 2023 cropping season. The experiment used genotype and environment as treatments, year for replications. For this experiment design RCBD with three replications were used. The results of the AMMI ANOVA revealed that potato tuber yield were significantly (p ≤ 0.05) affected by genotype-environment interaction. This indicates that genotypes exhibits difference in tuber yield performance across varied ecologies. The result of sum squares explained presented that genotype (72.80 %) and environment (16.16%) were the leading donors to tuber yield difference, whereas the genotype-environment interaction effect (11.04 %) donated smallest to the total tuber yield difference. The AMMI, GGE biplot, and Genotype Stability Index (GSI) analysis revealed that G9 and G2 as highly performed genotypes in tuber yield, indicating high mean performance across tested locations. Thus, G9 and G2 have been selected as the best widely adaptable genotypes for growing in all experimental locations and Similar agro-ecologies.
| Published in | American Journal of Plant Biology (Volume 10, Issue 2) |
| DOI | 10.11648/j.ajpb.20251002.16 |
| Page(s) | 51-59 |
| Creative Commons |
This is an Open Access article, distributed under the terms of the Creative Commons Attribution 4.0 International License (http://creativecommons.org/licenses/by/4.0/), which permits unrestricted use, distribution and reproduction in any medium or format, provided the original work is properly cited. |
| Copyright |
Copyright © The Author(s), 2025. Published by Science Publishing Group |
Genotypes, Stability, Interaction
S.No | Genotypes/Varieties | Source of material |
|---|---|---|
1 | CIP-308538.11 | International Potato Center (CIP) |
2 | CIP-313033.42 | International Potato Center (CIP) |
3 | CIP-313022.35 | International Potato Center (CIP) |
4 | CIP-313039.13 | International Potato Center (CIP) |
5 | CIP-308486.22 | International Potato Center (CIP) |
6 | CIP-313038.09 | International Potato Center (CIP) |
7 | CIP-313026.03 | International Potato Center (CIP) |
8 | CIP-313026.43 | International Potato Center (CIP) |
9 | CIP-313037.21 | International Potato Center (CIP) |
10 | CIP-313037.32 | International Potato Center (CIP) |
11 | Wabi | Released by Sinana Agricultural Research Center |
12 | Local | From local farmers |
Source of variation | DF | SS | MS | %SS explained | Proportion % |
|---|---|---|---|---|---|
Total | 209 | 21435 | 102.56 | ||
Treatements | 71 | 17284 | 243.4 | ||
Genotypes | 11 | 12583 | 1143.90** | 72.80 | |
Environments | 5 | 2793 | 558.6* | 16.16 | |
Block | 12 | 397 | 33.1NS | ||
Interactions (GXE) | 55 | 1907 | 34.67* | 11.04 | |
IPCA1 | 15 | 532 | 35.5** | 52.85 | |
IPCA2 | 13 | 260 | 20.0* | 25.83 | |
Error | 132 | 3754 | 28.4 |
Genotypes | Environments | Grand mean | Rank | IPCA1 | IPCA2 | |||||||||||
|---|---|---|---|---|---|---|---|---|---|---|---|---|---|---|---|---|
Sinana 1 | Rank | Sinana 2 | Rank | Goba 1 | Rank | Goba 2 | Rank | Dinsho 1 | Rank | Dinsho 2 | Rank | |||||
CIP-308538.11 | 34.85 | 8 | 32.49 | 8 | 28.88 | 9 | 29.49 | 7 | 34.63 | 10 | 30.00 | 8 | 31.72 | 8 | 0.03 | 0.56 |
CIP-313033.42 | 50.91 | 2 | 50.00 | 2 | 46.78 | 2 | 49.11 | 2 | 56.79 | 2 | 45.95 | 2 | 49.92 | 2 | 0.40 | -0.90 |
CIP-313022.35 | 43.48 | 5 | 35.54 | 7 | 32.17 | 5 | 31.27 | 6 | 44.68 | 5 | 33.97 | 5 | 36.85 | 5 | -1.33 | -0.91 |
CIP-313039.13 | 33.10 | 9 | 28.42 | 12 | 29.63 | 8 | 28.25 | 10 | 30.83 | 11 | 28.39 | 9 | 29.77 | 10 | 0.76 | 1.01 |
CIP-308486.22 | 38.59 | 6 | 36.85 | 5 | 26.39 | 12 | 24.86 | 12 | 38.20 | 6 | 33.64 | 6 | 33.09 | 6 | -2.26 | 0.80 |
CIP-313038.09 | 30.71 | 12 | 27.23 | 11 | 28.37 | 10 | 27.94 | 11 | 35.30 | 9 | 27.03 | 12 | 29.43 | 11 | 0.72 | -0.48 |
CIP-313026.03 | 37.71 | 7 | 36.47 | 6 | 28.28 | 11 | 28.79 | 8 | 35.99 | 8 | 30.29 | 7 | 32.92 | 7 | -0.96 | 0.76 |
CIP-313026.43 | 48.01 | 3 | 44.77 | 3 | 40.95 | 4 | 47.51 | 3 | 53.23 | 3 | 43.00 | 3 | 46.24 | 3 | 0.45 | -1.47 |
CIP-313037.21 | 61.55 | 1 | 51.09 | 1 | 48.27 | 1 | 50.30 | 1 | 58.36 | 1 | 49.33 | 1 | 53.15 | 1 | -0.39 | -0.75 |
CIP-313037.32 | 32.88 | 10 | 30.17 | 9 | 30.55 | 6 | 32.64 | 5 | 35.90 | 7 | 27.39 | 10 | 31.59 | 9 | 1.23 | -0.44 |
Wabi | 45.29 | 4 | 41.32 | 4 | 42.05 | 3 | 42.48 | 4 | 45.63 | 4 | 42.76 | 4 | 43.25 | 4 | 0.86 | 0.53 |
Local | 31.44 | 11 | 30.05 | 10 | 30.32 | 7 | 28.32 | 9 | 30.15 | 12 | 27.13 | 11 | 29.40 | 12 | 1.00 | 1.31 |
Mean | 40.73 | 37.03 | 34.39 | 35.08 | 41.64 | 34.91 | 37.30 | |||||||||
Lsd 0.05 | 8.60 | 7.30 | 3.30 | 7.00 | 10.30 | 6.50 | 2.94 | |||||||||
CV | 15.06 | 14.06 | 6.84 | 14.22 | 17.65 | 13.29 | 14.30 | |||||||||
Genotypes code | Genotypes Accession No. | Average Tuber yield | RY | ASV | RASV | GSI | IPCA1 | IPCA2 |
|---|---|---|---|---|---|---|---|---|
1 | CIP-308538.11 | 31.72 | 8 | 0.56 | 1 | 9 | 0.03 | 0.56 |
2 | CIP-313033.42 | 49.92 | 2 | 2.57 | 10 | 12 | 0.40 | -0.90 |
3 | CIP-313022.35 | 36.85 | 5 | 1.83 | 5 | 10 | -1.33 | -0.91 |
4 | CIP-313039.13 | 29.77 | 10 | 2.43 | 9 | 19 | 0.76 | 1.01 |
5 | CIP-308486.22 | 33.09 | 6 | 1.20 | 2 | 8 | -2.26 | 0.80 |
6 | CIP-313038.09 | 29.43 | 12 | 2.88 | 11 | 23 | 0.72 | -0.48 |
7 | CIP-313026.03 | 32.92 | 7 | 1.86 | 6 | 13 | -0.96 | 0.76 |
8 | CIP-313026.43 | 46.24 | 3 | 4.70 | 12 | 15 | 0.45 | -1.47 |
9 | CIP-313037.21 | 53.15 | 1 | 1.55 | 3 | 4 | -0.39 | -0.75 |
10 | CIP-313037.32 | 31.59 | 9 | 2.11 | 8 | 17 | 1.23 | -0.44 |
11 | Wabi | 43.25 | 4 | 1.73 | 4 | 8 | 0.86 | 0.53 |
12 | Local | 29.61 | 11 | 1.96 | 7 | 18 | 1.00 | 1.31 |
AMMI | Additive Main Effects and Multiplicative Interaction |
GGE | Genotype Plus Genotype by Environment |
ANOVA | Analysis of Variance |
PCA | Principal Component Analysis |
RCBD | Randomized Complete Block Design |
| [1] | Ali, M. B., El-Sadek, A. N., Sayed, M. A. and Hassaan, M. A., 2015. AMMI biplot analysis of genotype× environment interaction in wheat in Egypt. Egyptian Journal of Plant Breeding, 19(6), pp. 1889-1901. |
| [2] | Bedada, A., Tesso, B. and Habte, E., 2022. Genetic variability for yield and yield related traits in advanced bread wheat (Triticum aestivum L.) lines in Eastern Ethiopia. Journal of Plant Sciences, 10(1), pp. 12-18. |
| [3] | Bilate, B. and Mulualem, T., 2016. Performance evaluation of released and farmers’ potato (Solanum tuberosum L.) varieties in eastern Ethiopia. Sky Journal of Agricultural Research, 5(2), pp. 034-041. |
| [4] | CADERSA, M. Y., 2019. Selection of local potato breeding clones for yield and tuber characteristics in two cropping seasons. Potato Journal, 46(2). |
| [5] | Dhasmana, A., Uniyal, S., Anukriti, Kashyap, V. K., Somvanshi, P., Gupta, M., Bhardwaj, U., Jaggi, M., Yallapu, M. M., Haque, S. and Chauhan, S. C., 2020. Topological and system-level protein interaction network (PIN) analyses to deduce molecular mechanism of curcumin. Scientific reports, 10(1), p. 12045. |
| [6] | Gebeyehu, S., Kakuhenzire, R., Retta Solomon, A., Chindi, A., TekleMedhin, L., Kassaye Atsbeha, H. and Getahun, W., 2024. Analysis for Developing a Sustainable Seed Potato Value Chain in Oromia. Region, Ethiopia. |
| [7] | Gebru, H., Mohammed, A., Dechassa, N. and Belew, D., 2017. Assessment of production practices of smallholder potato (Solanum tuberosum L.) farmers in Wolaita zone, southern Ethiopia. Agriculture & Food Security, 6, pp. 1-11. |
| [8] | Gemechu, G. E., Mulualem, T. and Semman, N., 2022. Genotype by environment interaction effect on some selected traits of orange-fleshed sweet potato (Ipomoea batatas [L]. Lam). Heliyon, 8(12). |
| [9] | Maulana, H., Nafi’ah, H. H., Solihin, E., Ruswandi, D., Arifin, M., Amien, S. and Karuniawan, A., 2022. Combined stability analysis to select stable and high yielding sweet potato genotypes in multi-environmental trials in West Java, Indonesia. Agriculture and Natural Resources, 56(4), pp. 761-772. |
| [10] | Meyhuay, M., 2001. POTATO: Post-harvest operations. |
| [11] | Mickiewicz, B., Volkova, E. and Jurczak, R., 2022. The global market for potato and potato products in the current and forecast period. |
| [12] | Mulualem, T., Etana, G. and Semman, N., Ethiopian Journal of Crop Science Journal/Ethiopian Journal of Crop Science/Vol. 11 No. 1 (2023): Ethiopian Journal of Crop Science/Articles Open Access. |
| [13] | Payne, R. W., Baird, D. B., Cherry, M., Gilmour, A. R., Harding, S. A., Lane, P. W., Morgan, G. W., Murray, D. A., Soutar, D. M., Thompson, R. and Todd, A. D., 2002. GenStat release 6.1 reference manual. Part 2. Directives. |
| [14] | Rad, M. N., Bakhshi, B., Abbasi, J. K., Ghasemi, A. and Rostampour, M. F., 2020. Response of Iranian melon populations to deficit irrigation condition. |
| [15] | Sheng, Y., He, P., Xu, X. and Liu, Y., 2023. A large-scale assessment on spatial variability of potato yield and soil chemical properties in northern China. Soil and Tillage Research, 231, p. 105743. |
| [16] | Sood, S., Bhardwaj, V., Kumar, V., Das, R., Gupta, V. K., Mangal, V., Luthra, S. K., Kumar, R., Kumar, S., Singh, R. K. and Kumar, M., 2022. Genetic progress in 50 years of potato breeding in India: where do we stand?. European Journal of Agronomy, 141, p. 126620. |
| [17] | Tapiwa, K. A., 2019. Assessing the effect of cattle manure and reduced rates of nitrogen (N) and potassium (K2 O) as integrated nutrient management options on growth and yield of potatoes. International Journal of Agricultural Sciences and Veterinary Medicine, 7(4), pp. 21-27. |
| [18] | Tesfaye, M. and Tessema, L., 2022. Empirical review on determinants of improved potato technology adoption in Ethiopia. Research & Development, 3(3), pp. 185-191. |
| [19] | Tessema, L., Mohammed, W. and Abebe, T., 2020. Evaluation of potato (Solanum tuberosum L.) varieties for yield and some agronomic traits. Open Agriculture, 5(1), pp. 63-74. |
| [20] | Tolassa, T. B. and Bedada, T. N., Potato Value Chain Analysis in Highland of Guji Zone, Southern Oromia, Ethiopia. |
| [21] | Tolessa, T. T., Keneni, G., Mohammed, H. and Ahmed, S. K., 2019. Decades of faba bean (Vicia faba L.) breeding for better grain yield and seed size has inadvertently reduced G× E interaction and increased inter-temporal performance stability. Journal of Crop Science and Biotechnology, 22, pp. 265-274. |
| [22] | Yan, W. and Kang, M. S., 2002. GGE biplot analysis: A graphical tool for breeders, geneticists, and agronomists. CRC press. |
| [23] | Yan, W. and Wu, H. X., 2008. Application of GGE biplot analysis to evaluate Genotype (G), Environment (E), and G× E interaction on Pinus radiata: a case study. New Zealand Journal of Forestry Science, 38(1), pp. 132-142. |
| [24] | Zobel, H. F. and Stephen, A. M., 1995. Starch: structure, analysis, and application. FOOD SCIENCE AND TECHNOLOGY-NEW YORK-MARCEL DEKKER-, pp. 19-19. |
APA Style
Ejigu, G., Asefa, G. (2025). Evaluation of Tuber Yield Performance and Stability Analysis of Irish Potato (Solanum tubersum L.) Genotypes Using AMMI and GGE Biplot at Bale High Lands, South Eastern Ethiopia. American Journal of Plant Biology, 10(2), 51-59. https://doi.org/10.11648/j.ajpb.20251002.16
ACS Style
Ejigu, G.; Asefa, G. Evaluation of Tuber Yield Performance and Stability Analysis of Irish Potato (Solanum tubersum L.) Genotypes Using AMMI and GGE Biplot at Bale High Lands, South Eastern Ethiopia. Am. J. Plant Biol. 2025, 10(2), 51-59. doi: 10.11648/j.ajpb.20251002.16
@article{10.11648/j.ajpb.20251002.16,
  author = {Gemechu Ejigu and Getachew Asefa},
  title = {Evaluation of Tuber Yield Performance and Stability Analysis of Irish Potato (Solanum tubersum L.) Genotypes Using AMMI and GGE Biplot at Bale High Lands, South Eastern Ethiopia
},
  journal = {American Journal of Plant Biology},
  volume = {10},
  number = {2},
  pages = {51-59},
  doi = {10.11648/j.ajpb.20251002.16},
  url = {https://doi.org/10.11648/j.ajpb.20251002.16},
  eprint = {https://article.sciencepublishinggroup.com/pdf/10.11648.j.ajpb.20251002.16},
  abstract = {Multi-location experiments are commonly conducted in breeding and variety performance evaluation trials to recognize stable genotype(s) with better crop stand in various environments. In this experiment twelve potato varieties were evaluated for stability across locations (Dinsho, Gobba and Sinana) in Bale Zone from 2021 to 2023 cropping season. The experiment used genotype and environment as treatments, year for replications. For this experiment design RCBD with three replications were used. The results of the AMMI ANOVA revealed that potato tuber yield were significantly (p ≤ 0.05) affected by genotype-environment interaction. This indicates that genotypes exhibits difference in tuber yield performance across varied ecologies. The result of sum squares explained presented that genotype (72.80 %) and environment (16.16%) were the leading donors to tuber yield difference, whereas the genotype-environment interaction effect (11.04 %) donated smallest to the total tuber yield difference. The AMMI, GGE biplot, and Genotype Stability Index (GSI) analysis revealed that G9 and G2 as highly performed genotypes in tuber yield, indicating high mean performance across tested locations. Thus, G9 and G2 have been selected as the best widely adaptable genotypes for growing in all experimental locations and Similar agro-ecologies.
},
 year = {2025}
}
TY  - JOUR
T1  - Evaluation of Tuber Yield Performance and Stability Analysis of Irish Potato (Solanum tubersum L.) Genotypes Using AMMI and GGE Biplot at Bale High Lands, South Eastern Ethiopia

AU  - Gemechu Ejigu
AU  - Getachew Asefa
Y1  - 2025/06/23
PY  - 2025
N1  - https://doi.org/10.11648/j.ajpb.20251002.16
DO  - 10.11648/j.ajpb.20251002.16
T2  - American Journal of Plant Biology
JF  - American Journal of Plant Biology
JO  - American Journal of Plant Biology
SP  - 51
EP  - 59
PB  - Science Publishing Group
SN  - 2578-8337
UR  - https://doi.org/10.11648/j.ajpb.20251002.16
AB  - Multi-location experiments are commonly conducted in breeding and variety performance evaluation trials to recognize stable genotype(s) with better crop stand in various environments. In this experiment twelve potato varieties were evaluated for stability across locations (Dinsho, Gobba and Sinana) in Bale Zone from 2021 to 2023 cropping season. The experiment used genotype and environment as treatments, year for replications. For this experiment design RCBD with three replications were used. The results of the AMMI ANOVA revealed that potato tuber yield were significantly (p ≤ 0.05) affected by genotype-environment interaction. This indicates that genotypes exhibits difference in tuber yield performance across varied ecologies. The result of sum squares explained presented that genotype (72.80 %) and environment (16.16%) were the leading donors to tuber yield difference, whereas the genotype-environment interaction effect (11.04 %) donated smallest to the total tuber yield difference. The AMMI, GGE biplot, and Genotype Stability Index (GSI) analysis revealed that G9 and G2 as highly performed genotypes in tuber yield, indicating high mean performance across tested locations. Thus, G9 and G2 have been selected as the best widely adaptable genotypes for growing in all experimental locations and Similar agro-ecologies.

VL  - 10
IS  - 2
ER  -
Oromia Agricultural Research Institute, Sinana Agricultural Research Center, Robe-Bale, Ethiopia
Information