The aim of this research was to develop a lung cancer diagnostic and predictive model that integrates traditional laboratory indicators with tumor markers. This model is intended to facilitate early screening and assist in the process of identifying or detecting lung cancer through a cost-effective, rapid, and convenient approach, ultimately enhancing the early detection rate of lung cancer. A retrospective study was conducted on 66 patients diagnosed with lung cancer and 159 patients with benign pulmonary conditions. Data including general clinical information, conventional laboratory test results, and tumor marker levels were collected. Data analysis was conducted using SPSS 26.0 (Statistical Product and Service Solutions 26.0). The lung cancer diagnosis and prediction model is created using a composite index established through binary logistic regression. The combined diagnostic prediction models, incorporating both traditional indicators and tumor markers, demonstrated a greater area under the curve (AUC) when compared to the diagnostic prediction model based solely on tumor markers and their combination testing. The values of cut-off point, AUC, accuracy, sensitivity, specificity, positive and negative detection rate and accuracy rate are 0.1805, 0.959, 86.67%, 0.955, 0.830, 95.45%, 83.02% and 89.33 respectively and it is shown that the combined diagnostic model display notable efficacy and clinical relevance in aiding the early diagnosis of lung cancer.
| Published in | American Journal of Clinical and Experimental Medicine (Volume 12, Issue 3) |
| DOI | 10.11648/j.ajcem.20241203.11 |
| Page(s) | 20-27 |
| Creative Commons |
This is an Open Access article, distributed under the terms of the Creative Commons Attribution 4.0 International License (http://creativecommons.org/licenses/by/4.0/), which permits unrestricted use, distribution and reproduction in any medium or format, provided the original work is properly cited. |
| Copyright |
Copyright © The Author(s), 2024. Published by Science Publishing Group |
Combined Detection, Early Lung Cancer, Tumor Markers, Binary Logistic Regression
 variables is,
 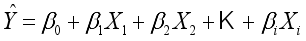 (1)
(1)  is the estimated continuous outcome,
  denotes independent variable,
  is estimated coefficient. Identifying the contributions of independent variables in logistic regression starts with the subsequent equation.
 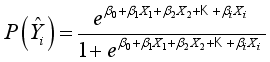 (2)
(2)  ) compared to the other category (
  ).
). 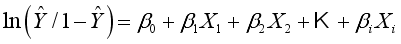 .(3)
.(3) No | Indicators | Group 1: n=99 | Group 0: n=126 | P value | ||
|---|---|---|---|---|---|---|
[M(P25, P75)] | Mean | [M(P25, P75)] | Mean | |||
1 | Age | 63.5 (54, 69.25) | 61.89 | 63 (49, 72) | 60.49 | 0.742 |
2 | WBC | 6.06 (5.38, 7.42) | 6.97 | 6.82 (5.32, 8.97) | 7.85 | 0.099 |
3 | Neut# | 3.88 (3.21, 4.88) | 4.68 | 4.63 (3.25, 6.68) | 5.70 | 0.03 |
4 | Lymph# | 1.46 (1.2, 1.95) | 1.56 | 1.25 (0.91, 1.66) | 1.35 | 0.009 |
5 | Mono# | 0.42 (0.35, 0.56) | 0.53 | 0.5 (0.38, 0.7) | 0.58 | 0.018 |
6 | Eos# | 0.12 (0.06, 0.21) | 0.19 | 0.07 (0, 0.15) | 0.22 | 0.003 |
7 | Baso# | 0.04 (0, 0.06) | 0.04 | 0 (0, 0.05) | 0.03 | 0.009 |
8 | RBC | 4.49 (4.17, 4.81) | 4.47 | 4.31 (3.86, 4.73) | 4.25 | 0.024 |
9 | HGB | 136 (122.75, 149.25) | 135.69 | 128 (116, 141) | 126.36 | 0.001 |
10 | HCT | 0.41 (0.38, 0.44) | 0.41 | 0.38 (0.35, 0.42) | 0.38 | 0.002 |
11 | MCV | 90.8 (87.3, 93.5) | 90.39 | 90 (86, 93.4) | 89.28 | 0.281 |
12 | MCH | 30.7 (29.5, 31.63) | 30.4 | 30.2 (28.8, 31.3) | 29.88 | 0.046 |
13 | MCHC | 337 (328.75, 344) | 336.14 | 334 (325, 346) | 334.55 | 0.635 |
14 | RDW | 13 (12.48, 13.4) | 13.09 | 13.4 (12.7, 14.5) | 13.78 | 0.001 |
15 | PLT | 237 (200, 281.25) | 244.44 | 239 (184, 307) | 256.00 | 0.813 |
16 | PCT | 0.26 (0.24, 0.3) | 0.29 | 0.26 (0.22, 0.32) | 0.28 | 0.621 |
17 | PLT | 33 (26.75, 40.85) | 34.11 | 30.8 (24, 38.1) | 31.95 | 0.177 |
18 | PDW | 12.85 (11.7, 15.18) | 13.7 | 12.7 (10.7, 14.6) | 13.18 | 0.228 |
19 | MPV | 11 (10.3, 12) | 11.17 | 10.8 (10, 11.6) | 10.92 | 0.209 |
20 | ESR | 16 (7, 35.75) | 24.75 | 26 (12, 57) | 36.46 | 0.009 |
21 | ALT | 20.5 (14, 27.25) | 24.29 | 17 (11, 26) | 34.99 | 0.104 |
22 | AST | 25 (22.75, 29.25) | 27.28 | 23 (19, 34) | 40.09 | 0.317 |
23 | AST/ALT | 1.23 (0.9, 1.69) | 1.36 | 1.45 (1, 2) | 1.64 | 0.033 |
24 | GGT | 23 (15.75, 39) | 33.66 | 26 (17, 45) | 38.47 | 0.274 |
25 | TBIL | 9.7 (7.08, 13.65) | 10.99 | 10.5 (7.7, 13.5) | 11.41 | 0.425 |
26 | DBIL | 2.3 (1.88, 3.3) | 2.62 | 2.4 (1.8, 3.3) | 2.98 | 0.654 |
27 | IBIL | 7.5 (5.5, 10.2) | 8.37 | 8 (5.8, 10.6) | 8.43 | 0.414 |
28 | TBA | 3.84 (2.52, 5.88) | 5.16 | 3.56 (2.13, 7.18) | 5.70 | 0.715 |
29 | TP | 68.45 (62.83, 72.1) | 67.57 | 67.7 (63.4, 72.1) | 67.35 | 0.777 |
30 | ALB | 39.05 (35.4, 42.6) | 38.41 | 37.5 (34, 41.1) | 37.08 | 0.074 |
31 | GLB | 29.25 (26.83, 31.9) | 29.16 | 30 (26.5, 33.7) | 30.27 | 0.27 |
32 | A/G | 1.37 (1.19, 1.53) | 1.35 | 1.28 (1.09, 1.49) | 1.28 | 0.086 |
33 | PA | 212 (179.75, 259) | 217 | 192 (144, 238) | 190.76 | 0.008 |
34 | Urea | 5.2 (4.06, 6.78) | 5.41 | 4.57 (3.79, 6.17) | 5.30 | 0.16 |
35 | Cr | 69 (58, 83) | 70.72 | 71 (58, 87) | 73.99 | 0.362 |
36 | GLU | 5.6 (4.88, 6.6) | 5.99 | 5.62 (4.88, 7.68) | 6.98 | 0.34 |
37 | PT-INR | 0.94 (0.91, 0.99) | 0.95 | 0.94 (0.87, 1.01) | 0.96 | 0.466 |
38 | PT | 11.5 (10.8, 12.4) | 11.48 | 10.8 (10, 12.1) | 11.09 | 0.003 |
39 | PT% | 111.6 (102, 120.25) | 112.28 | 111.3 (96.7, 126.5) | 111.33 | 0.996 |
40 | APTT | 29.5 (26.38, 35.33) | 30.85 | 28 (26.1, 32.1) | 29.59 | 0.114 |
41 | Fbg | 3.12 (2.8, 3.84) | 3.5 | 3.45 (2.81, 4.79) | 4.03 | 0.054 |
42 | TT | 17.35 (16.68, 18) | 17.38 | 17.5 (16.8, 18.9) | 18.12 | 0.093 |
43 | PTR | 0.95 (0.92, 0.99) | 0.96 | 0.94 (0.87, 1) | 0.96 | 0.227 |
44 | SCC | 0.75 (0.58, 1) | 1.25 | 0.8 (0.6, 1.1) | 1.68 | 0.615 |
45 | proGRP | 33.55 (27.5, 44.55) | 63.32 | 33.9 (26, 45.5) | 36.57 | 0.776 |
46 | CEA | 2.45 (1.47, 5.62) | 16.2 | 1.85 (1.19, 2.61) | 2.28 | 0.002 |
47 | NSE | 17.21 (12.77, 26.45) | 20.31 | 14.1 (11.39, 20.2) | 18.01 | 0.007 |
48 | CYFRA21-1 | 3.49 (2.43, 5.27) | 5.99 | 2.36 (1.72, 3.3) | 3.04 | 0.000 |
49 | Smoking | - | - | - | - | 0.015 |
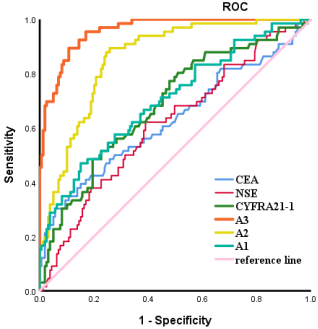
Different Methods | AUC | Cut-Off | Sensitivity (%) | Specificity (%) | Youden index | Negative Rate (%) | Positive Rate (%) | Accuracy (%) |
|---|---|---|---|---|---|---|---|---|
CEA | 0.685 | 4.400 | 0.303 | 0.943 | 0.246 | 94.34 | 30.3 | 75.56 |
CYFRA21-1 | 0.775 | 2.410 | 0.773 | 0.522 | 0.295 | 52.2 | 77.27 | 59.56 |
SCC | 0.528 | 2.950 | 0.091 | 0.943 | 0.034 | 94.34 | 9.01 | 69.33 |
A1 | 0.703 | 0.2965 | 0.455 | 0.855 | 0.310 | 85.53 | 45.45 | 73.77 |
A2 | 0.859 | 0.2532 | 0.894 | 0.742 | 0.636 | 74.21 | 89.39 | 78.67 |
A3 | 0.959 | 0.1805 | 0.955 | 0.830 | 0.785 | 83.02 | 95.45 | 86.67 |
| [1] | Leiter, A., Veluswamy, R. R., and Wisnivesky, J. P. (2023). The global burden of lung cancer: current status and future trends. Nature reviews. Clinical oncology, 20(9), 624–639. |
| [2] |
Sung, H., Ferlay, J., Siegel, R., Laversanne, M., Soerjomataram, I., Jemal, A. and Bray, F. Global Cancer Statistics 2020: GLOBOCAN Estimates of Incidence and Mortality Worldwide for 36 Cancers in 185 Countries. CA Cancer J Clin. 2021, 71(3): 209-249.
https://doi.org/10.3322/caac.21660 (Epub 2021 Feb 4). |
| [3] | Asakura, K., Kadota, T., Matsuzaki, J., Yoshida, Y., Yamamoto, Y., Nakagawa, K., Takizawa, S., Aoki, Y., Nakamura, E., Miura, J., Sakamoto, H., Kato, K., Watanabe, S. and Ochiya, T. A miRNA-based diagnostic model predicts resectable lung cancer in humans with high accuracy. Commun Biol. 2020, 3: 134. |
| [4] | Chansky, K., Detterbeck, F., Nicholson, A., Rusch V., Vallières, E., Groome, P., Kennedy, C., Krasnik, M., Peake, M., Shemanski, L., Bolejack, V., Crowley, J., Asamura, H. and Rami-Porta, R. The IASLC Staging and Prognostic Factors Committee, Advisory Boards and Participating Institutions. The IASLC lung cancer staging project: external validation of the revision of the TNM stage groupings in the eighth edition of the TNM classification of lung cancer. J Thorac Oncol. 2017, 12: 1109–21. |
| [5] | Landy, R., Wang, V. L., Baldwin, D. R., Pinsky, P. F., Cheung, L. C., Castle, P. E., Skarzynski, M., Robbins, H. A., and Katki, H. A. Recalibration of a Deep Learning Model for Low-Dose Computed Tomographic Images to Inform Lung Cancer Screening Intervals. JAMA network open, 2023, 6(3), e233273. |
| [6] | National Lung Screening Trial Research Team, Church, T. R., Black, W. C., Aberle, D. R., Berg, C. D., Clingan, K. L., Duan, F., Fagerstrom, R. M., Gareen, I. F., Gierada, D. S., Jones, G. C., Mahon, I., Marcus, P. M., Sicks, J. D., Jain, A., and Baum, S. Results of initial low-dose computed tomographic screening for lung cancer. The New England journal of medicine, 2013, 368(21), 1980–1991. |
| [7] | Bach, P. B., Mirkin, J. N., Oliver, T. K., Azzoli, C. G., Berry, D. A., Brawley, O. W., Byers, T., Colditz, G. A., Gould, M. K., Jett, J. R., Sabichi, A. L., Smith-Bindman, R., Wood, D. E., Qaseem, A., and Detterbeck, F. C. Benefits and harms of CT screening for lung cancer: a systematic review. JAMA, 2012, 307(22), 2418–2429. |
| [8] | Manser, R., Lethaby, A., Irving, L. B., Stone, C., Byrnes, G., Abramson, M. J., and Campbell, D. Screening for lung cancer. The Cochrane database of systematic reviews, 2013(6), CD001991. |
| [9] | Yang, X., Xu, J., Sun, J., Yin, L., Guo, R., and Yan, Z. Clinical value of color Doppler ultrasound combined with serum tumor markers for the diagnosis of medullary thyroid carcinoma. Oncology letters, 2021, 22(1), 561. |
| [10] | Song, X., Liang, B., Wang, C., and Shi, S. Clinical value of color Doppler ultrasound combined with serum CA153, CEA and TSGF detection in the diagnosis of breast cancer. Experimental and therapeutic medicine, 2020, 20(2), 1822–1828. |
| [11] | Hong, Y. J., Hur, J., Lee, H. J., Nam, J. E., Kim, Y. J., Kim, H. S., Kim, H. Y., Kim, S. K., Chang, J., Kim, J. H., Chung, K. Y., Choi, B. W., and Choe, K. O. Analysis of tumor markers in the cytological fluid obtained from computed tomography-guided needle aspiration biopsy for the diagnosis of non-small cell lung cancer. Journal of thoracic oncology: official publication of the International Association for the Study of Lung Cancer, 2011, 6(8), 1330–1335. |
| [12] | Kim, G. R., Hur, J., Lee, H. J., Nam, J. E., Kim, Y. J., Hong, Y. J., Shim, H. S., Kim, H. Y., Lee, J. W., and Choi, B. W. Analysis of tumor markers in cytological fluid obtained from computed tomography-guided needle aspiration biopsies for the diagnosis of ground-glass opacity pulmonary lesions. Cancer cytopathology, 2013, 121(4), 214–222. |
| [13] | Ghosh, M., Mukhopadhyay, M., Das, C., Chatterjee, S., and Naskar, B. G. Molecular profiling and utility of cell-free DNA in nonsmall carcinoma of the lung: Study in a tertiary care hospital. Journal of cancer research and therapeutics, 2021, 17(6), 1389–1396. |
| [14] | Zhang, L., Liu, D., Li, L., Pu, D., Zhou, P., Jing, Y., Yu, H., Wang, Y., Zhu, Y., He, Y., Li, Y., Zhao, S., Qiu, Z., and Li, W. The important role of circulating CYFRA21-1 in metastasis diagnosis and prognostic value compared with carcinoembryonic antigen and neuron-specific enolase in lung cancer patients. BMC cancer, 2017, 17(1), 96. |
| [15] | Stoltzfus J. C. Logistic regression: a brief primer. Academic emergency medicine: official journal of the Society for Academic Emergency Medicine, 2011, 18(10), 1099–1104. |
| [16] | Harris J. K. Primer on binary logistic regression. Family medicine and community health, 2021, 9 (Suppl 1), e001290. |
| [17] | Howlader, N., Forjaz, G., Mooradian, M. J., Meza, R., Kong, C. Y., Cronin, K. A., Mariotto, A. B., Lowy, D. R., and Feuer, E. J. The Effect of Advances in Lung-Cancer Treatment on Population Mortality. The New England journal of medicine, 2020, 383(7), 640–649. |
| [18] | Wynder, E. L., and Graham, E. A. Tobacco smoking as a possible etiologic factor in bronchiogenic carcinoma. Bulletin of the World Health Organization, 2005, 83(2), 146–153. |
| [19] | Bach P. B. Smoking as a factor in causing lung cancer. JAMA, 301(5), 2009, 539–541. |
APA Style
Zhou, S., Ge, X., Yang, Z., Zeng, F. (2024). Regression–Based Diagnostic Models for Early Lung Cancer Integrating Conventional Indicators with Tumor Markers. American Journal of Clinical and Experimental Medicine, 12(3), 20-27. https://doi.org/10.11648/j.ajcem.20241203.11
ACS Style
Zhou, S.; Ge, X.; Yang, Z.; Zeng, F. Regression–Based Diagnostic Models for Early Lung Cancer Integrating Conventional Indicators with Tumor Markers. Am. J. Clin. Exp. Med. 2024, 12(3), 20-27. doi: 10.11648/j.ajcem.20241203.11
AMA Style
Zhou S, Ge X, Yang Z, Zeng F. Regression–Based Diagnostic Models for Early Lung Cancer Integrating Conventional Indicators with Tumor Markers. Am J Clin Exp Med. 2024;12(3):20-27. doi: 10.11648/j.ajcem.20241203.11
@article{10.11648/j.ajcem.20241203.11,
  author = {Shufang Zhou and Xiaojun Ge and Zhifang Yang and Fei Zeng},
  title = {Regression–Based Diagnostic Models for Early Lung Cancer Integrating Conventional Indicators with Tumor Markers
},
  journal = {American Journal of Clinical and Experimental Medicine},
  volume = {12},
  number = {3},
  pages = {20-27},
  doi = {10.11648/j.ajcem.20241203.11},
  url = {https://doi.org/10.11648/j.ajcem.20241203.11},
  eprint = {https://article.sciencepublishinggroup.com/pdf/10.11648.j.ajcem.20241203.11},
  abstract = {The aim of this research was to develop a lung cancer diagnostic and predictive model that integrates traditional laboratory indicators with tumor markers. This model is intended to facilitate early screening and assist in the process of identifying or detecting lung cancer through a cost-effective, rapid, and convenient approach, ultimately enhancing the early detection rate of lung cancer. A retrospective study was conducted on 66 patients diagnosed with lung cancer and 159 patients with benign pulmonary conditions. Data including general clinical information, conventional laboratory test results, and tumor marker levels were collected. Data analysis was conducted using SPSS 26.0 (Statistical Product and Service Solutions 26.0). The lung cancer diagnosis and prediction model is created using a composite index established through binary logistic regression. The combined diagnostic prediction models, incorporating both traditional indicators and tumor markers, demonstrated a greater area under the curve (AUC) when compared to the diagnostic prediction model based solely on tumor markers and their combination testing. The values of cut-off point, AUC, accuracy, sensitivity, specificity, positive and negative detection rate and accuracy rate are 0.1805, 0.959, 86.67%, 0.955, 0.830, 95.45%, 83.02% and 89.33 respectively and it is shown that the combined diagnostic model display notable efficacy and clinical relevance in aiding the early diagnosis of lung cancer.
},
 year = {2024}
}
TY  - JOUR
T1  - Regression–Based Diagnostic Models for Early Lung Cancer Integrating Conventional Indicators with Tumor Markers

AU  - Shufang Zhou
AU  - Xiaojun Ge
AU  - Zhifang Yang
AU  - Fei Zeng
Y1  - 2024/06/06
PY  - 2024
N1  - https://doi.org/10.11648/j.ajcem.20241203.11
DO  - 10.11648/j.ajcem.20241203.11
T2  - American Journal of Clinical and Experimental Medicine
JF  - American Journal of Clinical and Experimental Medicine
JO  - American Journal of Clinical and Experimental Medicine
SP  - 20
EP  - 27
PB  - Science Publishing Group
SN  - 2330-8133
UR  - https://doi.org/10.11648/j.ajcem.20241203.11
AB  - The aim of this research was to develop a lung cancer diagnostic and predictive model that integrates traditional laboratory indicators with tumor markers. This model is intended to facilitate early screening and assist in the process of identifying or detecting lung cancer through a cost-effective, rapid, and convenient approach, ultimately enhancing the early detection rate of lung cancer. A retrospective study was conducted on 66 patients diagnosed with lung cancer and 159 patients with benign pulmonary conditions. Data including general clinical information, conventional laboratory test results, and tumor marker levels were collected. Data analysis was conducted using SPSS 26.0 (Statistical Product and Service Solutions 26.0). The lung cancer diagnosis and prediction model is created using a composite index established through binary logistic regression. The combined diagnostic prediction models, incorporating both traditional indicators and tumor markers, demonstrated a greater area under the curve (AUC) when compared to the diagnostic prediction model based solely on tumor markers and their combination testing. The values of cut-off point, AUC, accuracy, sensitivity, specificity, positive and negative detection rate and accuracy rate are 0.1805, 0.959, 86.67%, 0.955, 0.830, 95.45%, 83.02% and 89.33 respectively and it is shown that the combined diagnostic model display notable efficacy and clinical relevance in aiding the early diagnosis of lung cancer.

VL  - 12
IS  - 3
ER  -
Department of Laboratory Medicine, The Second Affiliated Hospital of Zunyi Medical University, Zunyi, China; School of Laboratory Medicine, Zunyi Medical University, Zunyi, China
Biography: Shufang Zhou is a intermediate Medical Laboratory Technician of the Laboratory Department at the Second Affiliated Hospital of Zunyi Medical University (ZMU). She acquired her Master in College of Life Science & Technology from Huazhong University of Science and Technology in 2015. She joined the Second Affiliated Hospital of ZMU in 2016 to engage in clinical laboratory work.
Research Fields: Clinical laboratory testing, medical statistical Analysis, probability statistics in medicine, machine learning

Department of Laboratory Medicine, The Second Affiliated Hospital of Zunyi Medical University, Zunyi, China; School of Laboratory Medicine, Zunyi Medical University, Zunyi, China
Biography: Xiaojun Ge is a professor and Master's Supervisor at ZMU, a director of the Laboratory Department at the Second Affiliated Hospital of ZMU. He acquired his PhD in West China School of Medicine from Sichuan University in 2014, and his Master of Engineering in School of Laboratory Medicine from the ZMU in 2007.
Research Fields: Hematologic (Blood) Cell Morphology Examination, Medical Statistical Testing

Information