1. Introduction
Soil degradation refers to the deterioration in soil qualities which encompasses soil erosion, soil compaction, low organic matter content, loss of soil structure, and poor internal drainage system, salinization and soil acidity problems
. Worldwide, declining in soil quality has posed a tremendous challenge to increasing agricultural productivity, economic growth, and healthy environment
| [2] | Eswaran H., Lal R., and Reich P. F., “Land degradation: an overview,” in Response to Land Degradation, E. M. Bridges, I. D. Hannam, L. R. Oldeman, F. W. T. Penning De Vries, J. S. Scherr, and S. Sombatpanit, Eds., pp. 20–35, Science Publishers, Enfield, NH, USA, 2001. |
| [3] | Girmay G., Singh B. R., Mitiku H., Borresen T., and Lal R., “Carbon stocks in Ethiopian soils in relation to land use and soil management,” Land Degradation and Development, vol. 19, no. 4, pp. 351–367, 2008. |
[2, 3]
. The fundamental causes for soil degradation are largely related to unsuitable land use and soil management, erratic and erosive rainfall, steep terrain, deforestation, and overgrazing
| [3] | Girmay G., Singh B. R., Mitiku H., Borresen T., and Lal R., “Carbon stocks in Ethiopian soils in relation to land use and soil management,” Land Degradation and Development, vol. 19, no. 4, pp. 351–367, 2008. |
| [4] | Lal R., Sobecki T. M., Iivari T., and Kimble J. M., Soil Degradation in the United States: Extent, Severity and Trends, CRC Press, Boca Raton, Fla, USA, 2003. |
[3, 4]
. In Ethiopia, soil degradation in the form of soil erosion and soil fertility loss is a serious challenge to agricultural productivity and economic growth, of which soil erosion is the most serious problem
| [5] | Nyssen J., J. Poesen, J. Moeyerson, M. Haile, and J. Deckers, 2008. “Dynamics of soil erosion rates and controlling factors in the Northern Ethiopian highlands-towards a sediment budget”. Earth Surface Processes and Landforms, vol. 33: 695-711. |
[5]
. Deforestation and over misuse of vegetation, shifting cultivation, overgrazing, unselective use of agrochemicals, lack of soil conservation practices, and over withdrawal of ground water are some anthropogenic causes of soil degradation
| [6] | Osman, K. T., 2013. Soil degradation, conservation and remediation. Springer. |
[6]
. Most of the causes are resulted from a desperate attempt by farmers to increase production for the growing population which aggravate soil quality depletion more in the developing countries, which mainly depend on natural resources
| [2] | Eswaran H., Lal R., and Reich P. F., “Land degradation: an overview,” in Response to Land Degradation, E. M. Bridges, I. D. Hannam, L. R. Oldeman, F. W. T. Penning De Vries, J. S. Scherr, and S. Sombatpanit, Eds., pp. 20–35, Science Publishers, Enfield, NH, USA, 2001. |
| [4] | Lal R., Sobecki T. M., Iivari T., and Kimble J. M., Soil Degradation in the United States: Extent, Severity and Trends, CRC Press, Boca Raton, Fla, USA, 2003. |
[2, 4]
. Soil quality degradation by soil erosion such as soil nutrient depletion and changes in soil physical indicators is largely recognized as a main cause provoked by the effect of unsuitable land use and soil management in the developing countries like Ethiopia
| [7] | Doran J. W., “Soil health and global sustainability: translating science into practice,” Agriculture, Ecosystems and Environment, vol. 88, no. 2, pp. 119–127, 2002. |
[7]
. Soil management practices can enhance or reduce soil quality, which in turn can be associated with an increase or decrease in soil productivity
| [8] | Ogle, S. M., Swan, A., Paustian, K., 2012. No-till management impacts on crop productivity, carbon input and soil carbon sequestration. Agriculture, Ecosystems and Environment 149, 37–49. |
| [9] | Pankhurst, C. E., Magarey, R. C., Stirling, G. R., Blair, B. L., Bell, M. J., Garside, A. L., 2003. Management practices to improve soil health and reduce the effects of detrimental soil biota associated with yield decline of sugarcane in Queensland, Australia. Soil and Tillage Research 72, 125–137. |
[8, 9]
.
In normal conditions, the soil can maintain balance by pedo-genetic procedures
| [10] | Masto R. E., Chhonkar P. K., Singh D., and Patra A. K., “Alternative soil quality indices for evaluating the effect of intensive cropping, fertilisation and manuring for 31 years in the semi-arid soils of India,” Environmental Monitoring and Assessment, vol. 136, no. 1–3, pp. 419–435, 2008. |
| [11] | Parr J. F., Papendick R. I, Hornick S. B., and Meyer R. E., “Soil quality: attributes and relationship to alternative and sustainable agriculture,” American Journal of Alternative Agriculture, vol. 7, no. 1-2, pp. 5–11, 1992. |
[10, 11]
. However, this balance is easily disturbed by anthropogenic activities (e.g., agricultural practices, deforestation, and overgrazing), and such effects are mainly observed in the developing countries with poor technical and financial resources to manage natural resources
| [12] | Carter M. R., “Soil quality for sustainable land management: organic matter and aggregation interactions that maintain soil functions,” Agronomy Journal, vol. 94, no. 1, pp. 38–47, 2002. |
| [10] | Masto R. E., Chhonkar P. K., Singh D., and Patra A. K., “Alternative soil quality indices for evaluating the effect of intensive cropping, fertilisation and manuring for 31 years in the semi-arid soils of India,” Environmental Monitoring and Assessment, vol. 136, no. 1–3, pp. 419–435, 2008. |
[12, 10]
. In order to make sound decisions about sustainable land use systems, information of soil quality interrelated to different land use scenarios is essential
| [13] | Sakbaeva Z., Acosta-Martinez V., Moore-Kucera J., Hudnall W., and Nuridin K., “Interactions of soil order and land use management on soil properties in the Kukart watershed, Kyrgyzstan,” Applied and Environmental Soil Science, vol. 2012, Article ID 130941, 11pages, 2012. |
[13]
. It is consequently most important to assess soil quality of different land management systems using visual soil examination and evaluation techniques since many of the factors that influence sustainable productivity are related to soil quality. Visual soil examination and evaluation techniques are procedures for visually and tactilely assessing soil structure. Techniques have been designed to examine both the topsoil and subsoil, focusing on the effect of management practices on soil quality
| [14] | Andrews S. S. and Carroll C. R., “Designing a soil quality assessment tool for sustainable agroecosystem management,” Ecological Applications, vol. 11, no. 6, pp. 1573–1585, 2001. |
| [15] | Guimaraes, R. M. L., Ball, B. C., Tormena, C. A., 2011. Improvements in the visual evaluation of soil structure. Soil Use and Management 27, 395–403. |
[14, 15]
. Visual soil examination and evaluation methods are fast to conduct, have the ability to holistically examine soil quality while generating immediate results by means of low-cost and simple equipment making them accessible to a range of users. Visual soil evaluation methods are applicable at the farm level and important for guiding farmers in making soil management decision
| [15] | Guimaraes, R. M. L., Ball, B. C., Tormena, C. A., 2011. Improvements in the visual evaluation of soil structure. Soil Use and Management 27, 395–403. |
| [16] | Shepherd, T. G., 2009. Visual Soil Assessment, Field Guide for Cropping and Pastoral Grazing on Flat to Rolling Country, vol. 1. Horizons Regional Council, Palmerston North, pp. 119 pp. |
[15, 16]
.
Information on soil quality can support to further prioritization and then device management plans that improve soil resources sustainably
| [10] | Masto R. E., Chhonkar P. K., Singh D., and Patra A. K., “Alternative soil quality indices for evaluating the effect of intensive cropping, fertilisation and manuring for 31 years in the semi-arid soils of India,” Environmental Monitoring and Assessment, vol. 136, no. 1–3, pp. 419–435, 2008. |
[10]
. The use of site-specific soil quality can help planners and decision makers to evaluate which land management system is most sustainable and vice-versa in a given situation
| [14] | Andrews S. S. and Carroll C. R., “Designing a soil quality assessment tool for sustainable agroecosystem management,” Ecological Applications, vol. 11, no. 6, pp. 1573–1585, 2001. |
| [17] | Gugino B. K., Idowu O. J., Schindelbecketal R. R., Cornell Soil Health Assessment Training Manual, Cornell University, Geneva, NY, USA, 2nd edition, 2009. |
[14, 17]
. Soil quality can deliver the necessary information for planners and decision makers to make up-to-date decisions against soil quality degradation using the overview of appropriate interventions. The experiment was initiated with the objectives, to assess and identify soil quality under both land management system.
2. Materials and Methods
2.1. Description of the Study Area
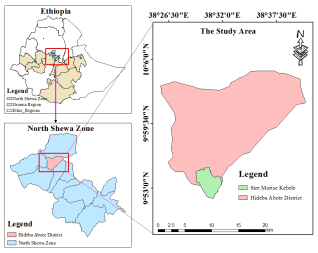
The study was conducted at Sire Morise kebele in Hidabu Abote district, North Shewa Zone, Oromia region. Geographically, the district located in the middle of 9°48'30''N and 10°4’40’’N latitude and 38°24'0''E and 38°40'12'' E longitude (
figure 1). The distance of the district is around 142 km in north of Addis Ababa and 30 km from Fitche town. The area coverage of the district is about 474 Km
2 (47,400 hectares)
| [18] | Hidebu Abote Agricultural and Natural Resource Office (HAANRO). 2016. Report about natural resource of Hidebu Abote to North Shoa Zone Agricultural and Natural Resource Office, Fitche, Ethiopia. |
[18]
.
Figure 1. Map of the study area.
Agroclimatic zones of the district are; Temperate (
Baddaa) lying between 2500 and 2900 meter above sea level, which accounted about 6% of the whole part of the district, Sub-tropical (
Baddaa daree) lying between 2300 and 2500 meter above sea level is accounting for about 44% of the whole area of the district and Tropical (
Gammoojjii) lying below 2200 meter above sea level is accounted about 50% of the entire lands of the district
| [18] | Hidebu Abote Agricultural and Natural Resource Office (HAANRO). 2016. Report about natural resource of Hidebu Abote to North Shoa Zone Agricultural and Natural Resource Office, Fitche, Ethiopia. |
[18]
. The mean annual temperature of the district varies between 13°C and 23°C, while the annual rainfall ranged between 1400 and 1600mm.
The district has two major kinds of soils, namely red and black soils. Red soil covers about 35% of the total area of the district and less fertile compared to black soil. It is more suitable for crops such as
Tef, Wheat, barley, Maize, Beans and others. Black soil on the other hand found on the flat areas of the district. The coverage of the black soil in this district is 51%. Other soils cover the remaining 14% of the whole area of the district
| [18] | Hidebu Abote Agricultural and Natural Resource Office (HAANRO). 2016. Report about natural resource of Hidebu Abote to North Shoa Zone Agricultural and Natural Resource Office, Fitche, Ethiopia. |
[18]
.
The remnants of the indigenous forests are observed scattered around farmlands and around churches and eucalyptus trees around residential areas. However, there are different types of vegetation species in the district. Some of the major species are
croton macrostachyus,
Daylilies Abssynica, Erythhrina Capenis, Euphorbia Abssynica, Euphorbia tirucalli, Ficus sur, Ficus comorus, Junipers, Luciana, Magnifier indicia, Militia ferruginca and Olea aficana and soon
| [18] | Hidebu Abote Agricultural and Natural Resource Office (HAANRO). 2016. Report about natural resource of Hidebu Abote to North Shoa Zone Agricultural and Natural Resource Office, Fitche, Ethiopia. |
[18]
.
The major land use/land cover of the district include cultivated lands, forest lands, shrub lands, grazing lands, settlements area, bare lands and other miscellaneous land uses. According to the District Land Administration and Use Office (2018) report, the proportion of land under different LULC ranging from 58.4% (covering 29,428 ha) in cases of cultivated lands to 0.7% (that covered 355 ha) in cases miscellaneous LULC types. The second LULC next to cultivated lands are settlements that covered 8,446.5 ha or account about 16.8% of the total LULCs and followed by shrub lands (4,236 ha), forest lands (4,032 ha), grazing (2,868 ha) and bare lands (1,016.4 ha).
2.2. Experimental Design and Soil Sampling
The experimental designs of the study containing two land management system and replicated three times in each land management system which were systematically situated across the slope position. The undisturbed soil samples were collected from both land management system at upper, middle and bottom part slope position of the land. Soil blocks were taken from each sampling points at two depths (0.10 × 0.15 × 0.10 m), using a straight shovel spade, totally 36 soil sample were collected from the studied land management practices (2 land management practices × 3 slope position × 2 sampling depth × 3 times replication).
2.3. Soil Laboratory Analysis
Soil bulk density, soil moisture content, air-filled porosity and saturated hydraulic conductivity of soil were determined using the collected undisturbed soil samples. Before the determination of those selected soil physical properties, excess soil was carefully removed by spatula and stored in fridge at 2°C. The cores samplers were covered with nylon cloth from the underneath, and saturated step by step with capillary water from beneath. Then, the saturated samples were used for the measurement of saturated hydraulic conductivity (Ksat) using constant head method as described in
| [19] | Klute, A. and Dirksen, C. 1986. Hydraulic Conductivity and Diffusivity. Part 1. In: "Methods of Soil Analysis", (Ed.): Klute, A.. 2 nd Edition, Agronomy Monograph, Vol. 9., American Society of Agronomy, Madison, WI, PP. 687-734. |
[19]
. The measurements of mean value of water discharge (Q) [mm
3 hr
-1] collected after it reached steady state, core sampler length (L) [mm], cross-sectional area of the core sampler (A) [mm
2], and hydraulic head (H) [mm], were used to determine the Ksat [mm hr
-1] using Darcy’s equation, which is given by:
Soil bulk density was ascertained by using the core method as described in
| [20] | Okalebo, J. R., Gathua, K. W., & Woomer, P. L. (2002). Laboratory methods of plant and soil analysis: a working manual. Tropical Soil Biology and Fertility Programme, Nairobi. |
[20]
, which calculated by balancing the oven dried soil samples at 105°C for 24 hours and divided the value to the volume of core sampler. Soil moisture content of soil was ascertained gravimetrically and converted to volumetric basis by multiplying it with bulk density of soil. Air filled porosity of soil was calculated from total porosity of soil and volumetric moisture content of soil.
2.4. Soil Quality Assessment
Soil quality assessments were conducted using three approaches of visual field examination of soil. The first visual field examination method is visual evaluation soil structure which described in
| [21] | Ball, B. C., Batey, T., Munkholm, L. J., 2007. Field assessment of soil structural quality development of the Peerlkamp test. Soil Use Manag. 23, 329 –337. |
[21]
. The methods of visual evaluation of soil structure focus on describing soil structure aggregates, soil porosity and rooting that relate to water holding capacity of soil and transport, root development and soil nutrient uptake. These visually assessed soil properties that include soil structure, rooting depth, soil texture, soil color and mottling allied to visually assessed location and farm management information
| [20] | Okalebo, J. R., Gathua, K. W., & Woomer, P. L. (2002). Laboratory methods of plant and soil analysis: a working manual. Tropical Soil Biology and Fertility Programme, Nairobi. |
| [21] | Ball, B. C., Batey, T., Munkholm, L. J., 2007. Field assessment of soil structural quality development of the Peerlkamp test. Soil Use Manag. 23, 329 –337. |
[20, 21]
. The scoring scale of soil structure ranges from 1 – very good soil structure, to 5 – poor soil structure.
The introduced a soil structure evaluation technique that was further developed by
| [21] | Ball, B. C., Batey, T., Munkholm, L. J., 2007. Field assessment of soil structural quality development of the Peerlkamp test. Soil Use Manag. 23, 329 –337. |
[21]
as visual soil structure assessment
| [22] | Peerlkamp, P. K., 1959. A visual method of soil structure evaluation. In: Meded, v. d. (Ed.), Land bouwhoge school en Opzoekings stations van de. Staat te Gent, XXIV No. 24, pp. 216–221. |
[22]
. This method uses a chart of structural qualities compared against a block of soil, which is extracted by spade and operated, in order to differentiate key factors for categorizing soil into one of the five categories and to give it a score from 1 (good soil structure) to 5 (poor soil structure). Visual explanations such as size, shape and appearance of soil aggregates, soil porosity, clustering, thickness and resist the growth of roots and difficulty in extracting the soil block were considered by the visual soil structure assessment method.
The third visual field examination method is Soil Quality Scoring Procedure
| [23] | Ball, B. C., Douglas, J. T., 2003. A simple procedure for assessing soil structural, rooting and surface conditions. Soil Use and Management 19, 50–56. |
[23]
which assess soil physical quality by focusing on soil surface condition, soil structure and crop rooting were assessed with reference to descriptive notes. The assigned score was based on aspects such as difficulty soil surface, soil aggregate type, size, shape, rupture resistance and rooting. The collected soil samples were graded on scale from 1-5 which the small score indicate poor soil structural quality and the large score indicate good soil structural quality.
For these visual field investigation approaches, blocks of soil samples were carefully dugout of the pulverized and place on plastic sheet. Then assess soil physical quality structure using three methods of visual field examination method. Soil surface condition were determined by looking the soil surface condition such as surface relief, the presence of living and non-living mulch, decomposition of biomass and the severity of soil erosion in the area. Soil aggregates shape and size were evaluated by seeing the soil blocks and by crumbling fragments. Aggregates can be small, rounded and friable, larger and more angular on the profile face. Soil porosity was determined by looking the soil blocks and assesses total pore space either between sand grains or aggregates or within fragments, tube-like worm, and/or root channels or vertical cracks. Root distribution of soil block were evaluated by seeing the soil blocks and assess the occurrence, amount and distribution of roots throughout the soil layer with no signs of restriction of root growth throughout soil profile. The score of soil quality was obtained by comparing observed soil structure with VESS score sheet.
The assigned score was based on features such as aggregate type and occurrence of roots inside and outside of soil aggregates, and number and size of visible pores then the aggregate were graded according to those observation. Visual Soil Assessment was done after dropping of soil blocks from one-meter height and evaluates soil structure quality based on evaluation of soil properties and soil indicators. The assessment of soil structural qualities which gives in a scoring of soil health and soil erosion activity, type and severity were used SQSP methods. Each indicator used in this method (soil texture classes, soil porosity, potential rooting depth and soil surface crusting and soil particle size proportion) was assigned a visual score of 0 (poor), 1 (moderate), 2 (good) and in between score (0.5 = moderately poor and 1.5 moderately good).
Revised the scoring criteria of visual soil structure assessment in order to make it more objective as visual evaluation of soil structure by focusing on the gradual decrease of soil aggregates and assessing their shape
| [20] | Okalebo, J. R., Gathua, K. W., & Woomer, P. L. (2002). Laboratory methods of plant and soil analysis: a working manual. Tropical Soil Biology and Fertility Programme, Nairobi. |
[20]
. Applied visual evaluation of soil structure and measured soil physical properties including bulk density, total porosity, penetration resistance, gravimetric moisture and the aggregate
| [24] | Mueller, L., Schindler, U., Shepherd, T. G., Ball, B. C., Smolentseva, E., Hu, C., Hennings, V., Schad, P., Rogasik, J., Zeitz, J., Schlindwein, S. L., Behrendt, A., Helming, K., Eulenstein, F., 2012. A framework for assessing agricultural soil quality on a global scale. Archives of Agronomy and Soil Science 58, S76–S82. |
[24]
.
2.5. Statistical Data Analysis
The statistical analysis of the experiment was done using analysis of variance (ANOVA) appropriate to general linear model (GLM). LSD (Least Significant Difference) test at P ≤ 0.05 was used for mean separation using R-Software. Regression analysis was used to correlate soil physical properties.
3. Results and Discussion
3.1. Soil Physical Properties of Area Closure and Open Grazing Land
The result of selected soil physical properties which determined from soil samples collected from both land management system at three slope position with the interaction effect of land management system and slope position difference, are shown in
Table 1.
Table 1. Selected soil physical properties under both land management system.
Soil depth (cm) | Soil parameters | Land management system | Slope positions | Land management system * Slope position |
Closed | Open | Bottom | Middle | Upper |
10 | BD (g/cm3) | 1.22a | 1.38b | 1.26a | 1.32b | 1.34c | NS |
| θw (cm3/cm3) | 0.40a | 0.34b | 0.41a | 0.39a | 0.31b | NS |
| AFP (cm3/cm3) | 0.14b | 0.16a | 0.12a | 0.14a | 0.19b | NS |
| Ksat (mm/hr) | 58.62a | 47.63a | 54.93a | 53.13a | 51.31a | NS |
20 | BD (g/cm3) | 1.23a | 1.38a | 1.26a | 1.28b | 1.34c | NS |
| θw (cm3/cm3) | 0.41a | 0.34b | 0.40a | 0.39b | 0.32a | NS |
| AFP (cm3/cm3) | 0.13a | 0.14a | 0.11a | 0.12a | 0.17a | NS |
| Ksat (mm/hr) | 55.95a | 48.17b | 55.13c | 54.71b | 46.34a | NS |
Means followed by the same letter are not significantly different (P 0.05), NS=non-significant. * indicates the interaction effect of land management and slope position
The findings of the experiment revealed that the higher mean value of bulk density was obtained at open grazing land management system and the lower mean value was bulk density was obtained at area closure land management system (
Table 1), which might be due to the trampling impact of the livestock population and direct impact of raindrops on the area. Overgrazing cause to the degradation of vegetation, compaction of soil, and wind and water erosion. All through taking of soil samples, soil crusting and sealing in the open grazing land management system was observed, which was caused due to nonexistence of vegetation cover which in turn increase bulk density. The results of the experiment agree with the finding of
| [25] | Bewket W, Stroosnijder L (2003) Effects of agro ecological land use succession on soil properties in the Chemoga watershed, Blue Nile basin, Ethiopia. Geoderma 111: 85-98. |
[25]
who stated that higher value of soil bulk density under open grazing land management system than area closure.
The result of determined soil bulk density indicated that statistically significant variation at P<0.05 levels among slope position at both sampling depths. The highest mean value of soil bulk density was obtained from upper slope position, the lowest from bottom slope and the intermediate mean value was obtained at middle slope position (
Table 1). This the lowest mean value of bulk density at the bottom slope position might be due to the land slope gradient which caused in decreases speed of the runoff and by this means enhanced sedimentation and organic matter development. The result of this study inline with the finding of
| [26] | Worku Hailu, Awdenegest Moges, Fantaw Yimer, 2012. The Effects of ‘Fanya juu’ Soil Conservation Structure on Selected Soil Physical & Chemical Properties: The Case of Goromti Watershed, Western Ethiopia Resources and Environment 2(4): 132-140. |
[26]
who stated that soil bulk density has a direct relation with slope gradient of the land which might be attributed to the corresponding decline in soil organic carbon content with the increase in slope steepness.
The result of volumetric soil moisture content revealed that statistically significant variation between area closures and open grazing land management system and also among slope positions at both sampling depths. The higher mean values of volumetric soil moisture content were associated with high organic matter content of soils under area closure than values observed in open grazing land soils. The result of this study in line with the finding of
| [27] | Kevin ZM, Nashon KRM, Dickson MN, Moses MN, Wellington NE, William MM, Agnes WMO (2011) Different land use types in the semi-arid rangelands of Kenya influence soil properties. University of Nairobi, Uganda. J Soil Sci Environ Manag 2 (11): 370–374. |
[27]
who indicated that the higher field moisture content of soil was observed through developments of soil structure in area under area closure land management system than open grazing land management system. It is also an established fact that the increasing the content soil organic matter increases water holding capacity of the soils
| [28] | Brady, N. C. and R. Weil, 2002. The nature and properties of soils. 13 thedition. Pearson Education, Inc., New Jersey, 960p. |
[28]
. The highest mean value of volumetric moisture content of soil was obtained at the bottom slope position with intermediate value at the middle and lowest at the upper slope position for both sampling depths (
Table 1).
The result of the study revealed that, higher mean value of air-filled porosity was obtained at open grazing land management system than area closure land management system at both sampling depths (
Table 1). The lower mean value of air-filled porosity of area closure land management practice might be due to more pore space of soil was filled by water. The highest mean value of air-filled porosity was obtained at upper slope position, intermediate at the middle and the lowest mean value was obtained at bottom slope position at both sampling depths (
Table 1). The result of lower air-filled porosity at bottom slope position of the land shows that high soil moisture content of deposited soil at the bottom of slope position of the land.
The result of the study indicated that, higher mean value of saturated hydraulic conductivity of soil was observed under area closure land management system than open grazing land management system at both sampling depths (
Table 1). This might be due to high porosity and organic matter content of soil at area closure and also open grazing land management system soil might be compacted due to trampling impact of livestock.
The result of study showed that, the decrease in soil porosity in the compacted areas, following livestock trampling effect of soil, was strongly associated with an increase of soil penetration resistance and a decrease in hydraulic conductivity
| [29] | Marsili, A (1998). Changes of some physical properties of a clay soil following the passage of rubber and metal tracked tractors. Soil Till. Res. 49, 185– 199. |
[29]
. Soil compaction changes the ability of soil saturated hydraulic conductivity and increases penetration resistance of soil
| [30] | Shafiq, M., Hassan, A., Ahmad, S., 1994. Soil physical properties as influenced by induced compaction under laboratory and field conditions. Soil Till. Res, 29, 13–22. |
[30]
.
The result of soil saturated hydraulic conductivity (Ksat) in the study shows that, there was no significant variations at p<0.05 among slope positions. The highest mean value of saturated hydraulic conductivity was obtained at bottom part of the slope position at both sampling depths (
Table 1). This might be due to higher organic matter content of soil at bottom slope position due to the consequence of soil erosion which removes fertile soil from the upper part of slope position. In this study there was no significant interaction effect between land management system and slope position for the examined soil physical properties at both sampling depths (
Table 1).
3.2. Soil Quality of Land Management System
The results of visual field examination of soil structural qualities assessed using three different techniques are presented in
Table 2. The evaluation was conducted simultaneously at the field.
Table 2. Results of visual soil quality assessment using three techniques.
Land management system & Slope position | Depth (cm) | SQSP | VESS | VSA |
Surface condition | Structure score | Rooting score | Block score | Structure score | Soil structural quality | Soil porosity (%) | Fine Soil % age |
Area closure | 10 | 4.0 | 4.3 | 4.1 | 4.2 | 1.2 | 1.6 | 56 | 40 |
20 | | 4.0 | 3.6 | 4.0 | 1.4 | 1.2 | 50 | 38 |
Open grazing land | 10 | 2.0 | 1.2 | 2.0 | 1.8 | 2.8 | 0.6 | 40 | 20 |
20 | | 2.0 | 1.6 | 2.2 | 2.8 | 1.0 | 44 | 28 |
Bottom | 10 | 4.3 | 4.0 | 4.0 | 4.0 | 1 | 1.6 | 56 | 40 |
20 | | 4.0 | 3.8 | 4.0 | 1.3 | 1.4 | 52 | 32 |
Middle | 10 | 2.4 | 3.4 | 3.2 | 2.3 | 2.3 | 1.2 | 48 | 22 |
20 | | 2.6 | 2.1 | 3.3 | 2.1 | 1.0 | 48 | 32 |
Upper | 10 | 2.0 | 2.0 | 2.3 | 2.0 | 2.7 | 0.6 | 42 | 18 |
20 | | 2.2 | 2.1 | 2.3 | 2.7 | 0.8 | 40 | 20 |
3.3. Soil Quality Score Procedure Method
3.3.1. Surface Condition
Based on the result of the study sticking, neither of visible nor slight micro relief, but decomposing vegetation was present on the soil surface of area closure land management system, which provides a good surface these score for these soils (
Table 2). In contrast, soils of open grazing land management system and upper slope position had unfavorable surface score. The soils surface of open grazing land management system had some vegetation coverage, overgrown land, and soil crusting along the plot, which are features present in soil with an unfavorable physical soil quality. In this, the presence overgrazing of high population of cattle on open grazing land management system results in a compaction of soil from the trampling effect of cattle. The finding of the study in line with the finding of
| [31] | Pimental, D. (2012). Soil erosion effects on farm economics in M. Beradi (ed) soil loss processes, polices and prospects. West view press, boulder, colorado pine ecosystems. Soil Biol. Biochem. 5: 19-39. |
[31]
who pointed out that reductions in plant cover caused by open grazing and the trampling effect can degrade soil structure.
3.3.2. Structure of Soil Block Score
The results in
table 2 indicated that the score of soil structure qualities was favorable in soils of area closure land management system and bottom slope position. This quality is attributed to the domination of a fine friable soil structure underneath. In some blocks of soils, macro-pores were not observable to the naked eye, but limited number of earthworm burrows were not present. Unfavorable soil structure score was given to the soils of open grazing land management system and upper slope position because of the domination of angular blocky soil structure type, the high resistance against rupture of the field moist soil aggregates, and low soil porosity of open grazing land management system and upper slope of the land. This could be due to the compaction of soil which caused by trampling effect of soil by the cattle and removal of fertile soil from upper part of soil surface.
3.3.3. Rooting of Soil Block Score
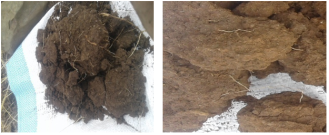
In the study area, number of roots, size, distribution and bending of roots were important features to separate scores in each soil block (
figure 2). Root distribution was constant along with the soil blocks in area closure land management system and at the bottom slope position. Moreover, root growth was not restricted in area closure land management system whereas; root growth was restricted in the soil blocks under open grazing land management system due to compaction of soil.
Figure 2. Root distribution in soil blocks of Area closure (left) and open grazing land (right).
3.3.4. Soil Block Structural Quality Score
From the result of the study, soil structure score and soil rooting score observed from block score were good for area closure land management system and bottom slope position soils; moderate for middle slope position soil and not good for open grazing land management system soil respectively
(Table 2).
This means that interaction between the slope position of land and management practices/system with the soil structures predominant in each soil contribute in sustaining a favorable quality of the soil structure. There were not physical restrictions present for plant growth in area closure land management system soils. In open grazing land soil and upper slope position, the soil block score indicated that a poor soil structural quality. The result of this study shows that, soil compaction, soil erosion and soil crusting were existing on the soil of open grazing land management system and upper slop position. The degradation condition of this soil restricts the root development of the vegetation. This result suggesting that, immediate measures should be taken to improve the proper functioning of soil.
3.4. Visual Evaluation of Soil Structure Method
According to the lower scores in the visual key, soil quality (Sq) = 1 and Sq =2, indicates high soil quality. Most soil aggregates were cubic shape in the open grazing land management system and round shaped in the area closure land soils. In this soil high observable pores and the cube formed in the aggregate fragments of the soil’s blocks were aspects for increasing and decreasing of the scores. The difference in dimensions and appearance of aggregate in soil were the most crucial features to distinguish soil quality as visual indicators. In area closure land management system and bottom slope position soil, the majorities of the aggregates obtained were fragile and rounded by their shape. Under area closure land management system soils the clods were not present, most soil aggregates were porous and roots were well distributed along the soil blocks, subsequently this soil had favorable soil quality. According to the classification ranges suggested by
| [21] | Ball, B. C., Batey, T., Munkholm, L. J., 2007. Field assessment of soil structural quality development of the Peerlkamp test. Soil Use Manag. 23, 329 –337. |
[21]
soil structure quality score values of area closure land was categorized under good soil structural quality score and score value of open grazing land soil structural quality was categorized under intermediate soil structural quality score (
Table 2).
3.5. Visual Soil Assessment Method
Based on the result of the study, (
table 2) visual soil assessment provides good soil structural quality score for soil blocks after dropping of soil blocks. It was concluded that, soil structure quality, soil porosity, and proportion of soil particles were the major the indicators of soil quality.
3.5.1. Soil Structural Quality
The abundance of a certain kinds of soil aggregates was tested after dropping the soil block. The block of soil was used to visually designate the aggregate size distribution (
Table 2). The soils which have higher proportion of coarsest fraction of soil have lower soil structure quality. Sub-angular blocky aggregates and sharper edges were abundant in the open grazing land management system soil and in contrast rounded and crumbly aggregates were abundant in area closure land management system. The overall visual type of aggregates score showed that area closure has good soil structure than open grazing land management system and also among slope position, bottom slope position have good soil structure than middle and upper part of slope positions.
3.5.2. Soil Porosity
Soil in area closure land management system had been high porosity and open grazing land management system soils had been poor porosity and also bottom, middle, upper slope position showed good, moderate and poor soil porosity respectively (
Table 2). This poor soil porosity of open grazing land soil might be due to the compaction of soils resulted from the impact of livestock which cause to destabilization of soil structure as a consequence of decrease in soil porosity and lower in organic matter content. In area closure land management system and bottom slope position of the land, the occurrence of bio-pores in the majority of the soil blocks contributed to a higher score for soil porosity than other.
3.5.3. Fine Soil Percentage of the Block
Aggregate size distribution was visually described by soil fragments obtained after dropping the soil block and the contrasting layers existing on soil block might not be observed. Accordingly, the coarsest fraction of soil aggregates was larger than the finest fraction in soils, open grazing land management system soil and upper slope position. Therefore, the lower quality of the soil structure might be due to the higher proportion of the coarsest fraction in the soil and one can concluded that, structure in open grazing land soil was poor.
Table 3. Comparison of indicators and indices of soil using three visual field assessment methods.
Land management system & Slope position | SQSP | VESS | VSA |
Soil surface | Soil structure | Rooting | Soil structure quality score | structure quality score | Structure quality score | Soil structure |
Area closure | No relief/ smooth | Friable | No restriction | Well structural development | Unbroken/firm | Well | Well |
Open grazing land | Rough/ irregular surface | Friable/ firm | Restriction | Poor structure development | compact | Poor | Poor |
Upper slope position | Smooth with ridges | Friable | Restriction | Moderate structural development | compact | Poor | Poor |
Middle slope position | No relief/ smooth | Friable | No restriction | Well structural development | Unbroken/firm | Good | Good |
Bottom slope position | No relief/ smooth | Friable | No restriction | Well structural development | Unbroken/firm | Well | Well |
In this study, it was concluded that humble indicators permit the evaluation of soil compaction. Based on the result obtained; the presence of clods, high rupture resistance, lower soil porosity in to aggregate’s faces, limited root growth, variation resulted in aggregate shape, difficult extractable soil block and disruption of soil aggregates as well. Therefore, the three visual soil assessments were accomplished to differentiate the compacted soils and well-structured soil properties in the study area
(Table 3). This supports that the identification of soil compaction can be conducted directly in the field
| [32] | Batey, T., McKenzie, D. C., 2006. Soil compaction: identification directly in the field. Soil Use and Management 22, 414. |
[32]
.
According to visual assessment in the field, soil physical qualities were unfavorable in open grazing land management system and upper part of slope position soils, where the scores of soil quality score procedure extended between 1(poor structural development) to 3 (moderate structural development), visual evaluation of soil structure score vary between 2 (compact) to 3 (very compact) and visual soil assessment scores were between 0.5 (moderately poor) and 1.5 (moderately good)
Table 3. The poor soil quality was found on an open grazing land and upper slope position soils, characterized by trampling effect and low soil organic carbon (
Table 3).
In general, the visual evaluation of soil structure and visual soil assessment scores indicated that the soils under area closure had a well soil structural quality (
Tables 2 and 3). On the other hand, soils under open grazing land showed that a damaging impact on soil structure. This is dependable with a general understanding of the influence of the livestock activities on soil structural quality.
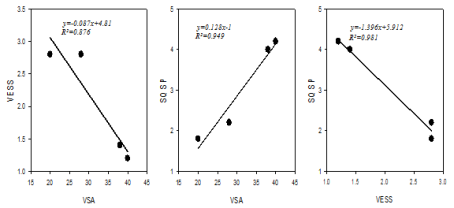
3.6. Relationship Between Visual Field Assessment Methods
Since field assessment methods are relatively inexpensive and produce instant results that correlate well with quantitative measurements of physical and chemical soil properties as well as easily understood methods even by farmers and middle level professionals, it is worthwhile to establish relationships with already proven methods of assessing soil physical qualities that is variables determined from laboratory measurements. To this end, a simple regression analysis was used to develop relationships of laboratory measured properties and field obtained scores through three visual assessment method.
Figure 3. Simple regression of the visual field assessments methods.
Based on the result displayed on
figure 3 can be conclude that there were strong relationships among these assessment methods. In VESS method, low score indicates better soil quality than with high score. In other two methods the opposite trend holds true. Thus, the relationships between VESS and two other methods had decreasing trends (
Figure 3) and strong as well as significant (VESS=-1.396 SQSP+5.912, p<0.05, R
2=0.98; VESS=-0.087VSA+4.81, p<0.05, R
2=0.876). The relationship between SQSP and VSA was positive and strong (R
2=0.949, p<0.05;
Figure 3). Similarly,
| [33] | Moncanda, M. P., Penning, Timm, L. C., Gabriels, D., Cornelis, W., 2014. Visual examination and soil physical and hydraulic properties for assessing soil structural quality of soil with contrasting textures and land uses. Soil Tillage Res. 140, 20-28. |
[33]
conducted visual assessment for structural quality of tropical soils and concluded the positive and strong (R
2=0.949, p<0.05;
Figure 3) correlation between SQSP and VSA.
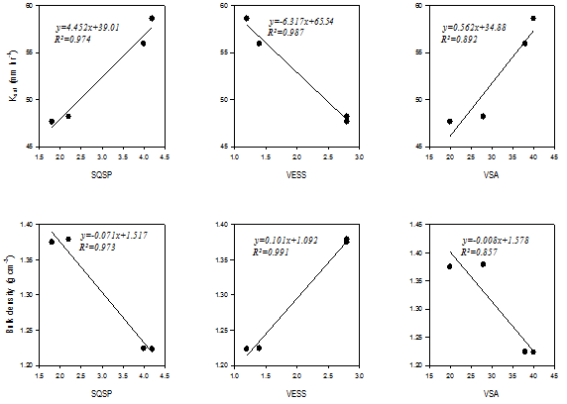
3.7. Relationships of Laboratory Analyzed Parameters and Field Assessment Methods
From the
figure 4, Shows that there were strong and positive correlation among visual evaluation methods and laboratory determined soil physical properties of both land management system. Hence, the relationships between saturated hydraulic conductivity and VESS had decreasing trends but relationships between saturated hydraulic with other two methods (SQSP and VSA) had increasing trends (
Figure 4) and strong as well as significant (Ksat= 4.452 SQSP+39.01, p<0.05, R
2=0.974; Ksat=0.562VSA+34.88, p<0.05, R
2=0.812). The relationship between Ksat and VESS was negative and strong (R
2=0.987, p<0.05
Figure 4). The higher mean value of saturated hydraulic conductivity of soils indicate good soil structural quality due to small structural quality score whereas; the lower mean value of saturated hydraulic conductivity of soils indicate poor soil structural quality due to larger soil structural quality score under visual evaluation soil structure. There was a positive and strong correlation between saturated hydraulic conductivity and SQSP and VSA.
Figure 4. Relationship between visual field assessments and laboratory determination method.
In contrast, the relationships between bulk density and VESS had increasing trends and relationships among bulk density and other two methods (SQSP and VSA) had decreasing trends (
Figure 4) and strong as well as significant (BD= -0.071SQSP+1.517, p<0.05, R
2=0.973; BD=-0.008VSA+1.578, p<0.05, R
2=0.857 respectively). The correlation of bulk Density and VESS was positive and strong (R
2=0.991, p<0.05;
Figure 4). This might be due to small structural quality score indicate good soil structural quality and lower mean value of bulk density which indicates good bulk density of soil and large score indicates poor soil structural quality and higher mean value of bulk density of soil which indicates poor bulk density of soil under visual evaluation soil structure. Whereas, the relationship between bulk density of soil and two other methods (SQSP and VSA) indicates there were negative and strong relationships. This might be due to large score indicate good soil structural quality and lower mean value of bulk density which indicates good soil bulk density and small score indicate poor soil structural quality and also higher mean value of soil bulk density which indicates poor soil bulk density under the two methods.
Based on visual soil results, the interaction effect of visual soil scores and soil properties were presented in (
Figure 4). These relationships were developed from the mean values of soil physical property analysis with visual soil structural quality score. Accordingly, significant differences were observed between visual scores and saturated hydraulic conductivity and bulk density of soil in the study area.
Visual field survey provides more evidences as quantitative research approaches (i.e. saturated hydraulic conductivity and bulk density) of soil. Furthermore, determination of these soil physical properties helps to have a quantitative data at specific depths, then having visual evaluation alone. One can argue that using both methods is better than sticking to the classical laboratory methods.