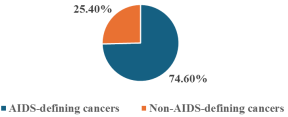
Human infection with HIV compromises the immune system and reduces the body’s ability to fight viral infections that may promote the development of certain types of cancers. The diagnosis of AIDS-defining cancers in PLHIV indicates the progression of an HIV infection to the AIDS stage. Non-AIDS-defining cancers occur in HIV-positive individuals without necessarily being caused or exacerbated by HIV infection. WHO estimates that 39.9 million are PLHIV, whereas 42.3 million lives have been lost to HIV. Kenya’s HIV prevalence was 3.3% and in Nairobi, 4.3%. NCD mortalities in Kenya were 39%, including cancers, up from 27% and HIV remains a major risk factor. This study’s main purpose was to identify the predictors of AIDS-defining and non-AIDS-defining cancers among PLHIV accessing services in selected hospitals in Nairobi City County, Kenya. An analytical cross-sectional design was used. Study sites were purposively selected, whereas a simple random method was used to select 406 adults, aged 18 years and above, HIV positive and on ART. The study was conducted in seven selected facilities in Nairobi County. Quantitative data were collected using semi-structured questionnaires, whereas qualitative data were obtained from seven key informant interviews and three focus group discussions. Descriptive statistics (percentages, graphs, and charts) and inferential statistics (chi-square and logistic regression models) were performed using SPSS v. 27. Qualitative data were transcribed, coded, and grouped into themes. AIDS-defining cancers were the most prevalent (74.6%) among PLHIV accessing services in the selected hospitals. A Pearson’s Chi-square (X2) test revealed that socio-demographic characteristics such as sex (p = 0.00), age in years (45-54 for AIDS-defining cancer and 65 and above for Non-AIDS-defining cancers) (p = 0.00), marital status (married and widowers for ADC and NADC, p = 0.02) and level of education (secondary and ‘other’ for ADC and NADC respectively; p = 0.005) were associated with the type of cancer development among people living with HIV. A binary logistic regression model found that age (χ2(5) = 14.96, p = 0.011), income level (X2 (5) = 9.96; p = 0.076), history of cigarette smoking (B = 1.53; p = 0.001; OR = 4.638; 95% CI: 2.28 – 9.42), alcohol consumption (B = 0.295; p = 0.356), family history of cancers (B = 1.04; p = 0.001; OR = 2.827; 95% CI: 1.61 – 4.97), were statistically associated with AIDS and non-AIDS-defining cancers. These findings will help formulate programmatic and policy interventions for ADC and NADC among PLHIV.
| Published in | Science Journal of Public Health (Volume 13, Issue 6) |
| DOI | 10.11648/j.sjph.20251306.15 |
| Page(s) | 354-368 |
| Creative Commons |
This is an Open Access article, distributed under the terms of the Creative Commons Attribution 4.0 International License (http://creativecommons.org/licenses/by/4.0/), which permits unrestricted use, distribution and reproduction in any medium or format, provided the original work is properly cited. |
| Copyright |
Copyright © The Author(s), 2025. Published by Science Publishing Group |
AIDS-defining Cancers, Non-AIDS-defining Cancers, HIV, Predictors, Prevalence
acility | Type of Facility | PLHIV on ART | PLHIV on ART with a type of cancer | Proportion of sampled study participants (60%) |
|---|---|---|---|---|
DREAM Centre Medical Clinic | Private | 3346 | 25 | 15 |
Kangemi Health Centre | Public | 2316 | 12 | 7 |
Langata Sub-County Hospital | Public | 1275 | 28 | 17 |
Mama Lucy Kibaki Hospital | Public | 3152 | 61 | 37 |
Mbagathi County Referral Hospital | Public | 4659 | 61 | 37 |
St Mary’s Mission Hospital, Langata | Faith Based | 3120 | 16 | 10 |
Texas Cancer Centre | Private | 2340 | 471 | 283 |
Nairobi County (Total) | 20,208 | 674 | 406 |
Variable | Category | Frequency (n=406) | Proportion (%) |
|---|---|---|---|
Sex | Male | 74 | 18.2 |
Female | 332 | 81.8 | |
Age in Years | 18 - 24 | 11 | 2.7 |
25 - 34 | 46 | 11.3 | |
35 - 44 | 101 | 24.8 | |
45 - 54 | 132 | 32.5 | |
55 - 64 | 64 | 15.7 | |
≥ 65 | 52 | 12.8 | |
Marital Status | Married | 243 | 59.8 |
Single | 62 | 15.2 | |
Widows | 44 | 10.8 | |
Divorced | 39 | 9.6 | |
Never Married | 13 | 3.2 | |
Widower | 5 | 1.2 | |
Religion | Christians | 360 | 88.6 |
Muslims | 46 | 11.4 | |
Education | Primary | 49 | 12.0 |
Secondary | 183 | 45.0 | |
Tertiary | 170 | 41.8 | |
None | 2 | 0.49 | |
Others | 2 | 0.49 | |
Employment Status | Employed | 133 | 32.7 |
Self-employed | 194 | 47.7 | |
Retired | 20 | 4.9 | |
None | 54 | 13.3 | |
Others | 5 | 1.4 | |
Average monthly income (Kshs.) | Below 10,000 | 114 | 28.1 |
10,000-49,999 | 186 | 45.8 | |
50,000-100,000 | 84 | 20.7 | |
Above 100,000 | 22 | 5.4 |
Type of Cancer | Frequency | Percentage (%) | Cancer Typology |
|---|---|---|---|
266 | 65.5 | ADC | |
Cervical Cancer | 43 | 10.6 | NADC |
Breast Cancer | 24 | 5.9 | ADC |
Lymphoma | 13 | 3.2 | ADC |
Kaposi Sarcoma | 8 | 2.0 | NADC |
Ovarian Cancer | 7 | 1.7 | NADC |
Oesophageal Cancer | 5 | 1.2 | NADC |
Prostate Cancer | 3 | 0.7 | NADC |
Liver Cancer | 3 | 0.7 | NADC |
Colorectal Cancer | 3 | 0.7 | NADC |
Gastric Cancer | 3 | 0.7 | NADC |
Nasopharyngeal Carcinoma | 2 | 0.5 | NADC |
Brain Cancer | 2 | 0.5 | NADC |
Abdominal Cancer | 2 | 0.5 | NADC |
Kidney Cancer | 2 | 0.5 | NADC |
Lung Cancer | 2 | 0.5 | NADC |
Oral Cavity Cancer | 2 | 0.5 | NADC |
Pancreatic Cancer | 1 | 0.2 | NADC |
Cancer of the Oesophagus | 1 | 0.2 | NADC |
Gall Bladder Cancer | 1 | 0.2 | NADC |
Gastrointestinal Stromal Tumour (GIST) | 1 | 0.2 | NADC |
Leukemia | 1 | 0.2 | NADC |
Bladder Cancer | 1 | 0.2 | NADC |
Multiple Myeloma | 1 | 0.2 | NADC |
Retinoblastoma | 1 | 0.2 | NADC |
Skin Cancer | 1 | 0.2 | NADC |
Stomach Cancer | 1 | 0.2 | NADC |
Bone Cancer | 1 | 0.2 | NADC |
Throat Cancer | 1 | 0.2 | NADC |
Cancer of the Nose | 1 | 0.2 | NADC |
Colon Cancer | 1 | 0.2 | NADC |
Total | 406 | 100 |
Type of Cancer | Sex | Frequency | Percentage (%) | Typology |
|---|---|---|---|---|
Cervical Cancer | F | 266 | 98 | ADC |
Prostate Cancer | M | 5 | 2 | NADC |
Variable | ADC | NADC | Sub-total (n1+n2) | Proportion of the total (N=406) (%) | d.f. | Chi-square | p Value |
|---|---|---|---|---|---|---|---|
n1 (303) | n2 (103) | ||||||
Sex | |||||||
Male | 55 | 19 | 74 | 18.2 | 1 | 74.55 | 0.00 |
Female | 248 | 84 | 332 | 81.8 | |||
Age in Years | |||||||
18 - 24 | 8 | 3 | 11 | 2.7 | 5 | 29.64 | 0.00 |
25 - 34 | 34 | 12 | 46 | 11.3 | |||
35 - 44 | 75 | 26 | 101 | 24.8 | |||
45 - 54 | 98 | 34 | 132 | 32.8 | |||
55 - 64 | 48 | 16 | 64 | 15.7 | |||
65 and above | 39 | 13 | 54 | 12.7 | |||
Marital Status | |||||||
Divorced | 29 | 10 | 39 | 9.6 | 5 | 13.19 | 0.02 |
Married | 181 | 62 | 243 | 60 | |||
Never Married | 10 | 3 | 13 | 3.2 | |||
Single | 46 | 16 | 62 | 15.2 | |||
Widow | 33 | 11 | 44 | 10.8 | |||
Widower | 4 | 1 | 5 | 1.2 | |||
Religious Affiliation | |||||||
Christians | 269 | 91 | 360 | 88.7 | 1 | 0.70 | 0.25 |
Muslims | 34 | 12 | 46 | 11.3 | |||
Level of Education | |||||||
Primary | 37 | 12 | 49 | 12 | 4 | 14.69 | 0.04 |
Secondary | 137 | 46 | 183 | 44.8 | |||
Tertiary | 127 | 43 | 170 | 42.2 | |||
Others | 2 | 0 | 2 | 0.5 | |||
None | 2 | 0 | 2 | 0.5 | |||
Variable | ADC | NADC | Sub-total (n1+n2) | Proportion of the total (N=406) (%) | d.f. | Chi-square | p Value |
|---|---|---|---|---|---|---|---|
n1 (303) | n2 (103) | ||||||
Employment Status | |||||||
Employed | 99 | 34 | 133 | 32.8 | 4 | 30.37 | 0.00 |
Self-employed | 145 | 49 | 194 | 47.8 | |||
Retired | 15 | 5 | 20 | 4.9 | |||
Others | 44 | 15 | 59 | 14.5 | |||
Level of income | |||||||
Below 10,000 | 85 | 29 | 114 | 28.0 | 4 | 9.12 | 0.1 |
10,000-49,999 | 139 | 47 | 186 | 45.8 | |||
50,000-100,000 | 63 | 21 | 84 | 20.6 | |||
Above 100,000 | 16 | 6 | 22 | 5.4 | |||
Type of Industry | |||||||
All (Manufacturing, Service, Agriculture, Military, Casuals) | 303 | 103 | 406 | 100 | 102 | 132.93 | 0.021 |
Workplace Exposure to Hazards | |||||||
Yes | 24 | 8 | 32 | 7.8 | 1 | 0.00 | 0.57 |
No | 279 | 95 | 374 | 92.2 | |||
Variable | ADC | NADC | Sub-total (n1+n2) | Proportion of total (N=406) (%) | d.f. | Chi-square | p Value |
|---|---|---|---|---|---|---|---|
n1 (303) | n2 (103) | ||||||
Cancer diagnosis before or after knowing HIV status | |||||||
Yes, after knowing my HIV status | 290 | 37 | 327 | 80.5 | 1 | 175.32 | 0.00 |
No, before knowing HIV status | 13 | 66 | 79 | 19.5 | |||
Ever smoked a cigarette before diagnosis? | |||||||
Yes | 26 | 39 | 65 | 16 | 1 | 49.02 | 0.00 |
No | 277 | 64 | 341 | 84 | |||
Duration of smoking before cancer development | |||||||
< 1 year | 1 | 0 | 1 | 0.2 | 4 | 64.66 | 0.00 |
1 - 5 years | 11 | 7 | 18 | 4.4 | |||
5 - 10 years | 4 | 1 | 5 | 1.2 | |||
More than 10 years | 10 | 31 | 41 | 10.0 | |||
None | 277 | 64 | 341 | 84.0 | |||
Duration without smoking before cancer development | |||||||
5 -10 years | 1 | 0 | 1 | 0.2 | 1 | 0.34 | 0.74 |
None | 302 | 103 | 405 | 99.8 | |||
Alcohol intake before cancer development | |||||||
Yes | 122 | 69 | 191 | 47 | 1 | 22.04 | 0.00 |
No | 181 | 34 | 215 | 53 | |||
Duration of alcohol consumption before cancer development | |||||||
< 1 year | 4 | 2 | 6 | 1.4 | 4 | 43.46 | 0.00 |
1 - 5 | 24 | 9 | 33 | 8.1 | |||
5 - 10 | 48 | 12 | 60 | 14.8 | |||
More than 10 years | 44 | 46 | 90 | 22.3 | |||
None | 183 | 34 | 217 | 53.4 | |||
Duration without alcohol before cancer development | |||||||
1 - 5 years | 1 | 0 | 1 | 0.2 | 1 | 0.34 | 0.74 |
None | 302 | 103 | 405 | 99.8 | |||
Family History of Cancer | |||||||
Yes | 125 | 178 | 303 | 74.6 | 1 | 23.5 | 0.00 |
No | 71 | 32 | 103 | 25.4 | |||
Multiple Sexual Partners | |||||||
Yes | 204 | 99 | 303 | 74.6 | 1 | 1.99 | 0.09 |
No | 77 | 26 | 103 | 25.4 | |||
Frequency of Exercise | |||||||
Regularly | 69 | 33 | 102 | 25.1 | 2 | 6.95 | 0.031 |
Rarely | 141 | 51 | 192 | 47.2 | |||
Never | 93 | 19 | 112 | 27.5 | |||
Sexual Violence Experience | |||||||
Yes | 28 | 11 | 39 | 9.6 | 1 | 0.18 | 0.39 |
No | 275 | 92 | 367 | 90.4 | |||
Prior Other Viral Infections | |||||||
Yes | 131 | 31 | 162 | 40 | 1 | 5.53 | 0.01 |
No | 172 | 72 | 244 | 60 | |||
Prior Non-Viral Infections | |||||||
Yes | 211 | 76 | 287 | 70.6 | 1 | 0.63 | 0.25 |
No | 92 | 27 | 119 | 29.4 | |||
Variable | ADC | NADC | Sub-total (n1+n2) | Proportion of total (N=406) (%) | d.f | Chi-square | p Value |
|---|---|---|---|---|---|---|---|
n1 (303) | n2 (103) | ||||||
Facility utilization and access: Frequency of facility visits before diagnosis: | |||||||
Annually | 80 | 50 | 130 | 32 | 3 | 20.86 | 0.00 |
Quarterly | 199 | 42 | 241 | 59.4 | |||
Bi-annually | 23 | 10 | 33 | 8.1 | |||
Never | 1 | 1 | 2 | 0.5 | |||
Accessibility of health facilities | |||||||
Yes accessible | 284 | 95 | 379 | 93.3 | 1 | 0.27 | 0.37 |
Not accessible | 19 | 8 | 27 | 6.7 | |||
Prior screening before diagnosis | |||||||
Yes | 182 | 21 | 203 | 50 | 1 | 48.40 | 0.00 |
No | 121 | 82 | 203 | 50 | |||
Screening offered in the same hospital | |||||||
Yes | 156 | 15 | 171 | 42.1 | 2 | 44.0 | 0.00 |
No | 27 | 12 | 39 | 9.6 | |||
NA | 120 | 76 | 196 | 48.3 | |||
Reasons for not being screened | |||||||
Screening services not available | 79 | 68 | 14 | 36.2 | 5 | 67.59 | 0.00 |
User fee needed | 15 | 11 | 26 | 6.4 | |||
Declined | 14 | 2 | 16 | 3.9 | |||
No trained HCW | 26 | 4 | 30 | 7.4 | |||
Unaware | 9 | 3 | 12 | 3.0 | |||
NA | 160 | 15 | 175 | 43.1 | |||
Access to treatment within the facility | |||||||
Yes | 45 | 5 | 50 | 12 | 2 | 9.12 | 0.01 |
No | 257 | 99 | 356 | 88 | |||
Immediate treatment initiation | |||||||
Yes | 28 | 4 | 32 | 7.5 | 3 | 10.59 | 0.01 |
No | 60 | 11 | 71 | 17.5 | |||
NA | 214 | 89 | 303 | 75 | |||
Accessing treatment challenges | |||||||
Lack of commodities and trained personnel | 62 | 47 | 109 | 26.9 | 5 | 37.97 | 0.00 |
Lack of treatment commodities | 156 | 49 | 205 | 50.5 | |||
Lack of trained HCW’s | 53 | 4 | 57 | 14.0 | |||
Declined | 4 | 0 | 4 | 1.0 | |||
NA | 28 | 3 | 31 | 7.6 | |||
Referral for treatment | |||||||
Yes, to a higher facility | 60 | 8 | 68 | 16.7 | 5 | 17.48 | 0.04 |
Yes, to an Oncology specialist | 217 | 94 | 311 | 76.6 | |||
Not referred | 16 | 1 | 17 | 4.2 | |||
Declined | 2 | 0 | 2 | 0.5 | |||
NA | 8 | 0 | 8 | 2 | |||
Variable | χ² | B | SE | Wald | P value | OR | 95% CI Lower | 95% CI Upper |
|---|---|---|---|---|---|---|---|---|
Overall | 86.72 | 0.001 | ||||||
Age (Overall) | 14.96 | 0.011 | ||||||
Age 18-24 (ref) | 0.297 | 0.790 | 0.141 | 0.707 | 1.345 | 0.29 | 6.21 | |
Age 25-34 | -1.542 | 0.617 | 6.244 | 0.012 | 0.214 | 0.07 | 0.69 | |
Age 35-44 | -1.836 | 0.520 | 12.446 | 0.000 | 0.160 | 0.06 | 0.43 | |
Age 45-54 | -1.234 | 0.466 | 7.020 | 0.008 | 0.291 | 0.11 | 0.73 | |
Age 55-64 | -0.822 | 0.480 | 2.925 | 0.087 | 0.440 | 0.17 | 1.12 | |
Income (Overall) | 9.96 | 0.076 | ||||||
Income (Ref: Lowest Bracket) | 0.839 | 0.601 | 1.953 | 0.162 | 2.315 | 0.74 | 7.19 | |
Income (Ksh. 50,000-100,000) | 0.579 | 0.491 | 1.393 | 0.238 | 1.785 | 0.69 | 4.59 | |
Income (Ksh. 100,000-200,000) | 0.900 | 0.547 | 2.705 | 0.100 | 2.460 | 0.83 | 7.34 | |
Income (Ksh. 200,000-500,000) | 1.514 | 0.539 | 7.888 | 0.005 | 4.543 | 1.59 | 13.00 | |
Income (Above Ksh. 500,000) | 0.603 | 0.692 | 0.761 | 0.383 | 1.828 | 0.46 | 7.22 | |
Smoking History (Ever Smoked) | 18.17 | 1.534 | 0.360 | 18.17 | 0.000 | 4.638 | 2.28 | 9.42 |
Alcohol Use (Ever Taken Alcohol) | 0.295 | 0.320 | 0.852 | 0.356 | 1.343 | 0.72 | 2.52 | |
Family History of Cancer | 12.84 | 1.039 | 0.290 | 12.842 | 0.000 | 2.827 | 1.61 | 4.97 |
Multiple Sexual Partners (Ever Engaged) | -0.437 | 0.326 | 1.798 | 0.180 | 0.646 | 0.34 | 1.22 |
HIV | Human Immunodeficiency Virus |
PLHIV | People Living With HIV |
AIDS | Acquired Immunodeficiency Syndrome |
NCD | Non-Communicable Disease |
ART | Antiretroviral Therapy |
ADC | AIDS-Defining Cancers |
NADC | Non-AIDS-Defining Cancers |
AHD | Advanced HIV Disease |
WHO | World Health Organization |
SSA | Sub-Saharan Africa |
GLOBOCAN | Global Cancer Observatory |
ARV | Antiretrovirals |
KS | Kaposi Sarcoma |
HAART | Highly Active Antiretroviral Therapy |
MOH | Ministry of Health |
KHIS | Kenya Health Information System |
STC | Special Treatment Clinic |
FGD | Focus Group Discussion |
KII | Key Informant Interview |
KUERC | Kenyatta University Ethical Review Committee |
NHL | Non-Hodgkin’s Lymphoma |
| [1] |
Johns Hopkins Medicine, 2023
https://www.hopkinsmedicine.org/health/conditions-and-diseases/hiv-and-aids/aidsrelated-malignancies |
| [2] | WHO 2023: |
| [3] | Kenya HIV Estimates, 2023 |
| [4] | HIV/ART Guidelines, 2022 |
| [5] | National Syndemic Disease Control Council, 2024 |
| [6] | American Cancer Society, 2024. |
| [7] | WHO, 2024 |
| [8] |
GLOBOCAN, 2022
https://gco.iarc.who.int/media/globocan/factsheets/populations/900-world-fact-sheet.pdf |
| [9] | Kenya NCD Strategic Plan, 2021: |
| [10] | National Cancer Institute, 2022 |
| [11] |
NCD Strategic Plan, 2021-2025:
https://www.iccp-portal.org/resources/kenya-national-ncd-strategic-plan-202122-202526 |
| [12] | Rogena, E. A., Simbiri, K. O., De Falco, G. et al. A review of the pattern of AIDS-defining, HIV-associated neoplasms and premalignant lesions diagnosed from 2000–2011 at Kenyatta National Hospital, Kenya. Infect Agents Cancer 10, 28 (2015). |
| [13] |
National Cancer Control Strategy, 2023-2027
http://guidelines.health.go.ke:8000/media/NATIONAL_CANCER_CONTROL_STRATEGY_2023-2027_7uTQQP4.pdf |
| [14] | Jessica L. Castilho, Aihua Bian, MPH, Cathy A. Jenkins, MS, Bryan E. Shepherd, PhD, Keith Sigel, MD, M. John Gill, MD, Mari M. Kitahata, MD, MPH: CD4/CD8 Ratio and Cancer Risk Among Adults With HIV; |
| [15] | Yuan T, Hu Y, Zhou X, Yang L, Wang H, Li L, Wang J, Qian HZ, Clifford GM, Zou H. Incidence and mortality of non-AIDS-defining cancers among people living with HIV: A systematic review and meta-analysis. EClinicalMedicine. 2022 Aug 11; 52: 101613. PMID: 35990580; PMCID: PMC9386399. |
| [16] | Mathoma, Anikie; Sartorius, Benn; Mahomed, Saajida: The Trends and Risk Factors of AIDS-Defining Cancers and Non-AIDS-Defining Cancers in Adults Living with and without HIV: A Narrative Review; JO - Journal of Cancer Epidemiology. VL - 2024, |
| [17] | MOH KHIS, 2023 |
APA Style
Omollo, P. O., Orago, A., Mwanzo, I. (2025). Predictors of AIDS-defining and Non-AIDS-defining Cancers Among PLHIV Accessing Services in Selected Hospitals in Nairobi City County, Kenya. Science Journal of Public Health, 13(6), 354-368. https://doi.org/10.11648/j.sjph.20251306.15
ACS Style
Omollo, P. O.; Orago, A.; Mwanzo, I. Predictors of AIDS-defining and Non-AIDS-defining Cancers Among PLHIV Accessing Services in Selected Hospitals in Nairobi City County, Kenya. Sci. J. Public Health 2025, 13(6), 354-368. doi: 10.11648/j.sjph.20251306.15
@article{10.11648/j.sjph.20251306.15,
  author = {Peter Onyango Omollo and Alloys Orago and Isaac Mwanzo},
  title = {Predictors of AIDS-defining and Non-AIDS-defining Cancers Among PLHIV Accessing Services in Selected Hospitals in Nairobi City County, Kenya},
  journal = {Science Journal of Public Health},
  volume = {13},
  number = {6},
  pages = {354-368},
  doi = {10.11648/j.sjph.20251306.15},
  url = {https://doi.org/10.11648/j.sjph.20251306.15},
  eprint = {https://article.sciencepublishinggroup.com/pdf/10.11648.j.sjph.20251306.15},
  abstract = {Human infection with HIV compromises the immune system and reduces the body’s ability to fight viral infections that may promote the development of certain types of cancers. The diagnosis of AIDS-defining cancers in PLHIV indicates the progression of an HIV infection to the AIDS stage. Non-AIDS-defining cancers occur in HIV-positive individuals without necessarily being caused or exacerbated by HIV infection. WHO estimates that 39.9 million are PLHIV, whereas 42.3 million lives have been lost to HIV. Kenya’s HIV prevalence was 3.3% and in Nairobi, 4.3%. NCD mortalities in Kenya were 39%, including cancers, up from 27% and HIV remains a major risk factor. This study’s main purpose was to identify the predictors of AIDS-defining and non-AIDS-defining cancers among PLHIV accessing services in selected hospitals in Nairobi City County, Kenya. An analytical cross-sectional design was used. Study sites were purposively selected, whereas a simple random method was used to select 406 adults, aged 18 years and above, HIV positive and on ART. The study was conducted in seven selected facilities in Nairobi County. Quantitative data were collected using semi-structured questionnaires, whereas qualitative data were obtained from seven key informant interviews and three focus group discussions. Descriptive statistics (percentages, graphs, and charts) and inferential statistics (chi-square and logistic regression models) were performed using SPSS v. 27. Qualitative data were transcribed, coded, and grouped into themes. AIDS-defining cancers were the most prevalent (74.6%) among PLHIV accessing services in the selected hospitals. A Pearson’s Chi-square (X2) test revealed that socio-demographic characteristics such as sex (p = 0.00), age in years (45-54 for AIDS-defining cancer and 65 and above for Non-AIDS-defining cancers) (p = 0.00), marital status (married and widowers for ADC and NADC, p = 0.02) and level of education (secondary and ‘other’ for ADC and NADC respectively; p = 0.005) were associated with the type of cancer development among people living with HIV. A binary logistic regression model found that age (χ2(5) = 14.96, p = 0.011), income level (X2 (5) = 9.96; p = 0.076), history of cigarette smoking (B = 1.53; p = 0.001; OR = 4.638; 95% CI: 2.28 – 9.42), alcohol consumption (B = 0.295; p = 0.356), family history of cancers (B = 1.04; p = 0.001; OR = 2.827; 95% CI: 1.61 – 4.97), were statistically associated with AIDS and non-AIDS-defining cancers. These findings will help formulate programmatic and policy interventions for ADC and NADC among PLHIV.},
 year = {2025}
}
TY  - JOUR
T1  - Predictors of AIDS-defining and Non-AIDS-defining Cancers Among PLHIV Accessing Services in Selected Hospitals in Nairobi City County, Kenya
AU  - Peter Onyango Omollo
AU  - Alloys Orago
AU  - Isaac Mwanzo
Y1  - 2025/12/29
PY  - 2025
N1  - https://doi.org/10.11648/j.sjph.20251306.15
DO  - 10.11648/j.sjph.20251306.15
T2  - Science Journal of Public Health
JF  - Science Journal of Public Health
JO  - Science Journal of Public Health
SP  - 354
EP  - 368
PB  - Science Publishing Group
SN  - 2328-7950
UR  - https://doi.org/10.11648/j.sjph.20251306.15
AB  - Human infection with HIV compromises the immune system and reduces the body’s ability to fight viral infections that may promote the development of certain types of cancers. The diagnosis of AIDS-defining cancers in PLHIV indicates the progression of an HIV infection to the AIDS stage. Non-AIDS-defining cancers occur in HIV-positive individuals without necessarily being caused or exacerbated by HIV infection. WHO estimates that 39.9 million are PLHIV, whereas 42.3 million lives have been lost to HIV. Kenya’s HIV prevalence was 3.3% and in Nairobi, 4.3%. NCD mortalities in Kenya were 39%, including cancers, up from 27% and HIV remains a major risk factor. This study’s main purpose was to identify the predictors of AIDS-defining and non-AIDS-defining cancers among PLHIV accessing services in selected hospitals in Nairobi City County, Kenya. An analytical cross-sectional design was used. Study sites were purposively selected, whereas a simple random method was used to select 406 adults, aged 18 years and above, HIV positive and on ART. The study was conducted in seven selected facilities in Nairobi County. Quantitative data were collected using semi-structured questionnaires, whereas qualitative data were obtained from seven key informant interviews and three focus group discussions. Descriptive statistics (percentages, graphs, and charts) and inferential statistics (chi-square and logistic regression models) were performed using SPSS v. 27. Qualitative data were transcribed, coded, and grouped into themes. AIDS-defining cancers were the most prevalent (74.6%) among PLHIV accessing services in the selected hospitals. A Pearson’s Chi-square (X2) test revealed that socio-demographic characteristics such as sex (p = 0.00), age in years (45-54 for AIDS-defining cancer and 65 and above for Non-AIDS-defining cancers) (p = 0.00), marital status (married and widowers for ADC and NADC, p = 0.02) and level of education (secondary and ‘other’ for ADC and NADC respectively; p = 0.005) were associated with the type of cancer development among people living with HIV. A binary logistic regression model found that age (χ2(5) = 14.96, p = 0.011), income level (X2 (5) = 9.96; p = 0.076), history of cigarette smoking (B = 1.53; p = 0.001; OR = 4.638; 95% CI: 2.28 – 9.42), alcohol consumption (B = 0.295; p = 0.356), family history of cancers (B = 1.04; p = 0.001; OR = 2.827; 95% CI: 1.61 – 4.97), were statistically associated with AIDS and non-AIDS-defining cancers. These findings will help formulate programmatic and policy interventions for ADC and NADC among PLHIV.
VL  - 13
IS  - 6
ER  -
Department of Family Medicine, Community Health and Epidemiology, Kenyatta University, Nairobi, Kenya
Department of Medical Microbiology and Parasitology, Kenyatta University, Nairobi, Kenya
Department of Family Medicine, Community Health and Epidemiology, Kenyatta University, Nairobi, Kenya
Information