The field trial was conducted for three years from 2014/15 to 2016/17 to determine optimal irrigation scheduling. There were five levels of irrigation water application; 60%, 80%, 100%, 120%, and 140% of the allowable soil moisture depletion levels (ASMDL) for each of the treatments laid out in a randomized complete block design with three replications. In the study, the combined year analysis result showed that there is a significant yield difference among the irrigation water applications at a P < 0.05 level of significance. The highest yield (5.269 tone ha-1) was obtained by applying irrigation water of 80% ASMDL followed by 120% ASMDL (4.734 tone ha-1) however the least yield (4.165 tone ha-1) was observed at irrigation water application of 60% ASMDL of the recommended level which means the application of 40% less water than the FAO recommended level. There is no significant difference in water use efficiency between the treatments, but the highest water use efficiency has been observed at 80% ASMDL. The overall result of this experiment suggests that the application of irrigation water using 20% less than the FAO recommendation (100% ASMDL) can sufficiently be used for irrigation scheduling of irrigated durum wheat under central highland vertosol conditions. Therefore, to have a higher yield of irrigated durum wheat it was recommended to flush frequently before critical depletion occurred.
| Published in | Science Development (Volume 5, Issue 2) |
| DOI | 10.11648/j.scidev.20240502.12 |
| Page(s) | 39-45 |
| Creative Commons |
This is an Open Access article, distributed under the terms of the Creative Commons Attribution 4.0 International License (http://creativecommons.org/licenses/by/4.0/), which permits unrestricted use, distribution and reproduction in any medium or format, provided the original work is properly cited. |
| Copyright |
Copyright © The Author(s), 2024. Published by Science Publishing Group |
Crop Water Requirement, Irrigation Scheduling, Water Use Efficiency, Irrigated Wheat, Soil Moisture
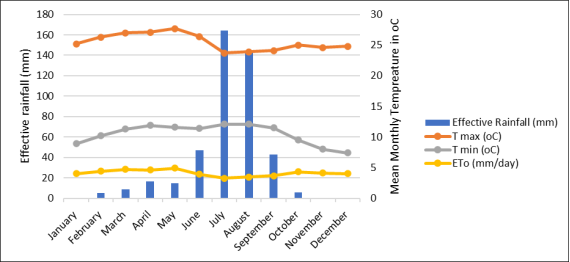
Month | Tmax (C) | Tmin (C) | ETo (mm/day) | RF (mm) | Pe (mm) |
|---|---|---|---|---|---|
January | 25.2 | 8.9 | 4.0 | 9.4 | 0.0 |
February | 26.3 | 10.2 | 4.4 | 24.8 | 4.9 |
March | 27.0 | 11.3 | 4.7 | 31.5 | 8.9 |
April | 27.1 | 11.9 | 4.6 | 44.2 | 16.5 |
May | 27.7 | 11.6 | 4.9 | 41.3 | 14.8 |
June | 26.4 | 11.4 | 3.9 | 88.9 | 47.1 |
July | 23.7 | 12.1 | 3.3 | 235.1 | 164.1 |
August | 23.9 | 12.1 | 3.5 | 208.2 | 142.6 |
September | 24.1 | 11.5 | 3.7 | 83.6 | 42.9 |
October | 25.0 | 9.5 | 4.3 | 25.9 | 5.5 |
November | 24.6 | 8.0 | 4.1 | 7.4 | 0.0 |
December | 24.8 | 7.4 | 4.0 | 1.0 | 0.0 |
Average | 25.5 | 10.5 | 4.1 |
Treatment | Description |
|---|---|
ASMDL1 | 60% ASMDL |
ASMDL 2 | 80% ASMDL |
ASMDL 3* | 100%ASMDL (control) |
ASMDL 4 | 120%ASMDL 4 |
ASMDL 5 | 140% ASMDL 5 |
Kc & Yield factor | Description | ||||
|---|---|---|---|---|---|
Initial | Devel | Mid | Late | total | |
Growing period (days) | 28 | 28 | 37 | 28 | 121 |
Kc values (fraction) | 0.30 | - | 1.15 | 0.30 | |
Critical depletion (fraction) | 0.55 | - | 0.55 | 0.80 | |
Yield response (fraction) | 0.40 | 0.60 | 0.80 | 0.40 | |
Maximum crop height (m) | 0.30 | 0.77 | 1.2 | 1.2 | |
Month | Decade | Stage | Kc (frac) | ETc (mm/day) | ETc (mm/dec) | pe (mm/dec) | Irr. Req. (mm/dec) | CWR (mm) |
|---|---|---|---|---|---|---|---|---|
Nov | 3 | Init | 0.3 | 1.29 | 11.6 | 7.7 | 3.9 | 18.6 |
Dec | 1 | Init | 0.3 | 1.48 | 14.8 | 0.1 | 14.7 | |
Dec | 2 | Dev | 0.3 | 1.43 | 14.3 | 0 | 14.3 | 74.4 |
Dec | 3 | Dev | 0.52 | 2.45 | 26.9 | 0.1 | 26.8 | |
Jan | 1 | Dev | 0.86 | 4.16 | 41.6 | 8.3 | 33.3 | |
Jan | 2 | Mid | 1.14 | 5.12 | 51.2 | 12.4 | 38.8 | 213.6 |
Jan | 3 | Mid | 1.19 | 5.91 | 65.1 | 10 | 55.1 | |
Feb | 1 | Mid | 1.19 | 6.43 | 64.3 | 6.6 | 57.7 | |
Feb | 2 | Mid | 1.19 | 6.69 | 66.9 | 4.9 | 62 | |
Feb | 3 | Late | 1.11 | 6.36 | 50.8 | 3.9 | 46.9 | 123 |
Mar | 1 | Late | 0.82 | 4.44 | 44.4 | 0.8 | 43.6 | |
Mar | 2 | Late | 0.51 | 2.98 | 29.8 | 0 | 29.8 | |
Mar | 3 | Late | 0.32 | 1.83 | 3.7 | 1 | 2.7 | |
Total | 485.4 | 55.8 | 429.6 | 429.6 |
Irrigation level | Over year combined analysis result | ||
|---|---|---|---|
BM (ton/ha) | GY (ton/ha) | WUE (kg/m3) | |
ASMDL1 | 8350.70c | 4164.93d | 15.99a |
ASMDL2 | 10746.50a | 5269.10a | 20.02a |
ASMDL3 | 8993.10cb | 4524.31c | 16.90a |
ASMDL4 | 9618.10b | 4734.38b | 16.82a |
ASMDL5 | 8715.30cb | 4475.69c | 18.68a |
R-square | 0.95 | 0.99 | 0.31 |
CV (%) | 8.02 | 1.21 | 22.46 |
LSD (0.05) | 1051.80 | 79.20 | NS |
Tmax | Maximum Temperature |
Tmin | Minimum Temperature |
RF | Rainfall |
| Effective Rainfall (mm) |
ETo | Reference Evapotranspiration (mm day-1) |
ASMDL | Available Soil Moisture Depletion Level |
Rn | Net Radiation at the Crop Surface (MJ m-2 day-1) |
G | Soil Heat Flux Density (MJ m-2 day-1) |
T | Mean Daily Air Temperature at 2m Height (°C) |
u2 | Wind Speed at 2m Height (m s-1) |
es | Saturation Vapor Pressure (kPa) |
ea | Actual Vapor Pressure (kPa) |
es-ea | Saturation Vapor Pressure Deficit (kPa) |
∆ | Slope of Vapor Pressure Curve (kPa °C-1) |
| Psychrometric Constant (kPa °C-1) |
Kc | Crop Coefficient |
ETc | Crop Evapotranspiration (mm/day) |
| Irrigation Depth Requirement (mm) |
| Crop Water Requirement (mm) |
Frac | Fraction |
Dec | Decade |
Irr.Req | Irrigation Requirement |
CWR | Crop Water Requirement |
BM | Biomass |
GY | Grain Yield |
WUE | Water Use Efficiency |
| [1] | Qadir, Boers, Schubert, Ghafoor, and Murtaza, “Agricultural water management in water-starved countries: Challenges and opportunities,” Agric. Water Manag., vol. 62, no. 3, pp. 165–185, 2003, |
| [2] | Awulachew, Yilma, Loulseged, Loiskandl, Ayana, and Alamirew, “Working paper 124: Water Reosurce and Irrigation Development in Ethiopia,” 2007. |
| [3] | M. Ali, H. Paul, and M. Haque, “Estimation of evapotranspiration using a simulation model,” J. Bangladesh Agric. Univ., vol. 9, no. 2, pp. 257–266, 2011, |
| [4] | H. Gebremariam, “Wheat research in Ethiopia: a historical perspective,” in Wheat Research in Ethiopia, 2nd ed., M. H. H. Gebremariam, G, D. G. Tanner, Ed. Addis Ababa, Ethiopia, 1991, pp. 1–15. |
| [5] |
T. Tessema and M. Jemal, “Review of Wheat Breeding in Ethiopia.,” Ethiop. J. Agric. Sci., 1982, Accessed: Feb. 16, 2024. [Online]. Available:
https://agris.fao.org/search/en/providers/122600/records/6472522753aa8c8963061d34 |
| [6] | Y. Seleshi and U. Zanke, “Recent changes in rainfall and rainy days in Ethiopia,” Int. J. Climatol., vol. 24, pp. 973–983, 2004, |
| [7] | Z. Tessema and P. J. Lamb, “CLIVAR-Africa, Interannual variability of growing season over drought-prone areas of Ethiopia,” Clim. Var. Predict. Program., vol. 8, no. 2/3, pp. 36–39, 2003. |
| [8] | A. P. SAVVA and K. FRENKEN, “Crop Water Requirements and Irrigation Scheduling,” in Irrigation Manual. Planning, Development Monitoring and Evaluation of Irrigated Agriculture with Farmer Participation, 2002. |
| [9] | R. G. ALLEN, L. S. PEREIRA, D. RAES, and M. Smith, “Crop evapotranspiration: Guidelines for computing crop water requirements-FAO Irrigation and drainage paper 56.,” no. 56, 1998, [Online]. Available: |
| [10] | J. Doorenbos and W. O. Pruitt, “Crop water requirements, Irrigation and drainage paper No. 24,” Food Agric. Organ. United Nations, vol. 24, 1977. |
| [11] | A. Sava and K. Ferenken, “Planning, Development, Monitoring and Evaluation of Irrigated Agriculture with Farmer Participation Module 3 Agronomic Aspects of,” 2002. |
| [12] | C. Brouwer and M. Heibloem, “Irrigation Water Management: Irrigation Water Needs,” 3, 1986. |
| [13] | B. Hanson, D. May, R. Voss, M. Cantwell, and R. Rice, “Response of garlic to irrigation water,” Agric. Water Manag., vol. 58, pp. 29–43, 2003, |
APA Style
Kebede, S. G., Tefera, A. H., Molla, G. T. (2024). Determination of Optimal Irrigation Scheduling for Durum Wheat in the Central Highland Vertosol of Ethiopia. Science Development, 5(2), 39-45. https://doi.org/10.11648/j.scidev.20240502.12
ACS Style
Kebede, S. G.; Tefera, A. H.; Molla, G. T. Determination of Optimal Irrigation Scheduling for Durum Wheat in the Central Highland Vertosol of Ethiopia. Sci. Dev. 2024, 5(2), 39-45. doi: 10.11648/j.scidev.20240502.12
AMA Style
Kebede SG, Tefera AH, Molla GT. Determination of Optimal Irrigation Scheduling for Durum Wheat in the Central Highland Vertosol of Ethiopia. Sci Dev. 2024;5(2):39-45. doi: 10.11648/j.scidev.20240502.12
@article{10.11648/j.scidev.20240502.12,
  author = {Solomon Gezie Kebede and Ashebir Haile Tefera and Gebeyehu Tegenu Molla},
  title = {Determination of Optimal Irrigation Scheduling for Durum Wheat in the Central Highland Vertosol of Ethiopia
},
  journal = {Science Development},
  volume = {5},
  number = {2},
  pages = {39-45},
  doi = {10.11648/j.scidev.20240502.12},
  url = {https://doi.org/10.11648/j.scidev.20240502.12},
  eprint = {https://article.sciencepublishinggroup.com/pdf/10.11648.j.scidev.20240502.12},
  abstract = {The field trial was conducted for three years from 2014/15 to 2016/17 to determine optimal irrigation scheduling. There were five levels of irrigation water application; 60%, 80%, 100%, 120%, and 140% of the allowable soil moisture depletion levels (ASMDL) for each of the treatments laid out in a randomized complete block design with three replications. In the study, the combined year analysis result showed that there is a significant yield difference among the irrigation water applications at a P -1) was obtained by applying irrigation water of 80% ASMDL followed by 120% ASMDL (4.734 tone ha-1) however the least yield (4.165 tone ha-1) was observed at irrigation water application of 60% ASMDL of the recommended level which means the application of 40% less water than the FAO recommended level. There is no significant difference in water use efficiency between the treatments, but the highest water use efficiency has been observed at 80% ASMDL. The overall result of this experiment suggests that the application of irrigation water using 20% less than the FAO recommendation (100% ASMDL) can sufficiently be used for irrigation scheduling of irrigated durum wheat under central highland vertosol conditions. Therefore, to have a higher yield of irrigated durum wheat it was recommended to flush frequently before critical depletion occurred.
},
 year = {2024}
}
TY  - JOUR
T1  - Determination of Optimal Irrigation Scheduling for Durum Wheat in the Central Highland Vertosol of Ethiopia

AU  - Solomon Gezie Kebede
AU  - Ashebir Haile Tefera
AU  - Gebeyehu Tegenu Molla
Y1  - 2024/07/23
PY  - 2024
N1  - https://doi.org/10.11648/j.scidev.20240502.12
DO  - 10.11648/j.scidev.20240502.12
T2  - Science Development
JF  - Science Development
JO  - Science Development
SP  - 39
EP  - 45
PB  - Science Publishing Group
SN  - 2994-7154
UR  - https://doi.org/10.11648/j.scidev.20240502.12
AB  - The field trial was conducted for three years from 2014/15 to 2016/17 to determine optimal irrigation scheduling. There were five levels of irrigation water application; 60%, 80%, 100%, 120%, and 140% of the allowable soil moisture depletion levels (ASMDL) for each of the treatments laid out in a randomized complete block design with three replications. In the study, the combined year analysis result showed that there is a significant yield difference among the irrigation water applications at a P -1) was obtained by applying irrigation water of 80% ASMDL followed by 120% ASMDL (4.734 tone ha-1) however the least yield (4.165 tone ha-1) was observed at irrigation water application of 60% ASMDL of the recommended level which means the application of 40% less water than the FAO recommended level. There is no significant difference in water use efficiency between the treatments, but the highest water use efficiency has been observed at 80% ASMDL. The overall result of this experiment suggests that the application of irrigation water using 20% less than the FAO recommendation (100% ASMDL) can sufficiently be used for irrigation scheduling of irrigated durum wheat under central highland vertosol conditions. Therefore, to have a higher yield of irrigated durum wheat it was recommended to flush frequently before critical depletion occurred.

VL  - 5
IS  - 2
ER  -
Soil and Water Research Department, Debre Zeit Agricultural Research Center, Debre Zeit, Ethiopia
Soil and Water Research Department, Debre Zeit Agricultural Research Center, Debre Zeit, Ethiopia
Information