Research Article | | Peer-Reviewed

Design and Simulation of a Photovoltaic Power Plant for Green Hydrogen Production in Saudi Arabia

Received: 25 February 2026     Accepted: 6 March 2026     Published: 25 April 2026
Views:       Downloads:
Abstract

With the growing need for clean energy, it is critical to efficiently utilize renewable energy sources, and green hydrogen is one of the potential sources that can help achieve sustainability goals. This study emphasizes the importance of solar photovoltaic systems for producing green hydrogen through water electrolysis as a long-term solution to environmental and economic concerns. The research focuses on enhancing the performance of these systems in order to enhance green hydrogen production, as electrolysis efficiency is determined by the quality of the energy derived from solar panels. The research examines the connection between photovoltaic electrolysis and water technologies, with an emphasis on the tilt angle of solar panels and its impact on efficiency. The study found that proton exchange membrane electrolysis is most suited for direct integration with renewable energy sources, hence increasing the efficiency of the hydrogen production process. The findings also revealed that maximizing the fixed tilt angle of solar panels is critical in striking a balance between cost and efficacies, making this design a viable alternative for future projects. The study concluded that the appropriate tilt angle (30 degrees) is crucial for increasing solar energy absorption and productivity. The study also investigated electrolysis techniques, and the findings revealed that proton exchange membrane electrolysis is most suited for direct integration with renewable energy sources. The optimization of the fixed tilt angle strikes a compromise between cost and efficacy, making this design appropriate for future applications. Variables like as row spacing and photovoltaic module size were calculated in order to build an optimal system suitable for the NEOM climate. The study sheds light on how to improve green hydrogen production with solar photovoltaic systems, opening up new avenues for research and development in this field.

Published in Research and Innovation (Volume 2, Issue 2)
DOI 10.11648/j.ri.20260202.20
Page(s) 203-213
Creative Commons

This is an Open Access article, distributed under the terms of the Creative Commons Attribution 4.0 International License (http://creativecommons.org/licenses/by/4.0/), which permits unrestricted use, distribution and reproduction in any medium or format, provided the original work is properly cited.

Copyright

Copyright © The Author(s), 2026. Published by Science Publishing Group

Keywords

Photovoltaic (PV), Panels, Electrolysis, System Design, Green Hydrogen, Tilt Angle, PVsyst Software
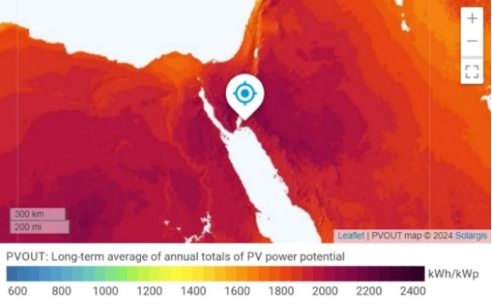
1. Introduction
Global energy demand is rapidly increasing, with some estimates predicting a 55% increase by 2035 . Energy is crucial in today's globe, yet due to rapid industrialization and population growth, conventional fossil fuel reserves are depleting . Due to the depletion of fossil fuels, environmental concerns, and the risks associated with nuclear energy, the world is being compelled to accept renewable energy (RE) sources, primarily in isolated mode in non-electric locations where grid expansion is costly. If not, the volatile character of renewable resources is controlled .
Recently, five different designs that use excess energy to produce hydrogen were used in an attempt to develop an affordable microgrid system for Yanbu city, Saudi Arabia. Based on the results, a net present value of $10.6 billion is the optimal configuration for the indicated region. Even after taking into account the transmission and distribution costs of transporting hydrogen from renewable resource locations to end users, it was concluded that building electrolyzers in places with excellent conditions for renewable resources, like Saudi Arabia, could become a low-cost hydrogen supply option as solar photovoltaic and wind generation costs decrease .
It was suggested in to develop a mathematical model and solve it numerically for the heat and mass transfer inside a metal hydride hydrogen storage. Additionally, a comparison of the two distinct plants' techno-economics was given. The system can produce 30 MW annually on the grid .
Using experimental meteorological data, the system was examined in Iraq's capital city of Baghdad to determine the ideal electrolyzer size. The optimal annual tilt angle for the site was chosen for a 12-kW photovoltaic array, and the effect of temperature on the solar units was taken into account. To evaluate the efficiency of the system, a number of electrolyzers with power outputs between 2 and 14 kW were examined. MATLAB was used to conduct the simulation, which took the project's 2021–2035 lifetime into account. The findings showed that there are a number of potentially affordable substitutes for renewable hydrogen uses in the wholesale market. It was discovered that the examined solar energy system produced 18,892 kWh annually over 4,313 hours of operation, generating hydrogen at a cost that varied from $5.39/kg to $3.23/kg. At 8 kW, the ideal electrolyzer capacity equaled a 12-kW photovoltaic system, producing 37.5 kg of hydrogen per year/kW peak at $3.23/kg .
Another research aimed to analyze three methods for producing green hydrogen using photovoltaic systems for fueling stations. The analysis showed that a 3 MW grid-connected PV system represents the best option for green hydrogen production at a cost of €5.5/kg, and can produce 58,615 kg per year, resulting in a CO2 emissions reduction of 8,209 kg per year .
Subsequent investigation demonstrated that the structure was entirely sustained with no energy loss because of 72 1.46 square foot photovoltaic panels. With time, larger pressure tanks were used to store hydrogen, and an air conditioning system was installed to provide annual thermal comfort. Hot water was constantly supplied and maintained at a steady 55°C. This ultimately resulted in a considerable decrease in Kuwait's greenhouse gas emissions, with carbon dioxide emissions falling by 33% when compared to fossil fuels .
Research looked at the production of green hydrogen utilizing solar energy alone or in conjunction with other renewable energy sources to build a hybrid system. It concentrated on the production of hydrogen in the Saudi Arabian Kingdom's NEOM metropolis. Simulations show that NEOM has a great potential for producing green hydrogen. There are several reasons for this, the primary one being the quantity of solar energy striking it. Its advantageous location close to a water supply is another feature that makes it stand out when trying to extract hydrogen from water .
A thorough analysis of long-term operating and investment costs and an assessment of their economic viability, as well as a study of the prerequisites for implementing such cutting-edge technologies and their societal acceptability, are among the research gaps in earlier work. Research is lacking in this area when it comes to carrying out more thorough technical analyses to raise the effectiveness and performance of the suggested system's component parts. Overall, especially in Saudi Arabia, there are prospects for more research and development toward the construction of a solar power plant to produce green hydrogen. In this sense, this study investigates the viability of employing solar photovoltaic systems to electrolyze water to produce green hydrogen. It also discusses the parts of these systems, their efficiency traits, the most recent advancements in technology, and how they affect dependability and overall performance.
2. Modelling and Simulation
In order to guarantee the achievement of optimal efficiency output, this part offers a thorough explanation of the techniques used in the process of choosing the site, system components, and performing technical calculations.
2.1. Design
Because of the impact of meteorological conditions on PV power plant energy production, site selection is an important consideration. A crucial first step in building a sustainable photovoltaic project is selecting the appropriate site. The Kingdom of Saudi Arabia's NEOM metropolis was thus determined to be the ideal site for this investigation. As seen in Figure 1, this location was chosen for its strong solar irradiation at latitude 28.3320 and longitude 034. 9459. According to Table 1, June had the highest site irradiance when compared to other months of the year. The site in question has an average ambient temperature of 26.6°C.
Figure 1. Site location and solar irradiance on the site .
Table 1. Solar radiation on the chosen site obtained from solar atlas .

Solar Radiation

Intensity

Specific photovoltic power output PVOUT

1927.6 kWh/ kWp

Direct Normal Irradiation DNI

2503.9 kWh/ m2

Global Horizontal Irradiation GHI

2255.9 kWh/ m2

Diffuse Horizontal Irradiation DIF

642.4 kWh/ m2

Determining critical parameters including power consumption, Faraday efficiency, and overall performance is necessary when calculating the electrolyser.
Equation (1) shows that the fuel cell reaction is reversed in the electrolysis of water. Splitting a mole of liquid water yields 285.8 kJ of energy, of which 237.2 kJ are electrical and 48.6 kJ are thermal, to form one mole of hydrogen. The integrated solar PV energy plant layout with electrolysis Numerous factors are considered in this process, including as the composition of the electrolyte, the arrangement of the cell, the temperature and pressure, and the properties of the electrode material. The chemical reaction formula for the water electrolysis reaction was used to conduct the calculation, which is the reverse of the fuel cell calculation. Equation (2) can be used to calculate an electrolysis cell's efficiency . Figure 2 shows the integrated solar PV energy plant layout with electrolysis.
Green hydrogen production power plant includes of four main components: electric-generating solar photovoltaic panels, an electrolyzer, subsystems for water separation and purification, storage containers for hydrogen and oxygen, pressurization, and dryer removes moisture from the hydrogen produced during the electrolysis process as can be seen in Figure 2. It functions in both regular and power fluctuation modes. After going through the primary separator for gas-liquid separation, hydrogen, oxygen, and a certain volume of liquid water leave the cathode and anode. The separator's function is to remove water droplets from the gas by causing the gas in the flow to abruptly change direction. Designing a photovoltaic (PV) system that is both efficient and capable of harnessing the maximum amount of available solar energy is advantageous for optimizing the efficiency of a solar hydrogen generation system. The previous objective can be accomplished by utilizing an electrolyzer that optimizes the conversion of electrical energy to the chemical energy present in hydrogen. Additionally, the two technologies can be connected via the maximum power point (MPP) voltage, which facilitates the transfer of the photovoltaic (PV) system's maximum electricity output to the electrolyzer . By utilizing this direct interconnection, the annual energy transfer from the PV system to the electrolyzer is optimized. Precise alignment between the I-V curve of the PEM and the PV module is essential to achieve optimal congruence between the PV module and the proton exchange membrane (PEM) electrolyzer .
𝐻2(liquid) + (237.2 kJ/mole) Electricity →𝐻2+ ½𝑂2(1)
Efficiency () =1.484/V = 1.484/1.83 =0.81 = 81%(2)
Figure 2. Plant layout of the integrated solar PV electricity with electrolysis.
The monthly computation of the ideal tilt angle for the panels is the focus of this study. It is dependent on a number of variables, including as the mounting methods used, the terrain of the area, and the current weather, to determine the ideal tilt angle. PV modules are oriented predictably based on latitude, taking into account the solar declination angle (δ) and elevation angle (β). To calculate the ideal inclination angle, use equations (3-5) .
δ=23.45 sin[360×nday-81365](3)
β=90-L+δ(4)
Tilt angle α =90-β(5)
Where, n is the number of days (during the year), L is the place's latitude, and β is its elevation angle. January 1st is day 1, and December 31st is day 365.
Equation (6) was utilized to establish the optimal line spacing for maximum power production following careful consideration of these aspects and comprehensive computations during the design phase .
dLmod= sintanε+ cos(6)
tanε=90-δ+L(7)
Where L_mod is the geographical latitude, ∝ is the tilt angle, δ is the ecliptic angle equal to 23.50°, and d is the inter-row distance.
The size of the PV modules was established by factoring in the energy consumption needs, which are the total plant output indicated by the electrolyzer need and the quantity of power transmitted into the grid. The size of the PV module was decided by taking into account the overall peak generation. The maximum wattage (Wp) that can be produced is determined by the PV module's size and the surrounding environment. The account exhibits the most basic solar panels. Increased PV module count extends battery life and improves system performance.
Reducing the number of PV modules may shorten battery life and result in inadequate system performance on cloudy days. Equations (8-10) can be used to calculate the total number of modules, maximum number of photovoltaic (PV) modules, and minimum number of PV modules as following :
No of modules needed in the system=the capacity of the PV plant in wattthe capacity ofsingle PV panal in watt(8)
nmod (Max)=Max inverter inputVoc×(1+(Tamb (min)-TSTC×TPC100})(9)
nmod Min=Min inverter inputVmpp×(1+(Tamb (max)+Tnom-TSTC× TPC/100})(10)
An alternative approach to managing the inherent volatility of renewable energy sources entail the application of a hybrid energy infrastructure. Multiple power sources are needed for this kind of system, with solar power working as the primary source and the electrolyzer functioning as a controlled secondary supply. The electrolyzer, storage boxes, subsystems for water separation and purification, photovoltaic solar panels, pressure, control, and monitoring components, and storage containers make up the system. These systems stand out due to their ability to control primary source power variations, which increases overall efficiency and dependability. However, the development of power control management technologies that can quickly adapt to variations in load demand is necessary for the successful deployment of hybrid power systems .
2.2. Simulation
This study used PVsyst software to run simulations to determine the optimal dimensions and analyze the inverter and backlash in relation to the number of units in a given region. The simulations take into account a wide range of input elements and geographic regions. The primary purpose of this study is to determine the appropriate inverter-scaling factor for grid-connected systems in various temperature zones.
The Kingdom of Saudi Arabia, specifically the city of NEOM, was chosen as the site's location. The goal is motivated by the desire to reduce pollution, diversify the economy, and eliminate the use of liquid fuels in energy infrastructure. Because of its strategic location in the Sun Belt region, Saudi Arabia can maximize the utilization of its solar energy resources. The country receives extraordinarily high amounts of solar radiation, resulting in a significant amount of direct natural radiation (DNI), with an annual average value of 2200 kWh/m2.
An advanced PVsyst simulation was performed using hourly weather data from the National Solar Radiation Database (NSRDB) to build the system beforehand. This data was selected because it can be used with PVsyst and offers a personalized weather profile for the specified location. Accurate climate data specific to that area are needed to determine the amount of electricity a solar system can produce.
If that about establishing a solar energy system, you should carefully analyze your photovoltaic (PV) module options. The right unit has a significant impact on the arrangement's longevity, economics, and performance. For this project, the Longi 490W solar module was chosen because to its better efficiency. Appendix Table 2 summarizes the Longi solar PV module's specifications and supplementary characteristics. It was determined that by adjusting the maximum and minimum number of modules in series, the grid-connected inverter rating may be optimally optimized. The number of units in series influences the volume factor ratio, which reaches its maximum value during peak production. Following this, the return begins to drop. It's important to notice that the unit's classification stayed the same in both cases; the inverter settings were the only variation. It is expected that the final power in a PV output power calculation is directly proportional to the radiation level. But remember that energy and system efficiency decrease as the temperature of the solar cells rises. The efficiency of the gadget is decreased when solar radiation heats the solar cells on the panel. The optimal system configuration takes soiling variables and degradation impacts into account .
Table 2. Features and attributes of the solar photovoltaic module .

Module

LR5-66HPH-490MG2

Electrical Characteristics at STC

1.5 AM, 1000 W/m2, 25C

Max power

490 Wp

Short circuit current

13.74

Open circuit voltage

45.25

Module efficiency

20.9

Dimensions

2073* 1133*35mm

Max System voltage

DC1500V

Max series fuse rating

25A

By accurately optimizing and managing the system with the Maximum Power Point Tracking (MPPT) algorithm, these inverters make sure that solar modules contribute the maximum amount of energy to the power grid. ABB PVS800-57-0875KWB central inverters were chosen because, according to the inverter specifications, they may improve dependability, efficiency, and ease of installation (See Table 3).
Table 3. ABB Central inverter characteristics [ABB, 2017].

Module

ABB Central Inverter

Input

DC Voltage range, MPP (UDC, MPP)

525-825

Max DC Voltage

1100 Volt

Max DC Current

1710 Ampere

Number of protected DC inputs

8 -20 (+/-)

Output

Nominal Power

875 kW

Max output power

1050 kW

Nominal AC current

1445 A

Nominal output voltage

350 V

Efficiency

98.7%

One of the most important aspects of grid inverter optimization is the scaling factor, which ensures that the PV array's nominal output power matches the grid inverter's input power. A reflector can be either small or large in size. The system is considered undersized if the input power is less than the inverter's rated power. The system is considered big if the input power exceeds the inverter's rated power. This study calculated a variety of criteria, including the amount of units. As a result, adjusting the number of units always altered the size factor. This made it possible to calculate the percentages for the performance ratio (PR), inverter efficiency, and energy productivity (kWh/kW/y). Using hourly simulation data, the annual output of the PV array was used to calculate the annual inverter efficiency. To determine the performance percentage for a certain time period, a mathematical formula was applied. This formula was derived from available grid-connected system power (EGrid), hourly incoming radiation readings (Glob.inc), and the rated power of a photovoltaic array (PnomPV) from the STC installed power. The impacts of different reflector size parameters and directions on the PV array's performance ratio at the chosen site are computed in the project results section.
The final PV system yieldYf, expressed in terms of energy yield, is calculated by dividing the net energy production (E) of the installed PV array by its nameplate D. C. power. The photovoltaic arrays required production hours, or kWh/kW, to achieve its rated power output is indicated by the variableYf. The authors chose the latter unit since it more accurately represents the quantities used to derive the parameter. Yf Provides a useful method for comparing the energy output of PV systems by standardizing the energy output with respect to system size.
3. Results and Discussion
This section includes the findings of the simulation as well as a discussion on how to calculate the solar module's inclination angle optimally each month. Using the information in Table 4, mathematical calculations performed using Equations (3), (4), and (5) to determine the ideal tilt angle and the optimal inclination angle for a photovoltaic (PV) plant. Throughout the summer, July has the lowest solar elevation angle, while December has the biggest angular inclination. PVSyst software, which takes into consideration the unique seasonal circumstances in the summer and winter as well as the annual irradiation output showed that 49° is the best tilt angle at winter and 10° at summer time for the specified location. Module sizing considers a number of criteria, including available space, required energy consumption, geographic location, and solar radiation levels. By applying Equations (8-10), the number of PV modules in the system needed is 10204 panels, 𝑇ℎ𝑒 max 𝑛𝑢𝑚𝑏𝑒𝑟 𝑜𝑓 𝑚𝑜𝑑𝑢𝑙𝑒𝑠 𝑖𝑛 𝑎 𝑠𝑡𝑟𝑖𝑛𝑔 equal 22 𝑚𝑜𝑑𝑢𝑙𝑒/𝑠𝑡𝑟𝑖𝑛𝑔, and ℎ𝑒 min. 𝑛𝑢𝑚𝑏𝑒𝑟 𝑜𝑓 𝑚𝑜𝑑𝑢𝑙𝑒𝑠 𝑖𝑛 𝑎 𝑠𝑡𝑟𝑖𝑛𝑔 is equal to 15 𝑚𝑜𝑑𝑢𝑙𝑒/𝑠𝑡𝑟𝑖𝑛𝑔. PVsyst software was used to simulate a grid-connected PV system for a 5 MW power plant based on the simulation findings. Five central inverters and 10,203 modules in total are required for the system, according to the simulation.
Table 4. Optimum tilt angle for the solar module calculated for each month.

Month

Optimum Tilt angle (α)

Altitude angle (β)

Solar deflation angle (δ)

Nth day

Jan

49.43

40.57

-21.1

1

Feb

44.73

45.27

-16.4

32

Mar

35.33

54.67

-7

60

Apr

24.35

65.65

3.98

91

May

14.33

75.67

14

121

June

6.53

83.47

21.8

152

July

5.43

84.57

22.9

182

Aug

11.93

78.07

16.4

213

Sep

21.33

68.67

7

244

Oct

31.83

58.17

-3.5

274

Nov

36.73

53.27

-8.4

305

Dec

49.43

40.57

-21.1

335

In order to accomplish this, three central inverters were connected to 107 strings of 19 solar modules that were connected in series. The system also makes use of an additional 108 series of units, which are linked to two central inverters. 24,228 m2 of space is needed for the placement of these units. The temperature and amount of solar radiation that a photovoltaic system receives determines its output. The array output current is measured to be 32 A under the Standard Test Conditions, and the short-circuit current is 33.7 A at the highest power point. Sixty-five degrees Celsius is the array's highest power point voltage; twenty-one degrees Celsius is seventy-six degrees.
Conversely, at -10°C, the open circuit voltage is measured at 50.7V. Under typical test conditions, the array's nominal power was determined to be a maximum of 4999 kW. The nominal power of the array divided by the nominal power of the system is known as the Pnom ratio, and the estimated value is 1.14. It shoes that the system is not suffering from severe overhead loss because it is within the advised Pnom ratio range. By computing the optimum result for the constant angle throughout the year, which comes out to be 30 degrees, the ideal tilt angle was found. According to Table 5, the simulation result shows that this angle produced the most power gain with 0% loss. The ideal option is fixed tilt because it does not require tracking algorithms, which add to the system's complexity and cost, nor any complicated control system. The results of simulations are displayed for various inclination inclinations, and the best angle for optimal operation is 30 degrees. Fixed tilt is seen to be the ideal option because it does not require tracking algorithms, which raise system costs and complexity, or a sophisticated control system. It shows the outcomes of a simulation with various tilt angles, and the results indicate that the optimal angle for optimal performance is 30.
Table 5. Various tilt angles simulation result.

Simulated Tilt angle

GHI on Collector plane

E Grid (Mwh)

E Array (Mwh)

Losses

50°

2390

10042596

10235692

-5.5%

40°

2492

10449382

10649652

-1.5%

30°

2530

10602177

10804946

0.0%

20°

2504

10502060

10702536

-1.0%

10°

2414

10149079

10342535

-4.6%

2261

9534519

9716613

-10.6%

Table 6 displays the primary balances and findings along with the mean ambient temperature, global incidence at the complex level, global irradiance on the horizontal axis, and effective global irradiance after shading and soil losses. In addition to these variables, the power generated by the monocrystalline solar array in direct current (DC) and the power delivered to the grid after accounting for system efficiency, electrical component losses, and PV array losses were calculated by simulation. As part of the simulation procedure, every variable found in the balances was examined in order to generate meaningful monthly and annual findings. Variables such as average temperature, efficiency, total power, and radiation can all have annual values computed. At the research site, the annual radiation on the horizontal plane was measured to be 2260.6 kWh/sq ft. Furthermore, a 2522.5 kWh/sq ft global complex incidence was discovered. m, but the effective global radiation was found to be 2484.2 kWh/square foot after accounting for optical losses. Taking into account the effective global irradiation value, the yearly DC power produced by the PV array and the annual AC power added to the grid are 108.04 MWh and 106.02 MWh, respectively. Figure 3 shows the usual production of a PV power plant. The data in this chart indicates that the average daily energy input to the grid is 5.81 kWh/kilowatt-day. The PV array loss and system loss have daily values of 0.99 kWh/kWh and 0.11 kWh/kWh, respectively. It is vital to remember that the collector loss is much higher in the summer months (Jun, July) and comparably smaller in the winter (December, January). Temperature-related efficiency loss is the reason for this rise. In spite of this, summertime energy production is still high, which is explained by the high levels of insulation in this season. Monitoring the daily energy output of a system is helpful in assessing its productivity and effectiveness as well as the efficient use of its resources. It is based on the energy of the system's daily output. 5.81 kWh/kWp/day is the average daily energy input into the grid, according to the simulation results.
Figure 3. Normalized production per installed kwp.
The daily values for the PV array loss and system loss are 0.99kWh/kWp and 0.11 kWh/kWp, respectively. As Figure 4 illustrates, it is notable that the collector loss is considerably higher during the summer months of June and July and is significantly lower in the winter months of December and January. Temperature-related efficiency loss is the reason for this rise. Despite this, summertime energy output is still strong, which is explained by the high levels of insulation in this season.
Table 6. Balances and main results of the simulated system.

GlobHor (kWh/m2)

DiffHor (kWh/m2)

T_Amb (C)

Globlnc (kWh/m2)

GlobEff (kWh/m2)

EArray (kWh)

E_ Grid (kWh)

PR ratio

January

130.7

25.19

17.53

198.2

196.1

885876

869152

0.877

February

146.3

28.17

19.05

197.0

194.9

865252

848957

0.862

March

199.4

38.75

22.30

233.1

230.2

1004410

985098

0.845

April

216.5

54.60

25.45

221.9

218.4

948657

930486

0.839

May

236.5

68.45

29.51

217.7

213.5

923049

905660

0.832

June

249.7

47.74

31.96

216.4

211.7

903513

886663

0.820

July

246.4

57.86

33.51

219.4

214.5

911750

894840

0.816

August

227.7

59.66

33.69

223.2

219.0

925413

908186

0.814

September

195.0

49.09

31.07

216.3

213.0

906891

890372

0.823

October

162.6

46.43

28.08

205.0

202.3

876984

860921

0.840

November

131.0

29.08

23.37

189.4

187.6

828508

812662

0.858

December

118.9

25.03

19.39

184.9

183.1

824644

809182

0.875

Year

2260.6

530.06

26.28

2522.5

2484.2

10804946

10602177

0.841

Figure 4. The average daily energy injected into the grid.
Fouling factor, radiation intensity, temperature, and inverter voltage threshold are the most frequent losses in PV systems; shading losses, however, are disregarded because of the adjustable orientation of the module structures. This information offers crucial insights to cut down on needless losses. The photovoltaic array produces 379.9 MWh of energy after the change in (STC), with an efficiency of 20.67%. At this stage, temperature losses, light-induced degradation, mismatched module groups, and ohmic write losses account for 11.26%, 2%, 7.44%, and 1.04% of the total losses. With 248.9 MWh contributed to the grid each year, the inverter manufacturing plant produces 273.5 MWh of energy that is available for use. The yearly energy available at the inverter output is 1.06-megawatt hours, resulting in a 1.86% loss when the inverter is operating. The overall performance ratio in the simulation environment over a year was found to be 0.84, which indicates that system and module losses, which include, among other things, the conversion of solar radiation into useful energy, thermal losses, ohmic losses, and inverter losses—account for around 20% of the energy produced by the PV system. Monthly variations in the performance percentage occur because winter performance percentages are higher than summer performance percentages. This is to be expected since wintertime brings with it lower temperatures and less pollution, which in turn results in lesser losses. To sum up, the performance ratio is a helpful indicator of a PV power plant's efficiency and caliber. It offers an extensive evaluation of system operations by taking into account the impact of different losses on power production. Because of the better weather throughout the winter, the monthly performance ratio may vary, with greater values observed during this period. The predicted yearly energy production of the PV power plant is 10,602.18 MWh, based on the PV system's modeling findings. On the other hand, a diesel power plant's CO2 avoidance factor is 0.764 kg CO2/kWh. Thus, it is projected that a total of 236,322.5 tons of CO2 will be avoided annually when the PV plant is installed. Table 7. Throughout the PV's 30-year lifespan.
In recent years, green hydrogen has become increasingly popular as the globe moves toward a more sustainable energy future. Green hydrogen production has experienced a significant surge in recent years, particularly in countries such as Saudi Arabia that possess an abundance of renewable energy sources. Because of its abundance solar resources, Saudi Arabia offers enormous potential for the production of green hydrogen. Saudi Arabia intends to develop 4 million tons of low-carbon hydrogen by 2030 in order to prevent the country from emitting 27 million tons of CO2 yearly . It is anticipated that the generation of hydrogen will vary seasonally, with summer production being higher than winter output. This discrepancy could be explained by the higher levels of solar radiation observed in the summer, as indicated by the results. The existence of seasonal variation would result in a shortfall between supply and demand during the winter months, regardless of any variations in demand throughout the year. Also, there is an overabundance during the summer. This fluctuation may be mitigated to some extent by the use of hydrogen storage. This study demonstrates how solar panels' set tilt angle directly affects energy production. To optimize the incident solar radiation on the PV panels' surface, it is crucial to properly calculate and select the right angles. In order to plan, execute, and ultimately achieve maximum power production, it is essential to determine the optimal orientation and tilt angle of a photovoltaic (PV) panel with regard to the horizontal plane. Although solar energy is intermittent, advancements in energy storage, specifically the generation of hydrogen through water electrolysis, offer a viable method of storing and utilizing solar power.
The size, location, type of solar panels, and government subsidies or incentives all affect how much a solar powerd hydrogen production system costs. Larger solar farms and electrolizeres are more affordable due to economies of scale. Project inputs, outputs, cost drivers, and categories are all included in the weighted average cost of capital (WACC). The IEA (International Energy Agency), states that the cost of capital is the total of a base rate and a premium. The base rate is the return on investment with low perceived default or reinvestment risk in a benchmark global economy, and the premium is linked to market risk perceptions such as unforeseen changes in the rule of law. The capital structures of various energy sectors will differ, making them more susceptible to changes in the price of debt or equity. Particularly for renewables and grids, investments in the power sector usually depend on high debt levels, which represent the fixed element in cost and revenue structures. According to NREL, a 100-MW system costs $171 million to $173 million, while a 1-MW ground-mount PV system with 600 kW/2.4 MWh of storage costs $2.07 million to $2.13 million. Due to its environmental sustainability and cost-effectiveness, the utilization of solar energy in the production of green hydrogen is growing in popularity. Using solar energy to produce hydrogen not only contributes to the reduction of carbon emissions but also capitalizes on the economic advantages of renewable energy. This research offers a systematic method for assessing the feasibility of solar-powered hydrogen generation, which considers both, design and simulation factors. This multidisciplinary approach represents a significant progression in the pursuit of a more environmentally friendly and resilient energy future, as it incorporates solar power for green hydrogen production.
Table 7. Generated emissions from the system as calculated by PV syst.

Item

Value (unit)

Generated Emission

KgCO2

Modules

8562692

Inverter

2455

Support

505641

Total

9070.79 t CO2

Replaced emission

Total

236322.5 t CO2

Life Time

30 years

Grid Lifecycle Emissions

743 g CO2/kWh

4. Conclusion
This study focused on the simulation and design of a solar power plant in Saudi Arabia that generate green hydrogen. The investigation provided valuable new information concerning the study's viability and technology. The research also noted the potential benefits of creating hydrogen using renewable energy sources, which could significantly reduce carbon emissions and help the country, reach its sustainable development goals. This study found that various interrelated and multidimensional factors influence the performance and efficiency of proton exchange membrane (PEM) electrolysis systems with photovoltaic (PV) panels for hydrogen production. To maximum energy capture, PV panels must be oriented at the proper angle, which is governed by latitude, environment, and incoming solar radiation. PV systems must be designed and sized with comparable considerations to allow for efficient functioning in a variety of environments. These characteristics include MPP voltage range, temperature, and the requirement for inverters. Row spacing is critical for reducing shade impacts and boosting power generation. To achieve the intended system performance, string size must strike a balance between variables such as voltage and temperature. Computer simulations with applications such as PVsyst can also provide useful information on the predicted performance of PV systems in real-world scenarios. Energy requirements in electrolysis are determined by voltage, cell efficiency, and hydrogen production rate. For optimal hydrogen generation, an appropriate system size must be considered, as well as extra components. Both electrolytic and photovoltaic systems rely heavily on reliability and energy efficiency. To design, implement, and manage efficient and sustainable renewable energy systems, it is critical to understand how these components interact. According to research, a number of considerations and simulations must be considered when designing and optimizing solar and electrolytic systems for optimal energy output and hydrogen generation across a wide range of geographic and operational circumstances. As technology improves, it is believed that these systems will undergo more development and discoveries, paving the path for a cleaner, more sustainable energy source.
Abbreviations

PV

Photovoltaic

RE

Renewable Energy

PEM

Proton Exchange Membrane

CO₂

Carbon Dioxide

MW

Megawatt

kW

Kilowatt

kWh

Kilowatt-hour

kWp

Kilowatt-peak

MWh

Megawatt-hour

Wp

Watt-peak

DC

Direct Current

AC

Alternating Current

MPPT

Maximum Power Point Tracking

STC

Standard Test Conditions

PR

Performance Ratio

Pnom

Nominal Power

Voc

Open Circuit Voltage

Vmpp

Voltage at Maximum Power Point

Isc

Short Circuit Current

DNI

Direct Normal Irradiation

GHI

Global Horizontal Irradiation

DIF

Diffuse Horizontal Irradiation

PVOUT

Photovoltaic Power Output

NSRDB

National Solar Radiation Database

L_mod

Module Length (or Module-related Parameter in Spacing Equation)

η

Efficiency

V

Voltage

H₂

Hydrogen

O₂

Oxygen

TPC

Temperature Power Coefficient

Tamb

Ambient Temperature

Tnom

Nominal Temperature

TSTC

Standard Test Condition Temperature

EGrid

Energy Delivered to Grid

Glob.inc

Global Incident Irradiance

WACC

Weighted Average Cost of Capital

Acknowledgments
Deepest gratitude goes to the University of Sheffield for offering the right tools and software licence conducting this study.
Author Contributions
Mohammed Alghamdi: Conceptualization, Data Curation, Investigation, Resources, Methodology, Validation, Writing – original draft, Writing – review & editing
Data Availability Statement
The data is available from the corresponding author upon reasonable request.
Conflicts of Interest
The authors declare no conflicts of interest.
References
[1] Jaradat, M., Alsotary, O., Juaidi, A., Albatayneh, A., Alzoubi, A., Gorjian, S. (2022). Potential of producing green hydrogen in Jordan. Energies, 15(23), 9039.
[2] Shboul, B., Zayed, M. E., Tariq, R., Ashraf, W. M., Odat, A. S., Rehman, S., Krzywanski, J. (2024). New hybrid photovoltaic-fuel cell system for green hydrogen and power production: Performance optimization assisted with Gaussian process regression method. International Journal of Hydrogen Energy, 59, 1214–1229.
[3] Al-Sharafi, A., Al-Buraiki, A. S., Al-Sulaiman, F., Antar, M. A. (2024). Hydrogen refueling stations powered by hybrid PV/wind renewable energy systems: Techno-socio-economic assessment. Energy Conversion and Management: X, 22, 100584.
[4] Florez, J., AlAbbad, M., Vazquez-Sanchez, H., Morales, M. G., Sarathy, S. M. (2024). Optimizing islanded green ammonia and hydrogen production and export from Saudi Arabia. International Journal of Hydrogen Energy, 56, 959–972.
[5] Hussam, W. K., Abdul-Niby, M., Sheard, G. J. (2024). Techno-economic analysis and optimization of hydrogen production from renewable hybrid energy systems: Shagaya renewable power plant–Kuwait. International Journal of Hydrogen Energy, 58, 56–68.
[6] AlZahrani, A. A., Zamfirescu, C., El-Emam, R. S. (2024). Analysis of a Solar-Assisted Crude Oil Refinery System with On-site Green Hydrogen Generation: A Case Study. Arabian Journal for Science and Engineering.
[7] Zghaibeh, M., Okonkwo, P. C., Belgacem, I. B., Beitelmal, W. H., Mansir, I. B. (2022). Analytical model for a techno-economic assessment of green hydrogen production in photovoltaic power station case study Salalah city–Oman. International Journal of Hydrogen Energy, 47(31), 14171–14179.
[8] Al-Sharafi, A., Sahin, A. Z., Ayar, T., Yilbas, B. S. (2017). Techno-economic analysis and optimization of solar and wind energy systems for power generation and hydrogen production in Saudi Arabia. Renewable and Sustainable Energy Reviews, 69, 33–49.
[9] Alturki, A. A. (2022). Optimal design for a hybrid microgrid-hydrogen storage facility in Saudi Arabia. Energy, Sustainability and Society, 12(1), 24.
[10] Rajeh, M. (2022). Techno-Economic Study for Adding Hydrogen Storage to the Photovoltaic Plant in Neom City. PhD dissertation, Effat University.
[11] Zghaibeh, M., Belgacem, I. B., Baloch, M. H., Chauhdary, S. T., Kumar, L., Arıcı, M. (2024). Optimization of green hydrogen production in hydroelectric-photovoltaic grid connected power station. International Journal of Hydrogen Energy, 52, 440–453.
[12] Hassan, Q., Abdulrahman, I. S., Salman, H. M., Olapade, O. T., Jaszczur, M. (2023). Techno-economic assessment of green hydrogen production by an off-grid photovoltaic energy system. Energies, 16(2), 744.
[13] Okonkwo, P. C., Belgacem, I. B., Zghaibeh, M., Tlili, I. (2022). Optimal sizing of photovoltaic systems based green hydrogen refueling stations case study Oman. International Journal of Hydrogen Energy, 47(75), 31964–31973.
[14] Hai, T., Ali, M. A., Dhahad, H. A., Alizadeh, A. A., Sharma, A., Almojil, S. F., Wang, D. (2023). Optimal design and transient simulation next to environmental consideration of net-zero energy buildings with green hydrogen production and energy storage system. Fuel, 336, 127126.
[15] Balabel, A., Alrehaili, M. S., Alharbi, A. O., Mohammed, M., Alharbi, H. (2023). Potential of solar hydrogen production by water electrolysis in the NEOM green city of Saudi Arabia. World Journal of Advanced Engineering Technology and Sciences, 8(1), 029–052.
[16] Shaher, A., Alqahtani, S., Garada, A., Cipcigan, L. (2023). Rooftop solar photovoltaic in Saudi Arabia to supply electricity demand in localised urban areas: A study of the City of Abha. Energies, 16(11), 4310.
[17] Singgih, D. P., Prabowo, A. R., Arifin, Z. (2022). Investigation of thermal collector nanofluids to increase the efficiency of photovoltaic solar cells. International Journal of Heat and Technology, 40(2), 208–214.
[18] Victoria, M., Haegel, N., Peters, I. M., Sinton, R., Jäger-Waldau, A., del Cañizo, C., Breyer, C., Stocks, M., Blakers, A., Kaizuka, I., Komoto, K. (2021). Solar photovoltaics is ready to power a sustainable future. Joule, 5(5), 1041–1056.
[19] Adeoye, A. O., Quadri, R. O., Lawal, O. S. (2023). Biomass waste pyrolysis in the context of Nigeria's oil and gas industry: An overview. International Journal of Ambient Energy.
[20] Ismail, T. M., Ramzy, K., Elnaghi, B. E., Abelwhab, M. N., El-Salam, M. R. (2019). Using MATLAB to model and simulate a photovoltaic system to produce hydrogen. Energy Conversion and Management, 194, 167–182.
[21] Hassan, Q., Sameen, A. Z., Salman, H. M., Jaszczur, M., Al-Hitmi, M., Alghoul, M. (2023). Energy futures and green hydrogen production: Is Saudi Arabia trend? Results in Engineering, 18, 101165.
[22] Mamun, M. A. A., Islam, M. M., Hasanuzzaman, M., Selvaraj, J. (2022). Effect of tilt angle on the performance and electrical parameters of a PV module: Comparative indoor and outdoor experimental investigation. Energy and Built Environment, 3(3), 278–290.
[23] Jacobson, M. Z., Jadhav, V. (2018). World estimates of PV optimal tilt angles and ratios of sunlight incident upon tilted and tracked PV panels relative to horizontal panels. Solar Energy, 169, 55–66.
Cite This Article
  • APA Style

    Alghamdi, M. (2026). Design and Simulation of a Photovoltaic Power Plant for Green Hydrogen Production in Saudi Arabia. Research and Innovation, 2(2), 203-213. https://doi.org/10.11648/j.ri.20260202.20

    Copy | Download

    ACS Style

    Alghamdi, M. Design and Simulation of a Photovoltaic Power Plant for Green Hydrogen Production in Saudi Arabia. Res. Innovation 2026, 2(2), 203-213. doi: 10.11648/j.ri.20260202.20

    Copy | Download

    AMA Style

    Alghamdi M. Design and Simulation of a Photovoltaic Power Plant for Green Hydrogen Production in Saudi Arabia. Res Innovation. 2026;2(2):203-213. doi: 10.11648/j.ri.20260202.20

    Copy | Download

  • @article{10.11648/j.ri.20260202.20,
      author = {Mohammed Alghamdi},
      title = {Design and Simulation of a Photovoltaic Power Plant for Green Hydrogen Production in Saudi Arabia},
      journal = {Research and Innovation},
      volume = {2},
      number = {2},
      pages = {203-213},
      doi = {10.11648/j.ri.20260202.20},
      url = {https://doi.org/10.11648/j.ri.20260202.20},
      eprint = {https://article.sciencepublishinggroup.com/pdf/10.11648.j.ri.20260202.20},
      abstract = {With the growing need for clean energy, it is critical to efficiently utilize renewable energy sources, and green hydrogen is one of the potential sources that can help achieve sustainability goals. This study emphasizes the importance of solar photovoltaic systems for producing green hydrogen through water electrolysis as a long-term solution to environmental and economic concerns. The research focuses on enhancing the performance of these systems in order to enhance green hydrogen production, as electrolysis efficiency is determined by the quality of the energy derived from solar panels. The research examines the connection between photovoltaic electrolysis and water technologies, with an emphasis on the tilt angle of solar panels and its impact on efficiency. The study found that proton exchange membrane electrolysis is most suited for direct integration with renewable energy sources, hence increasing the efficiency of the hydrogen production process. The findings also revealed that maximizing the fixed tilt angle of solar panels is critical in striking a balance between cost and efficacies, making this design a viable alternative for future projects. The study concluded that the appropriate tilt angle (30 degrees) is crucial for increasing solar energy absorption and productivity. The study also investigated electrolysis techniques, and the findings revealed that proton exchange membrane electrolysis is most suited for direct integration with renewable energy sources. The optimization of the fixed tilt angle strikes a compromise between cost and efficacy, making this design appropriate for future applications. Variables like as row spacing and photovoltaic module size were calculated in order to build an optimal system suitable for the NEOM climate. The study sheds light on how to improve green hydrogen production with solar photovoltaic systems, opening up new avenues for research and development in this field.},
     year = {2026}
    }
    

    Copy | Download

  • TY  - JOUR
    T1  - Design and Simulation of a Photovoltaic Power Plant for Green Hydrogen Production in Saudi Arabia
    AU  - Mohammed Alghamdi
    Y1  - 2026/04/25
    PY  - 2026
    N1  - https://doi.org/10.11648/j.ri.20260202.20
    DO  - 10.11648/j.ri.20260202.20
    T2  - Research and Innovation
    JF  - Research and Innovation
    JO  - Research and Innovation
    SP  - 203
    EP  - 213
    PB  - Science Publishing Group
    SN  - 3070-6297
    UR  - https://doi.org/10.11648/j.ri.20260202.20
    AB  - With the growing need for clean energy, it is critical to efficiently utilize renewable energy sources, and green hydrogen is one of the potential sources that can help achieve sustainability goals. This study emphasizes the importance of solar photovoltaic systems for producing green hydrogen through water electrolysis as a long-term solution to environmental and economic concerns. The research focuses on enhancing the performance of these systems in order to enhance green hydrogen production, as electrolysis efficiency is determined by the quality of the energy derived from solar panels. The research examines the connection between photovoltaic electrolysis and water technologies, with an emphasis on the tilt angle of solar panels and its impact on efficiency. The study found that proton exchange membrane electrolysis is most suited for direct integration with renewable energy sources, hence increasing the efficiency of the hydrogen production process. The findings also revealed that maximizing the fixed tilt angle of solar panels is critical in striking a balance between cost and efficacies, making this design a viable alternative for future projects. The study concluded that the appropriate tilt angle (30 degrees) is crucial for increasing solar energy absorption and productivity. The study also investigated electrolysis techniques, and the findings revealed that proton exchange membrane electrolysis is most suited for direct integration with renewable energy sources. The optimization of the fixed tilt angle strikes a compromise between cost and efficacy, making this design appropriate for future applications. Variables like as row spacing and photovoltaic module size were calculated in order to build an optimal system suitable for the NEOM climate. The study sheds light on how to improve green hydrogen production with solar photovoltaic systems, opening up new avenues for research and development in this field.
    VL  - 2
    IS  - 2
    ER  - 

    Copy | Download

Author Information
  • Carbon Management Technologies, King Abdulaziz City for Science and Technologies (KACST), Riyadh, Saudi Arabia

    Research Fields: Solar Energy, Hydrogen Production, Renewable Energy Systems, Decarbonization Technologies, Energy Engineering, Carbon Capture, Utilization, and Storage (CCUS).