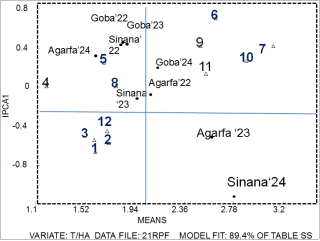
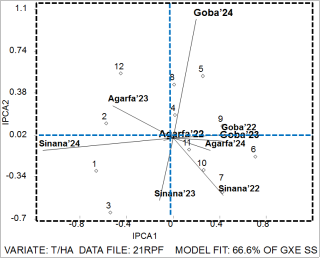
To identify high yielding and stable field pea genotypes in the highlands of bale, twelve field pea genotypes were evaluated at three locations, Sinana, Goba and Agarfa in the highlands of Bale southeastern Ethiopia, for three consecutive years 2022-2024 cropping season using randomized complete block design with three replications. The combined analysis over locations and years revealed significant variation of mean grain yield for genotypes, environments and genotype by environment interaction at P<0.01. The AMMI analysis also revealed significant variation for all AMMI components. The genotypes contributed about 59.32% of the total sum squares followed by environment which is responsible for 22.09% of the total sum square and 18.60% of the variation is accounted due to genotypes by environment interaction. The first AMMI1 is accounted for 43.07% of the interaction sum of square whereas the second AMMI components accounted for 23.56% variation of the interaction sum of square. The two components cumulatively accounted for 66.63% of the variation of the interaction sum of square. Using AMMI Stability Value (ASV) G4, G11, G8, and G10 are considered as stable genotypes. Since the most stable genotypes are not high yielder, the GSI revealed G10, and G11 are the stable once whereas G7 and G8 are moderately stable. Since G7 and G10 having high mean grain yield over the checks with yield advantage of 22.4 and 13.4, respectively and also showed stable performance over the testing environments, they have been identified as candidate genotypes to be verified for possible release for the highlands of bale and similar agro-ecologies.
| Published in | Mathematical Modelling and Applications (Volume 10, Issue 2) |
| DOI | 10.11648/j.mma.20251002.11 |
| Page(s) | 24-30 |
| Creative Commons |
This is an Open Access article, distributed under the terms of the Creative Commons Attribution 4.0 International License (http://creativecommons.org/licenses/by/4.0/), which permits unrestricted use, distribution and reproduction in any medium or format, provided the original work is properly cited. |
| Copyright |
Copyright © The Author(s), 2025. Published by Science Publishing Group |
AMMI Stability Value, G x E, Grain Yield, GSI
Genotypes | Seed Source |
|---|---|
EH012020-7 | EIAR, Holetta Agriculture Research Center |
EH012019-1 | EIAR, Holetta Agriculture Research Center |
EH012009-2 | EIAR, Holetta Agriculture Research Center |
EH012004-2 | EIAR, Holetta Agriculture Research Center |
EH012025-2 | EIAR, Holetta Agriculture Research Center |
ESN 130227-5 | EIAR, Holetta Agriculture Research Center |
ESN 130234-4 | EIAR, Holetta Agriculture Research Center |
ESN 130233-1 | EIAR, Holetta Agriculture Research Center |
ESN 130233-4 | EIAR, Holetta Agriculture Research Center |
ESN 130233-3 | EIAR, Holetta Agriculture Research Center |
Hortu | Released from Sinana |
Local check | Local cultivar |
Sources of Variations | Degree freedom | Sum Squares | Mean Squares |
|---|---|---|---|
YEAR (Y) | 2 | 5.935 | 2.967** |
Location (L) | 2 | 4.209 | 2.104** |
Replication | 3 | 1.013 | 0.338 |
Genotype (G) | 11 | 150.980 | 13.726** |
Y X L | 4 | 46.090 | 11.523** |
L X G | 22 | 14.271 | 0.649** |
Y X L X G | 66 | 33.080 | 0.501** |
RESIDUAL | 321 | 70.650 | 0.220 |
TOTAL | 431 | 774.2 |
Entry | Treat code | Sinana 2022 | Agarfa 2022 | Goba 2022 | Sinana 2023 | Agarfa 2023 | Goba 2023 | Sinana 2024 | Agarfa 2024 | Goba 2024 | TRT MEANS |
|---|---|---|---|---|---|---|---|---|---|---|---|
ESN 130234-4 | 7 | 3.69 | 3.23 | 3.32 | 3.11 | 3.07 | 3.01 | 3.56 | 2.14 | 2.92 | 3.12 |
ESN 130233-3 | 10 | 2.85 | 3.10 | 2.54 | 2.89 | 2.99 | 2.73 | 3.35 | 2.76 | 2.79 | 2.89 |
ESN 130227-5 | 6 | 2.76 | 2.29 | 2.30 | 2.56 | 3.03 | 2.92 | 2.44 | 2.73 | 2.64 | 2.63 |
Hortu | 11 | 2.74 | 2.50 | 2.44 | 2.31 | 3.06 | 2.20 | 3.12 | 2.00 | 2.55 | 2.55 |
ESN 130233-4 | 9 | 1.88 | 2.42 | 2.70 | 2.51 | 2.56 | 2.47 | 2.82 | 2.43 | 2.72 | 2.50 |
ESN 130233-1 | 8 | 1.44 | 2.06 | 1.50 | 1.35 | 2.65 | 1.50 | 2.24 | 1.07 | 2.23 | 1.78 |
EH012019-1 | 2 | 1.25 | 1.85 | 1.23 | 1.48 | 2.53 | 1.32 | 3.11 | 0.96 | 1.77 | 1.72 |
Local check | 12 | 1.21 | 1.58 | 1.16 | 1.47 | 2.37 | 1.16 | 2.96 | 0.94 | 2.46 | 1.70 |
EH012025-2 | 5 | 1.08 | 1.61 | 1.89 | 1.14 | 2.52 | 1.89 | 1.98 | 1.00 | 2.05 | 1.68 |
EH012020-7 | 1 | 1.15 | 1.50 | 0.89 | 1.72 | 2.45 | 1.23 | 3.08 | 1.18 | 1.23 | 1.60 |
EH012009-2 | 3 | 1.14 | 1.65 | 1.29 | 1.97 | 2.45 | 1.29 | 2.84 | 1.01 | 0.72 | 1.59 |
EH012004-2 | 4 | 0.75 | 1.11 | 0.84 | 1.04 | 1.52 | 0.85 | 1.96 | 1.09 | 1.54 | 1.19 |
Mean | 1.83 | 2.08 | 1.84 | 1.96 | 2.60 | 1.88 | 2.79 | 1.61 | 2.14 | 2.08 | |
LSD 5% | 42,2 | 20.75 | 60.3 | 58.2 | 71.5 | 60.9 | 84.6 | 44.6 | 72.1 | 21.7 | |
CV% | 16.0 | 19.0 | 23.0 | 21.0 | 19.0 | 23.0 | 21.0 | 19.0 | 23.0 | 22.6 |
Sources | DF. | SS | MS | TSS explained% | Cumulative% |
|---|---|---|---|---|---|
Genotypes | 11 | 37.75 | 3.43 | 59.32 | 59.32 |
Environment | 8 | 14.06 | 1.76 | 22.09 | 81.41 |
G X E | 88 | 11.84 | 0.13 | 18.60 | 100 |
AMMI COMPONENT 1 | 18 | 5.10 | 0.28** | 43.07 | 43.07 |
AMMI COMPONENT 2 | 16 | 2.79 | 0.17** | 23.56 | 66.63 |
AMMI COMPONENT 3 | 14 | 1.69 | 0.12** | 14.27 | 80.90 |
AMMI COMPONENT 4 | 12 | 1.09 | 0.91** | 9.21 | 90.11. |
RESIDUAL | 28 | 1.17 | 9.89 | 100 | |
TOTAL | 107 | 63.64 |
Trt C0 | Genotypes | Mean | Rank Yi | Slope (bi) | MS-DEV (S2di) | IPCA1 | IPCA2 | ASV | Rank ASV | GSI |
|---|---|---|---|---|---|---|---|---|---|---|
1 | EH012024-7 | 1.60 | 10 | 1.716* | 0.09 | -0.66 | -0.28 | 1.24 | 11 | 21 |
2 | EH012023-1 | 1.72 | 7 | 1.798* | 0.01 | -0.57 | 0.12 | 1.05 | 9 | 16 |
3 | EH012009-2 | 1.59 | 11 | 1.496 | 0.18 | -0.54 | -0.64 | 1.17 | 10 | 21 |
4 | EH012004-2 | 1.19 | 12 | 0.906 | 0.05 | 0.01 | 0.19 | 0.19 | 1 | 13 |
5 | EH012025-2 | 1.68 | 9 | 0.955 | 0.16 | 0.25 | 0.53 | 0.70 | 5 | 14 |
6 | ESN 130227-5 | 2.63 | 3 | 0.024* | 0.08 | 0.70 | -0.16 | 1.30 | 12 | 15 |
7 | ESN 130234-4 | 3.12 | 1 | 0.487 | 0.19 | 0.42 | -0.47 | 0.90 | 7 | 8 |
8 | ESN 130233-1 | 1.78 | 6 | 1.191 | 0.08 | 0.01 | 0.46 | 0.46 | 3 | 9 |
9 | ESN 130233-4 | 2.50 | 5 | 0.353* | 0.06 | 0.42 | 0.10 | 0.77 | 6 | 11 |
10 | ESN 130233-3 | 2.89 | 2 | 0.477* | 0.03 | 0.27 | -0.28 | 0.56 | 4 | 6 |
11 | Hortu | 2.55 | 4 | 0.861 | 0.04 | 0.14 | -0.11 | 0.28 | 2 | 6 |
12 | Local check | 1.70 | 8 | 1.736* | 0.08 | -0.45 | 0.55 | 0.99 | 8 | 16 |
AMMI | Additive and Multiplicative Interaction |
ASV | AMMI Stability Value |
GSI | Genotype Selection Index |
PCA | Pricipal Component Analysis |
| [1] | Amin M, Mohammad T, Khan AJ, Irfaq M, Ali A, Tahir GR (2005). Yield stability of spring wheat (Triticum aestivum L.) in the North West Frontier Province, Pakistan. Songklanakarin J. Sci. Technol. 2005; 27(6): 1147-1150. |
| [2] | Brancourt-Hulmel M, Lecomte C (2003) Effect of environmental variates on genotype x environment interaction of winter wheat: a comparison of biadditive factorial regression to AMMI. Crop Science 43, 608-617. |
| [3] | Crossa, J., Fox P. N., Pfeiffer, W. H., Rajaram, S., and Gauch, H. G. 1991 AMMI adjustment for statistical analysis of an interactional wheat yield trial. Theor. App Gent, 81: 27-37. |
| [4] | CSA, (2019). Agricultural sample survey. Report on area and production of major crops, Volume I. Addis Ababa, Pp. 14. |
| [5] | Duc G., Blancard S., Hénault C., Lecomte C., Petit M., Bernicot M.-H., et al. (2010). Potentiels etleviers pour developer la production et l'utilisation des protéagineux dans le cadred'uneagriculturedurable en Bourgogne. Innov. Agron. 11, 157–171. |
| [6] | Ebdon J, Gauch H. Additive main effect and multiplicative interaction analysis of national turf grass performance trials: I. Interpretation of genotype X Environment Interaction. Crop Sci. 2002; 42: 489-496. |
| [7] | Ferreira DF, Demetrio CGB, Manly BFJ, Machado AA, Vencovsky R (2006). Statistical model in agriculture: Biometrical methods for evaluating phenotypic stability in plant breeding. Cerne (Lavras). 2006; 12(4): 373-388. |
| [8] | Farshadfar E, Sutka J. 2003. Locating QTLs controlling adaptation in wheat using AMMI model. Cereal Res. Commun. 31: 249-254. |
| [9] | Gauch, H., 2006. Statistical analysis of yield trials by AMMI and GGE. Crop. Sci., 46(4), 1488-1500. |
| [10] | Gudeta Nepir Gurmu, Tade Bitima Mulisa, Alemu Lenco Gemechu, Kegna Gadisa Amena and Gemechu Nedi Terfa (2022). Evaluation of Field Pea (Pisum sativum L.) Varieties for Yield and Yield-Related Traits. Sarhad Journal of Agriculture 38(4): 1219-1227. |
| [11] | Haddis Yirga and Dargie Tsegay. (2013). Characterization of dekoko (Pisum sativum var. abyssinicum) accessions by qualitative traits in the highlands of Southern Tigray, Ethiopia. African Journal of Plant Science, 7(10): pp. 482–487. |
| [12] | Haussmann BIG, Hess DE, Reddy BVS, Mukuru SZ, Kayentao M, Welz HG, Geiger HH (2001) Pattern analysis of genotype x environment interaction for striga resistance and grain yield in African sorghum trials. Euphytica 122, 297-308. |
| [13] | Jacobsen SE, Jensen CR, Liu F (2012) Improving crop production in the arid Mediterranean climate. Field Crops Research 128, 34-47. |
| [14] | Moot DJ, McNeil DL (1995) Yield components, harvest index and plant type in relation to yield differences in field pea genotypes. Euphytica 86, 31-40. |
| [15] | Navabi A, Yang RC, Helm J, Spawer DM (2006). Can spring wheah growing mega-environments in the Northem Great Plain be dissected for representative locations or niche-adapted genotypes. Crops Science. 2006; 46: 1107-1116. |
| [16] | Natalia Georgieva, Ivelina Nikolova and Valentin Kosev (2015). Adaptation and stability of field peas (pisum sativum l.) Cultivars. JOGAE, 3(1): 1-10, 2015. |
| [17] | Nemecek T., Von Richthofen J.-S., Dubois G., Casta P., Charles R., Pahl H. (2008). Environmentalimpactsof introducing grain legumes into European crop rotations. Eur. J. Agron. 28, 380–393. |
| [18] | Pinnschmidt HO, Hovmoller MS (2002) Genotype x environment interactions in the expression of net blotch resistance in spring and winter barley varieties. Euphytica 125, 227-243. |
| [19] | Purchase, J. L., Hatting H., and Vandenventer, C. S. 2000. Genotype x environment interaction of winter wheat in South Africa: II. Stability analysis of yield performance. South Afr J Plant Soil, 17: 101-107. |
| [20] | Shimelis Mohammed and Mukerem Elias (2025). Evaluation and Adaptation Trial of Field Pea Varieties for the Central Ethiopia Region. Trends Agric. Sci. 4(2): 149-155, 2025. |
| [21] | Tamene, T., Gemechu, K., Tadese, S., Mussa, J., Yeneneh, B., 2013. Genotype × Environment interaction and performance stability for grain yield in field pea (Pisum sativum L.) genotypes. Int. J. Plant Breed., 7(2), 116-123. |
| [22] | Uzun A, Bilgili U, Sincik M, Filya I, Acıkgoz E (2005). Yield and quality performances of forage type pea strains contrasting leaf types. Eur. J. Agron. 2005; 22: 85-94. |
| [23] | Yayis, R., Agdew, B., Yasin, G., 2014. GGE and AMMI biplot analysis for field pea yield stability in SNNPR state, Ethiopia. Int. J. Sustain. Agr. Res., 1(1), 28-38. |
| [24] | Zinsou V, Wydra K, Ahohuendo B, Hau B (2005) Genotype x environment interactions in symptom development and yield of cassava genotypes with artificial and natural cassava bacterial blight infections. European Journal of Plant Pathology 111, 217-233. |
APA Style
Tadesse, T., Asmare, B., Tekalign, A., Aliy, M. (2025). Grain Yield Stability Evaluation In Field Pea Using AMMI Model in the Highlands of Bale, Southern Ethiopia. Mathematical Modelling and Applications, 10(2), 24-30. https://doi.org/10.11648/j.mma.20251002.11
ACS Style
Tadesse, T.; Asmare, B.; Tekalign, A.; Aliy, M. Grain Yield Stability Evaluation In Field Pea Using AMMI Model in the Highlands of Bale, Southern Ethiopia. Math. Model. Appl. 2025, 10(2), 24-30. doi: 10.11648/j.mma.20251002.11
AMA Style
Tadesse T, Asmare B, Tekalign A, Aliy M. Grain Yield Stability Evaluation In Field Pea Using AMMI Model in the Highlands of Bale, Southern Ethiopia. Math Model Appl. 2025;10(2):24-30. doi: 10.11648/j.mma.20251002.11
@article{10.11648/j.mma.20251002.11,
  author = {Tadele Tadesse and Belay Asmare and Amanuel Tekalign and Mesud Aliy},
  title = {Grain Yield Stability Evaluation In Field Pea Using AMMI Model in the Highlands of Bale, Southern Ethiopia
},
  journal = {Mathematical Modelling and Applications},
  volume = {10},
  number = {2},
  pages = {24-30},
  doi = {10.11648/j.mma.20251002.11},
  url = {https://doi.org/10.11648/j.mma.20251002.11},
  eprint = {https://article.sciencepublishinggroup.com/pdf/10.11648.j.mma.20251002.11},
  abstract = {To identify high yielding and stable field pea genotypes in the highlands of bale, twelve field pea genotypes were evaluated at three locations, Sinana, Goba and Agarfa in the highlands of Bale southeastern Ethiopia, for three consecutive years 2022-2024 cropping season using randomized complete block design with three replications. The combined analysis over locations and years revealed significant variation of mean grain yield for genotypes, environments and genotype by environment interaction at P<0.01. The AMMI analysis also revealed significant variation for all AMMI components. The genotypes contributed about 59.32% of the total sum squares followed by environment which is responsible for 22.09% of the total sum square and 18.60% of the variation is accounted due to genotypes by environment interaction. The first AMMI1 is accounted for 43.07% of the interaction sum of square whereas the second AMMI components accounted for 23.56% variation of the interaction sum of square. The two components cumulatively accounted for 66.63% of the variation of the interaction sum of square. Using AMMI Stability Value (ASV) G4, G11, G8, and G10 are considered as stable genotypes. Since the most stable genotypes are not high yielder, the GSI revealed G10, and G11 are the stable once whereas G7 and G8 are moderately stable. Since G7 and G10 having high mean grain yield over the checks with yield advantage of 22.4 and 13.4, respectively and also showed stable performance over the testing environments, they have been identified as candidate genotypes to be verified for possible release for the highlands of bale and similar agro-ecologies.
},
 year = {2025}
}
TY  - JOUR
T1  - Grain Yield Stability Evaluation In Field Pea Using AMMI Model in the Highlands of Bale, Southern Ethiopia

AU  - Tadele Tadesse
AU  - Belay Asmare
AU  - Amanuel Tekalign
AU  - Mesud Aliy
Y1  - 2025/09/08
PY  - 2025
N1  - https://doi.org/10.11648/j.mma.20251002.11
DO  - 10.11648/j.mma.20251002.11
T2  - Mathematical Modelling and Applications
JF  - Mathematical Modelling and Applications
JO  - Mathematical Modelling and Applications
SP  - 24
EP  - 30
PB  - Science Publishing Group
SN  - 2575-1794
UR  - https://doi.org/10.11648/j.mma.20251002.11
AB  - To identify high yielding and stable field pea genotypes in the highlands of bale, twelve field pea genotypes were evaluated at three locations, Sinana, Goba and Agarfa in the highlands of Bale southeastern Ethiopia, for three consecutive years 2022-2024 cropping season using randomized complete block design with three replications. The combined analysis over locations and years revealed significant variation of mean grain yield for genotypes, environments and genotype by environment interaction at P<0.01. The AMMI analysis also revealed significant variation for all AMMI components. The genotypes contributed about 59.32% of the total sum squares followed by environment which is responsible for 22.09% of the total sum square and 18.60% of the variation is accounted due to genotypes by environment interaction. The first AMMI1 is accounted for 43.07% of the interaction sum of square whereas the second AMMI components accounted for 23.56% variation of the interaction sum of square. The two components cumulatively accounted for 66.63% of the variation of the interaction sum of square. Using AMMI Stability Value (ASV) G4, G11, G8, and G10 are considered as stable genotypes. Since the most stable genotypes are not high yielder, the GSI revealed G10, and G11 are the stable once whereas G7 and G8 are moderately stable. Since G7 and G10 having high mean grain yield over the checks with yield advantage of 22.4 and 13.4, respectively and also showed stable performance over the testing environments, they have been identified as candidate genotypes to be verified for possible release for the highlands of bale and similar agro-ecologies.

VL  - 10
IS  - 2
ER  -
Pulse and Oil Crops Department, Oromia Agriculture Research Institute, Sinana Agriculture Researche Center, Bale, Ethiopia
Information