Abstract
Are more sustainable companies also more profitable? Against a backdrop of greater disclosure in sustainable finance regulation, particularly in the European Union, there has been considerable focus on indicators of environmental, social and governance performance in corporate operations. This focus on the systems and processes which companies have in place - which enable them to produce, manufacture, distribute or deliver a service in ways which limit negative sustainability outcomes - is about de-risking operations and value protection. The ‘other side’ of sustainability in markets is about opportunities and value creation. Public market research from banks and market data firms has analysed correlation between stock price performance and revenues derived earned from sustainability-aligned activities. This question is less easy to answer in private markets, where relevant data is not typically aggregated across firms. Thus, such analysis is largely missing in relation to companies held in the portfolios of private equity investors. This paper draws on a proprietary means of collating data for private equity investments, via which revenues are demarcated to 37 sustainability trends, and finds a relatively weak degree of positive correlation - that across 50 companies, those with revenues which experience greater support from sustainability-linked drivers are slightly more likely to also achieve greater EBIT (earnings before interest and taxes) margins. If the result of the research for this paper were to be replicated for a larger sample, and therefore at a more statistically significant scale, it is the author’s belief that this would demonstrate a high likelihood that companies which derive a greater share of revenues from products and services which are solutions to sustainability challenges, are also able to be more profitable. This would, in turn, be valuable to such companies and industries in attracting lower-cost capital, facilitating growth and accelerating the speed at which economies and societies can address environmental challenges and crisis.
|
Published in
|
Journal of Investment and Management (Volume 14, Issue 2)
|
|
DOI
|
10.11648/j.jim.20251402.11
|
|
Page(s)
|
24-33 |
|
Creative Commons
|

This is an Open Access article, distributed under the terms of the Creative Commons Attribution 4.0 International License (http://creativecommons.org/licenses/by/4.0/), which permits unrestricted use, distribution and reproduction in any medium or format, provided the original work is properly cited.
|
|
Copyright
|
Copyright © The Author(s), 2025. Published by Science Publishing Group
|
Keywords
Sustainable Finance, Taxonomy, Sustainability-aligned Revenue
1. Introduction - From Operational to Strategic Sustainability as a Value Driver
The growth of sustainability has been a prominent feature in investment approaches and financial markets in recent years. Sustainability in finance is often measured and understood through a broad range of ‘ESG’ (environmental, social and governance) metrics and ideas. A useful definition of ESG is offered by Harvard Law
. “
ESG describes a set of factors used to measure the non-financial impacts of particular investments and companies. At the same time, ESG also provides a range of business and investment opportunities.”
Within this growth of sustainability in finance, there has perhaps been a greater focus on how investee companies operate - what are the systems and processes they have in place which enable them to produce, manufacture, distribute or deliver a service in ways which limit negative sustainability outcomes. This is about de-risking operations.
Given that lower risks to a company’s operations should mean lower risk to investor returns, then valuations can be positively impacted. Markets pay more for a return percentage with a lower risk profile, than for the same average return over time where there is more risk, usually represented by volatility. This is a standard feature of market valuation, captured in formulae such as the capital asset pricing model (CAPM), Sharpe ratio and the Sortino ratio. Discussion of the relevance of such measures to sustainability is not the purpose of this paper.
Instead, the purpose of this paper is to consider ‘the other side’ of sustainability in markets - the strategic use of sustainability concepts to seek upside, as opposed to the defensive focus on sustainability as a means of value protection.
This idea is not new - many investors have sought to make returns by investing in renewable energy companies, for instance, for many years. Blackrock
- the world’s largest investor in terms of assets under management, talks about sustainable investing as involving the development of “
deeper insights about how value will be created going forward using ESG considerations”. The definition is extended to include “
investing in progress, and recognizing that companies solving the world’s biggest challenges can be best positioned to grow”.
However, the paper posits that there is an increasing relevance to this now. This greater relevance is attributed to the codification of the EU Taxonomy and similar schemes, and given regulations such as the Corporate Sustainability Reporting Directive (CSRD), in particular, which legislates around the EU Taxonomy. Public market analyses have indeed considered the relevance of sustainability to returns, whether operationally or in terms of products/industries, and private market analyses, which are fewer in number, have analysed sustainability operationally. This paper considers, via one private equity firm example, a means of understanding the value (via profit margins) in sustainability-aligned products and services.
2. EU Taxonomy, Associated Regulation and Comparable Schemes
There are several environmental taxonomies globally, each designed to classify and standardize sustainable activities and investments. Some of the key taxonomies include:
The EU taxonomy for sustainable activities is a classification system established by the European Union to determine whether an economic activity is environmentally sustainable. The European Commission
describes it as being “a cornerstone of the EU’s sustainable finance framework and an important market transparency tool”. As sustainable finance has grown as a concept and in scale in the markets, this codification brings a more robust approach to classifications, engendering confident in the market and providing a framework to avoid false claims. It includes criteria for various sectors and activities, in order to determine those that substantially contribute to the objectives of:
1) Climate change mitigation
2) Climate change adaptation
3) Sustainable use and protection of water and marine resources
4) Transition to a circular economy
5) Pollution prevention and control
6) Protection and restoration of biodiversity and ecosystems
The EU taxonomy helps investors and other stakeholders understand the extent to which a company's activities align with the EU's sustainability goals, specifically by considering the proportion of a company's:
total revenue derived from products or services
total capital expenditures, and
total operational expenditures - that are related to assets or processes associated with activities outlined in the Taxonomy.
The CSRD is legislation aligned with the broader EU push on sustainable finance, which is aimed at enhancing and standardizing sustainability reporting across companies operating within the EU. It requires companies to report on their sustainability impacts, including in relation to the EU Taxonomy. Companies falling under the scope of the CSRD are required to disclose in their annual reports the extent to which their activities are covered by the EU Taxonomy (described as eligibility with the taxonomy). They then must comply with the criteria set in the Taxonomy delegated acts (essentially designed to ensure that companies which carry out eligible activities do not do so in such a way that is harmful to people or other aspects of the environment). The CSRD should drive companies towards analysis of their activities against the EU taxonomy.
Adjacent initiatives
Beyond the EU, other taxonomies are emerging, designed to address local environmental and sustainability goals. The UK has developed its own Green Taxonomy, which aligns with the EU Taxonomy, but is described by HM Treasury as being tailored to the UK's specific environmental and economic context
. Canada is developing its own taxonomy to support sustainable finance, designed to reflect the country's environmental and economic priorities, including its significant natural resource sectors
. In parallel, several countries in Asia have introduced green bond standards which define activities supportive of broader environmental and sustainability agendas. China has established the China Green Bond Endorsed Project Catalogue, which outlines eligible projects for green bond issuance, and focuses on areas such as renewable energy, energy efficiency, pollution prevention and ecological protection (People’s Bank of China et al, 2021). Japan’s Green Bond Guidelines are part of Japan's broader efforts to promote sustainable finance and support the transition to a low-carbon economy (Ministry of the Environment, Japan
). The Association of Southeast Asian Nations (ASEAN) Green Bond Standards are based on the International Capital Market Association's Green Bond Principles
.
The purpose of this paper is not to critique the EU Taxonomy in terms of its coverage or scope. Other papers have done this, including for its complexity and difficulty in implementation (Ahlstrom and Sjafjell
| [25] | Hanna, Ahlström, and Sjåfjell Beate. 2022. “Complexity and Uncertainty in Sustainable Finance: An Analysis of the EU Taxonomy.” De Gruyter Handbook of Sustainable Development and Finance, 15-40. |
[25]
), for concerns around greenwashing (Anlar
and Svälas
| [44] | Svälas, Marit Eleni. 2023. “The EU Taxonomy: Gold Standard or Institutionalised Greenwashing?” |
[44]
), for its sectoral and technological biases (Atici
), the dangers it poses to small and medium-sized enterprises (Goodall
and Leempoel
), and other factors.
Instead, this paper simply seeks to describe a model, in usage at a single private markets investment firm, for revenue categorisation which is in line with sustainability trends and underlying themes, where these go beyond environmental themes. The framework developed seeks to categorise and classify revenues also in line with social and governance trends and themes, as described in
Table 1.
3. Extant Environmental Revenue Classification Frameworks
Several existing framework tools have been developed which measure sustainability-aligned revenues. Some prominent examples, which pre-date the EU taxonomy, include the following:
1) The HSBC Climate Solutions Database is a proprietary tool developed by HSBC Global Research, based within its investment bank, to screen and analyze global companies that offer solutions to mitigate and adapt to the impacts of climate change. The database comprises over 3,000 global companies with varying levels of climate-related revenue exposure, across four climate sectors (renewable energy, energy efficiency, pollution prevention, and ecological protection) and 21 climate themes. The HSBC Database is subsequently used to create dynamic baskets of stocks around specific ideas, such as climate-smart cities, emerging market climate stocks and green dividend income.
2) Similar to the HSBC Database is the FTSE Russell Green Revenues Classification System, which is described as being “designed to measure the revenue exposure of public companies to green goods, products and services that contribute to the transition to a green economy”. It covers a wide range of sectors and activities, including renewable energy, energy efficiency, water technology, waste management, pollution control, and sustainable agriculture, among others. The FTSE product can also be used for constructing green investment portfolios, benchmarking and reporting.
3) A third such product is the Bloomberg Industry Classification Standard (BICS) Environmental, Social, and Governance (ESG) Data Service, which includes a comprehensive set of data and analytics to help investors assess ESG performance of companies, including providing detailed data on companies' revenue exposure to various green and sustainable activities (including renewable energy, energy efficiency, sustainable water, green building, pollution prevention, and other environmentally beneficial products and services).
However, these frameworks are focussed only on public companies. There is no comparable system readily available to a private market investor seeking to understand revenues for companies within existing portfolios, or for companies being analysed for potential investment or acquisition. This is due to a lack of available data flowing from a financial services industry which has historically faced lower disclosure requirements, both in terms of financial and accounting rules and sustainability-focused regulation.
From public to private markets
In private markets, tools which classify revenues against sustainability themes could drive multiple benefits, including:
First, from a regulatory perspective, analysing and tracking sustainability-aligned revenues can assist with Article-8 or Article-9 alignment of Funds.
Second, such tools can be used in investor relations, where existing or new investors can be shown evidence of how fund capital is being deployed into companies with sustainability tailwinds for their products or services.
Third, to enable consistency in analysis of tailwinds and headwinds during ‘sourcing’ - i.e. identifying investment targets for funds that partially or only invest in companies where sustainability-alignment is required or desirable, in meeting mandates and financial goals - and due diligence of potential investments.
Fourth, throughout ownership of a portfolio company (PC), transition in business models to gain greater alignment with sustainability themes over time, or indeed to transition to lower alignment.
Fifth, such tools can enable internal analysis, including of which funds have greater sustainability-aligned revenue or are transitioning in that direction, and similarly for comparison between investments in different sectors.
Sixth, when it comes to exiting from an investment, the data collected in such tools can form part of marketing of the portfolio company to potential buyers.
A private market sustainable-revenue tool
A private equity investment firm has built a system for categorising portfolio company revenue streams where they are catalysed, positively or negatively, by a range of sustainability trends (see Exhibit 1). Triton Partners, where the author is employed as Head of Sustainable Investing, has developed the Sustainability Alignment Tool (SAT).
This framework was developed taking into account multiple other existing categorisations of sustainability drivers, including from the Sustainable Accounting Standards Board (Korney
) and World Economic Forum (Walter, 2021). Meanwhile, there are global initiatives and standards which influence environmental taxonomies, such as the United Nations Sustainable Development Goals (SDGs) and the Global Reporting Initiative (GRI). Overall, these initiatives push progress towards a unified approach to sustainability reporting and investment.
The SAT also seeks to classify a broader range of sustainability themes, rather than focus only on environmental themes, as do most public market frameworks. The SAT maps revenues against the high-level sustainability trends and underlying themes shown in Exhibit 1. (To illustrate, Climate change is a trend, with two underlying themes - Decarbonisation & energy transition and Climate change adaptation.)
Table 1. Triton’s Sustainability Alignment Framework - Eight overarching trends, with 37 underlying themes.
Climate change | Healthy people |
1) Decarbonisation and energy transition 2) Climate change adaptation | 1) Medtech 2) Emergent disease and risk 3) Workplace and Traffic safety 4) Healthy working environment 5) Healthcare provision 6) Sport & wellbeing 7) Food & nutrition |
Natural resources | Demographic change |
1) Water resilience 2) Soil improvement 3) Clean air 4) Resource efficiency 5) Circular economy | 1) Urbanisation 2) Rise of EM middle class 3) Ageing populations 4) Diversity & inclusion 5) Social mobility & equality 6) More education |
Biodiversity loss | Fairness & good governance |
1) Forest protection 2) Healthy ecosystems 3) Intact marine and aquatic systems | 1) Data privacy and security 2) Human rights 3) Anti-corruption 4) Ethics 5) Fair corporate governance 6) Executive pay 7) Tax Integrity |
Housing & construction | Transparency & accountability |
1) Green buildings 2) Affordability 3) Rapid response building and repurposing 4) Home working and design focus | 1) Digital transparency 2) Corporate accountability 3) Supply chain management |
In 2024, Triton conducted a full analysis of the PE portfolio, to understand how PC revenue is aligned to these sustainability trends and themes. In analysing the existing portfolio, 50 portfolio companies were analysed. This required consideration of over 400 revenue streams, with 158 of these subsequently categorised per the SAT’s sustainability themes. 104 revenue streams were considered to have a sustainability tailwind.
The process of categorising the revenue streams of PCs against themes involved a discussion between members of the internal ESG team, and the sector investment analysts responsible for working with each portfolio company. Portfolio companies could be adjudged to be deriving different revenue streams which separately and simultaneously experience headwinds or tailwinds. Additionally, individual revenue streams were, in some instances, also identified with multiple headwinds or tailwinds, and this would influence the overall categorisation.
4. Performance
A key question for those engaging in sustainable investing activities is - does it lead to outperformance? Evidence from public markets suggests this can be the case.
Firstly, for companies with higher operational ESG performance, numerous studies have found a positive relationship with financial performance. Several meta-studies have also concluded the same. ‘Grey literature’ or non-academic studies, in this case by market participants, also described research showing outperformance by those companies with higher ESG ratings or performance.
Of greater relevance to this research paper, however, is the research which studied financial performance for companies providing sustainability-aligned solutions to market.
In terms of green revenues at listed companies, several studies have found a positive relationship. HSBC Global Research has been a frontrunner in this area, with numerous studies drawing on data from its Climate Solutions Database finding outperformance of companies with environment-aligned revenue streams relative to their benchmarks. In its recent Climate Solutions Playbook 2024 - Investing in the transition, HSBC analysts found that stocks in the bank’s Climate Solutions Database, which are those earning more than 10% of revenue from climate and environment themes, have outperformed its benchmark, the FTSE All World Index (AWI) over most timeframes. The Database has delivered an annualised total return of 17% over 10 years, 23% over five years, 14% over three years and 20% over the past year. This compares with the AWI returning 7%, 9%, 5% and 23%, over the same timeframes. Style screen strategies drawing from the index have also seen outperformance. The report noted that companies transitioning in the direction of green revenues have outperformed over five years (the longest timeframe for which the research was carried out) by 189% vs the AWI.
FTSE Russell, in its Green Revenues Index Series, tracks the performance of companies generating green revenues
| [9] | Charlo, Maria J., Ismael Moya, and Ana M. Muñoz. 2013. “Sustainable Development and Corporate Financial Performance: A Study Based on the FTSE4Good IBEX Index.” Business Strategy and the Environment 24(4): 277-88. https://doi.org/10.1002/bse.1824 |
[9]
. Their reports and index performance data can be accessed on their website. A recent analysis by the London Stock Exchange Group (LSEG
) showed outperformance over a period of five years for the Russell 1000 Green Revenues 50 Index, which measures the performance of large-cap companies in the US engaged in the transition to a green economy, when compared with the Russell 1000 benchmark. The former experienced a 20.7% AGR vs 15.6% for the benchmark. However, over the past three years, the Green Revenues 50 underperformed, registering 5.4% vs 10.9%.
In relation to the EU taxonomy, Bassen et al
| [6] | Bassen, Alexander, Othar Kordsachia, Kerstin Lopatta and Weiqiang Tan, 2024. “Revenue alignment with the EU taxonomy regulation in developed markets.” Journal of Banking & Finance (170). |
[6]
looked at revenue alignment with the EU taxonomy regulation in developed public markets, publishing results which offer support for a significant estimated taxonomy-alignment premium, which the authors describe as compatible with the interpretation that investors already apply the taxonomy regulation and allocate capital to taxonomy-aligned companies”, and concluding that traditional ESG ratings cannot explain the taxonomy premium.
S&P Global publishes research on ESG factors and their impact on financial performance. One research project looked for a relationship between EU Taxonomy-aligned revenue share an any outperformance/ underperformance (Hynes and Horak
). The Trucost division at S&P ran a 10-Year back test on the green basket, taken from a universe of over 15,000 listed companies, bucketed into five quintiles, which were country and sector neutral. The study shows outperformance over time, quintile on quintile. Quintile 1, which contains the companies that have the highest exposure to green revenue from the Green Basket, outperformed Quintile 5 (lowest exposure) on average by 22 bps/month, or an average Top/Bottom Spread of 2.59% annually.
Some research was less conclusive. Dimitriadis et al (2024), investigate the impact, of what the paper terms the ‛environmentally-friendly’ character of stocks, on the market price of risk. To do so, fifty-two highly capitalized stocks, across the major economic sectors, are analysed through the prism of green bond issuance, as a proxy for the issuing company being ‛environmentally-friendly’. The paper concludes that the ‛green character’ of companies lowers the market price of stocks in those sectors which experience greater volatility, namely Financials and Real Estate, and increases risk premia due to higher probability for downwards movements.
Private Market Analysis
The market valuation of public companies can be tracked via their share price and therefore market capitalisation and enterprise value, private companies cannot be tracked easily in the same way. For private companies, value may be estimated during ownership, but live price discovery is not empirically practicable, and the true value can only truly be identified at the point of realisation, i.e. when exiting an investment, which can typically come in private equity strategies after a holding period of typically 4-7 years. Price achieved on exit can then be compared with price paid for an asset, to give a multiple on invested capital (MOIC). The MOIC can effectively be annualised to give an internal rate of return (IRR), which can serve as a more useful comparator with public market investments, including in terms of correlation with sustainability-aligned revenues.
At the time of writing this paper, no such data is available for exit multiples for companies for which green revenue data is also available. Therefore, valuation correlation cannot be drawn from this. However, profitability of companies is also interesting as a proxy (higher margins are more likely to draw higher valuations REFS). Therefore, this paper moves into its final section by considering a profit margin metric - Earnings before interest and tax (EBIT) - for the 50 companies invested in by Triton and analysed within the Sustainability Alignment Tool.
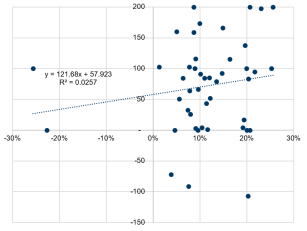
Figure 1. EBIT margin in 2023 (x-axis) and sustainability-aligned revenue factor (y-axis).
Exhibit 2 shows, on the Y or vertical axis, the overall sustainability aligned revenue factor, between -200 and +200, with the 50 PCs measured against this. The X axis, meanwhile, captures the EBIT margin for the 50 PCs. These are taken in each instance for the most recent reporting year, typically 2023. EBIT margin was chosen as a measure of profitability. The aim of this subsequent analysis is to see whether sustainability-aligned revenues (as measured by the SAT) are positively correlated with the profitability of the companies.
The chart could be seen as showing that, overall, the best-fit line generated in Microsoft Excel suggested a relatively weak degree of positive correlation - that across 50 companies, those with revenues which experience greater support from sustainability-linked drivers are slightly more likely to also achieve greater EBIT margins. However, this is a statistically insignificant sample set size, and is further challenged by the distribution of the companies in terms of sector, activity, size, geography. To obtain more meaningful results, the author posits that the methodology has relevance but a much larger data set, in terms of the number of companies analysed, would be necessary. This would likely require cooperation between multiple investment firms. If the result of the research for this paper were to be replicated at statistically significant scale, it is the author’s belief that this would demonstrate a high likelihood that companies which derive a greater share of revenues from products and services which are solutions to sustainability challenges, are also able to be more profitable. This would, in turn, be valuable to such companies and industries in attracting lower-cost capital, facilitating growth and accelerating the speed at which economies and societies can address environmental challenges and crisis.
5. Conclusion
This paper has sought to show a method for carrying out an analysis which has, so far, been largely lacking in private markets.
Overall, the results suggested a relatively weak degree of positive correlation - that across 50 companies, those with revenues which experience greater support from sustainability-linked drivers are slightly more likely to also achieve greater EBIT margins.
This analysis responds to themes which the author believes business journals have been exploring in greater detail in recent years, including portfolio management, profit drivers and risk management within private equity strategies, as well as links between sustainability and better financial outcomes. This article, the author contends, is relevant to these themes.
Nevertheless, there is considerable further research that can be done, to better understand the relationship between sustainability-aligned revenue and financial performance, in private equity. Examples ideas for where greater understanding would be of interest, include:
1) whether there is a positive relationship between the change over time in sustainability-aligned revenues and change in profit margin
2) relationship between identification of sustainability-aligned revenues and the decision to invest
3) relationship between profit margin, sustainability-aligned revenue and operational ESG performance scores
4) sectoral breakdown - showing whether sustainability-aligned revenues are more correlated with financial metrics in some industries than others
5) geographic breakdown - showing whether sustainability-aligned revenues are more correlated with financial metrics in some industries than others
6) which sustainability themes have a greater correlation with improved financial metrics
7) broadening the research from sustainability-aligned revenue to sustainability-aligned capital expenditure, operational expenditure and other metrics
In all cases, gathering large enough datasets from which to draw meaningful conclusions would be a challenge, given the relatively small number and disparate range of companies invested in by individual private equity houses.
In conclusion, this avenue of research - namely, analysis of sustainability-linked revenues - has real-world applications, beyond regulation-driven catalysts. In November 2024 alone (the month this paper was being written), there were several developments in this area, including:
Ursula von der Leyen announcing that the taxonomy may be combined with other European regulations, namely the CSRD and CSDDD. This may again redefine the role of green revenues, or broader sustainability-aligned revenues, in corporate activity and investment behaviour
the California Public Employees' Retirement System (CALPERS
| [7] | 2025, CALPERS. 2024. “Sustainable Investments - Annual Program Review.” Https://Www.calpers.ca.gov/Docs/Board-Agendas/202411/Invest/Item05d-01_a.pdf |
[7]
) stated decision to change its definition of climate solutions, tightening it and removing patents as an inclusion mechanism in its own right, leading to some companies being removed from the portfolio of climate solutions [3xl] the second iteration of the Private Markets Decarbonisation Roadmap (PMDR) has also been expanded to include whether a company enables a net zero transition through its activities, which commentators are taking to include climate solutions being provided (Bain & Co
).
Therefore, the author concludes that more research into the performance of sustainability-aligned business activities, in both public and private markets, can be beneficial. This is because it has the potential to provide confidence in markets around decision-making on directing capital flows towards products, services and solutions which address sustainability challenges. Private companies, with their longer investment horizons and less emphasis on short-term market-to-market performance, are uniquely positioned to focus on the development and offering of sustainable solutions to environmental and societal problems. This may be particularly relevant in some regions, Europe and Asia, where the demand for sustainable solutions is high and often backed by governments.
Key takeaways
1) Several existing framework tools have been developed which measure sustainability-aligned revenues of listed companies. There has been no comparable system readily available for private market investors seeking to understand revenues for companies within existing portfolios, or being analysed for potential investment.
2) Such a framework can facilitate regulatory compliance, investor reporting, analysis of thematic tailwinds during sourcing of investments, tracking of portfolio company transition over time, and other benefits.
3) Triton Partners, a private equity investment firm, has developed a system for categorising revenue streams of 50 portfolio companies, where these are catalysed by a range of sustainability trends. The analysis suggested that those with revenues which experience support from sustainability-linked drivers are slightly more likely to achieve greater EBIT margins.
Abbreviations
ASEAN | The Association of Southeast Asian Nations |
BICS | Bloomberg Industry Classification Standard |
CALPERS | California Public Employees Retirement Scheme |
CAPM | Capital Asset Pricing Model |
CSDDD | Corporate Sustainability Due Diligence Directive |
CSRD | Corporate Sustainability Reporting Directive |
EBIT | Earnings Before Interest and Tax |
ESG | Environmental, Social and Governance |
EU FTSE | European Union Financial Times Stock Exchange |
GRI | Global Reporting Initiative |
HM | Her Majesty’s |
IRR | Internal rate of return |
MOIC | Multiple on invested capital |
PE | Private equity |
PMDR | Private Markets Decarbonisation Roadmap |
ROA | Return on Assets |
ROE | Return on Equity |
SAT | Sustainability Alignment Tool |
SDGs | Sustainable Development Goals |
SFDR | Sustainable Finance Disclosure Regulation |
UN PRI | United Nations Principles for Responsible Investment |
Author Contributions
Ashim Paun is the sole author. The author read and approved the final manuscript.
Conflicts of Interest
The authors declare no conflicts of interest.
References
| [1] |
ACMF. 2021. “ASEAN Capital Markets Forum.” Theacmf.org. 2021.
https://www.theacmf.org/sustainable-finance/publications/asean-green-bond-standards
|
| [2] |
Anlar, Seden. 2022. “EU Taxonomy: The Dirty Politics of Greenwashing Energy.” Green European Journal. July 13, 2022.
https://www.greeneuropeanjournal.eu/the-dirty-politics-of-greenwashing-energy/
|
| [3] |
Atici, Hilal. 2021. “EU Taxonomy Is Greenwashing Tactic, Say NGOs.” Green Central Banking. April 21, 2021.
https://greencentralbanking.com/2021/04/21/eu-taxonomy-is-greenwash-say-ngos/
|
| [4] |
Bain & Co. 2023. “2023 Global Private Equity Report.”
https://www.bain.com/globalassets/about/2023-global-pe-report---roadshow-deck.pdf
|
| [5] |
Bain & Co. 2024. “PMDR Guidance and Supporting Tool.” 2024.
https://www.bain.com/how-we-help/private-markets-decarbonization-roadmap/pmdr-guidance-and-supporting-tool/
|
| [6] |
Bassen, Alexander, Othar Kordsachia, Kerstin Lopatta and Weiqiang Tan, 2024. “Revenue alignment with the EU taxonomy regulation in developed markets.” Journal of Banking & Finance (170).
|
| [7] |
2025, CALPERS. 2024. “Sustainable Investments - Annual Program Review.” Https://Www.calpers.ca.gov/Docs/Board-Agendas/202411/Invest/Item05d-01_a.pdf
|
| [8] |
Cambridge Dictionary. 2024. “Cambridge Dictionary | English Dictionary, Translations & Thesaurus.” Cambridge.org. 2024.
https://dictionary.cambridge.org
|
| [9] |
Charlo, Maria J., Ismael Moya, and Ana M. Muñoz. 2013. “Sustainable Development and Corporate Financial Performance: A Study Based on the FTSE4Good IBEX Index.” Business Strategy and the Environment 24(4): 277-88.
https://doi.org/10.1002/bse.1824
|
| [10] |
Chaudhry, Ashraf, and Helen L. Johnson. 2008. “The Efficacy of the Sortino Ratio and Other Benchmarked Performance Measures under Skewed Return Distributions.” Australian Journal of Management 32(3): 485-502.
https://doi.org/10.1177/031289620803200306
|
| [11] |
Clark, Gordon L, Andreas Feiner, and Michael Viehs. 2015. “HOW SUSTAINABILITY CAN DRIVE FINANCIAL OUTPERFORMANCE.”
https://arabesque.com/research/From_the_stockholder_to_the_stakeholder_web.pdf
|
| [12] |
Deckelbaum, Ariel, Brad Karp, David Curran, Jeh Charles Johnson, Loretta Lynch, and Mark Bergman. 2020. “Introduction to ESG.” The Harvard Law School Forum on Corporate Governance. August 1, 2020.
https://corpgov.law.harvard.edu/2020/08/01/introduction-to-esg/
|
| [13] |
Dimitriadis, K. A., Koursaros, D., & Savva, C. S., 2024. The influence of the “environmental-friendly” character through asymmetries on market crash price of risk in major stock sectors. Journal of Climate Finance, 9, 100052.
|
| [14] |
Endo, Kazumi. 2019. “Does the Stock Market Value Corporate Environmental Performance? Some Perils of Static Regression Models.” Corporate Social Responsibility and Environmental Management, May.
https://doi.org/10.1002/csr.1767
|
| [15] |
European Commission. 2023. “EU Taxonomy for Sustainable Activities.” European Commission. 2023.
https://finance.ec.europa.eu/sustainable-finance/tools-and-standards/eu-taxonomy-sustainable-activities_en
|
| [16] |
European Union. 2019. “EUR-Lex - 32019R2088 - EN - EUR-Lex.” Europa.eu. 2019.
https://eur-lex.europa.eu/legal-content/EN/TXT/?uri=celex%3A32019R2088
|
| [17] |
Fama, Eugene F., and Kenneth R. French. 2004. “The Capital Asset Pricing Model: Theory and Evidence.” Journal of Economic Perspectives 18(3): 25-46.
|
| [18] |
Flammer, Caroline. 2015. “Does Corporate Social Responsibility Lead to Superior Financial Performance? A Regression Discontinuity Approach.” Management Science 61(11): 2549-68.
https://doi.org/10.1287/mnsc.2014.2038
|
| [19] |
Friede, Gunnar, Timo Busch, and Alexander Bassen. 2015. “ESG and Financial Performance: Aggregated Evidence from More than 2000 Empirical Studies.” Journal of Sustainable Finance & Investment 5(4): 210-33.
|
| [20] |
Friede, Gunnar, Michael Lewis, Alexander Bassen, and Timo Busch. 2015. “ESG & Corporate Financial Performance: Mapping the Global Landscape Deutsche Asset & Wealth Management S11.”
https://www.dws.com/AssetDownload/Index?assetGuid=caef8dc7-510d-4dfb-8c3a-cf139335414b
|
| [21] |
Giese, Guido, Linda-Eling Lee, Dimitris Melas, Zoltán Nagy, and Laura Nishikawa. 2019. “Foundations of ESG Investing: How ESG Affects Equity Valuation, Risk, and Performance.” The Journal of Portfolio Management 45(5): 69-83.
https://doi.org/10.3905/jpm.2019.45.5.069
|
| [22] |
Gompers, Paul A., Steven N. Kaplan, and Vladimir Mukharlyamov. 2014. “What Do Private Equity Firms (Say They) Do?” Journal of Financial Economics 121(3): 449-76.
https://doi.org/10.2139/ssrn.2447605
|
| [23] |
Goodall, Finn. 2024. “SMEs and Green Finance: Navigating the EU Taxonomy.” Esgresilience.eu. 2024.
https://esgresilience.eu/2024/08/15/smes-and-green-finance-navigating-the-eu-taxonomy/
|
| [24] |
Government of Canada, Department of Finance. 2023. “Taxonomy Roadmap Report.” Www.canada.ca. March 3, 2023.
https://www.canada.ca/en/department-finance/programs/financial-sector-policy/sustainable-finance/sustainable-finance-action-council/taxonomy-roadmap-report.html
|
| [25] |
Hanna, Ahlström, and Sjåfjell Beate. 2022. “Complexity and Uncertainty in Sustainable Finance: An Analysis of the EU Taxonomy.” De Gruyter Handbook of Sustainable Development and Finance, 15-40.
|
| [26] |
HM Treasury. 2024. “UK Green Taxonomy.” GOV. UK. November 14, 2024.
https://www.gov.uk/government/consultations/uk-green-taxonomy
|
| [27] |
Hynes, Liam, and Matyas Horak. 2020. “ESG Data Signals the Trucost EU Taxonomy Revenue Share Dataset Highlights.”
https://www.spglobal.com/marketintelligence/en/documents/esgdatasignals_trucosteutaxonomyrevenueshare-11.pdf
|
| [28] |
Khalid Azizuddin. 2024. “Potential Reopening of EU ESG Rules Prompt Fears among Green Investment Groups.” Responsible Investor. November 22, 2024.
https://www.responsible-investor.com/potential-reopening-of-eu-esg-rules-prompt-fears-among-green-investment-groups/#
|
| [29] |
Khan, Mozaffar, George Serafeim, and Aaron Yoon. 2016. “Corporate Sustainability: First Evidence on Materiality.” Papers.ssrn.com. Rochester, NY. November 9, 2016.
https://papers.ssrn.com/sol3/papers.cfm?abstract_id=2575912
|
| [30] |
Konar, Shameek, and Mark A. Cohen. 2001. “Does the Market Value Environmental Performance?” Review of Economics and Statistics 83(2): 281-89.
https://doi.org/10.1162/00346530151143815
|
| [31] |
Korney, Andrea. 2020. “SASB: A New Standard for Corporate Sustainability.” 2020.
https://www.wolterskluwer.com/en/expert-insights/sasb-a-new-standard-for-corporate-sustainability
|
| [32] |
Leempoel, Sebastien. 2023. “ESG Reporting for SME: What to Expect & Challenges.” Www.greenomy.io. December 21, 2023.
https://www.greenomy.io/blog/esg-reporting-smes-what-to-expect-and-challenges
|
| [33] |
LSEG. 2022. “FTSE Green Revenues Index Series.” Lseg.com. September 22, 2022.
https://www.lseg.com/en/ftse-russell/indices/green-revenues
|
| [34] |
Ministry of the Environment, Japan. 2022. “Green Bond and Sustainability Linked Bond Guidelines Green Loan and Sustainability Linked Loan Guidelines.”
https://www.env.go.jp/content/000128193.pdf
|
| [35] |
Miralles-Quiros, Maria del Mar, Jose Luis Miralles-Quiros, and Irene Guia Arraiano. 2017. “Are Firms That Contribute to Sustainable Development Valued by Investors?” Corporate Social Responsibility and Environmental Management 24(1): 71-84.
https://doi.org/10.1002/csr.1392
|
| [36] |
People's Bank of China, National Development and Reform Commission, and China Securities Regulatory Commission. 2021. “Green Bond Endorsed Projects Catalogue (2021 Edition).” 2021.
http://www.pbc.gov.cn/goutongjiaoliu/113456/113469/4342400/2021091617180089879.pdf
|
| [37] |
Pitchbook. 2023. “PitchBook’s Global Private Market Fundraising Report: An Unevenly Hard 2023 across the Industry.” 2023.
https://www.0100conferences.com/news/pitchbooks-global-private-market-fundraising-report-an-unevenly-hard-2023-across-the-industry
|
| [38] |
PREQIN. 2022. “Private Equity Managers Tap Private Wealth Market to Mitigate Weaker Fundraising Outlook -Preqin Global Report 2023.”
https://www.preqin.com/Portals/0/Documents/Preqin%20Global%20Report%202023%20Private%20Equity.pdf?ver=2022-12-14-085452-297
|
| [39] |
Schoar, Steve, Steve Kaplan, and Antoinette Schoar. 2004. “Private Equity Performance: Returns, Persistence and Capital Flows.” Repec.org. March 5, 2004.
https://econpapers.repec.org/paper/mitsloanp/5050.htm
|
| [40] |
Sharpe, William F. 1994. “The Sharpe Ratio.” The Journal of Portfolio Management 21(1): 49-58.
|
| [41] |
Shenjef Gerodrig. n.d. “Active Fixed Income.” BlackRock. Accessed November 10, 2024.
https://www.blackrock.com/us/individual/investment-ideas/active-fixed-income#sustainable-strategies
|
| [42] |
State Street Global Advisers. 2019. “The Impact of Board Diversity on Corporate Performance: New Evidence from a Large, Diverse and Long-Standing Sample.” October 2019.
|
| [43] |
Stefan, Ambec, and Lanoie Paul. 2008. “Does It Pay to Be Green? A Systematic Overview.” Academy of Management Perspectives 22(4): 45-62.
https://doi.org/10.5465/amp.2008.35590353
|
| [44] |
Svälas, Marit Eleni. 2023. “The EU Taxonomy: Gold Standard or Institutionalised Greenwashing?”
|
| [45] |
Wahba, Hayam. 2008. “Does the Market Value Corporate Environmental Responsibility? An Empirical Examination.” Corporate Social Responsibility and Environmental Management 15(2): 89-99.
https://doi.org/10.1002/csr.153
|
| [46] |
Walter, Jonathan. 2021. “2021: The Year of Living Dangerously for the Environment?” World Economic Forum. January 24, 2021.
https://www.weforum.org/stories/2021/01/will-2021-be-the-year-of-living-dangerously/
|
| [47] |
Zara, Claudio, 2019. “Does Sustainability Affect Private Equity Asset Class?” Bocconi Department of Finance.
https://ssrn.com/abstract=3152973
|
| [48] |
Zhang, Dayong, Zhao Rong, and Qiang Ji. 2019. “Green Innovation and Firm Performance: Evidence from Listed Companies in China.” Resources, Conservation and Recycling 144(May): 48-55.
https://doi.org/10.1016/j.resconrec.2019.01.023
|
| [49] |
Zhang, Xiaoyuan, Shenglian Wang, Nurul Azlin Azmi, and AHMAD. 2024. “Green Innovation and Firm Performance: An Empirical Study of China’s Power Industry.” Information Management and Business Review 16(3(I) S): 913-23.
https://doi.org/10.22610/imbr.v16i3(i)s.3939
|
Cite This Article
-
APA Style
Paun, A. (2025). Quantifying Sustainability-aligned Revenues: From Public to Private Market Approaches. Journal of Investment and Management, 14(2), 24-33. https://doi.org/10.11648/j.jim.20251402.11
 Copy
|
Copy
|
 Download
ACS Style
Paun, A. Quantifying Sustainability-aligned Revenues: From Public to Private Market Approaches. J. Invest. Manag. 2025, 14(2), 24-33. doi: 10.11648/j.jim.20251402.11
Copy
|
Download
AMA Style
Paun A. Quantifying Sustainability-aligned Revenues: From Public to Private Market Approaches. J Invest Manag. 2025;14(2):24-33. doi: 10.11648/j.jim.20251402.11
Copy
|
Download
-
@article{10.11648/j.jim.20251402.11,
  author = {Ashim Paun},
  title = {Quantifying Sustainability-aligned Revenues: From Public to Private Market Approaches
},
  journal = {Journal of Investment and Management},
  volume = {14},
  number = {2},
  pages = {24-33},
  doi = {10.11648/j.jim.20251402.11},
  url = {https://doi.org/10.11648/j.jim.20251402.11},
  eprint = {https://article.sciencepublishinggroup.com/pdf/10.11648.j.jim.20251402.11},
  abstract = {Are more sustainable companies also more profitable? Against a backdrop of greater disclosure in sustainable finance regulation, particularly in the European Union, there has been considerable focus on indicators of environmental, social and governance performance in corporate operations. This focus on the systems and processes which companies have in place - which enable them to produce, manufacture, distribute or deliver a service in ways which limit negative sustainability outcomes - is about de-risking operations and value protection. The ‘other side’ of sustainability in markets is about opportunities and value creation. Public market research from banks and market data firms has analysed correlation between stock price performance and revenues derived earned from sustainability-aligned activities. This question is less easy to answer in private markets, where relevant data is not typically aggregated across firms. Thus, such analysis is largely missing in relation to companies held in the portfolios of private equity investors. This paper draws on a proprietary means of collating data for private equity investments, via which revenues are demarcated to 37 sustainability trends, and finds a relatively weak degree of positive correlation - that across 50 companies, those with revenues which experience greater support from sustainability-linked drivers are slightly more likely to also achieve greater EBIT (earnings before interest and taxes) margins. If the result of the research for this paper were to be replicated for a larger sample, and therefore at a more statistically significant scale, it is the author’s belief that this would demonstrate a high likelihood that companies which derive a greater share of revenues from products and services which are solutions to sustainability challenges, are also able to be more profitable. This would, in turn, be valuable to such companies and industries in attracting lower-cost capital, facilitating growth and accelerating the speed at which economies and societies can address environmental challenges and crisis.},
 year = {2025}
}
Copy
|
Download
-
TY  - JOUR
T1  - Quantifying Sustainability-aligned Revenues: From Public to Private Market Approaches

AU  - Ashim Paun
Y1  - 2025/07/21
PY  - 2025
N1  - https://doi.org/10.11648/j.jim.20251402.11
DO  - 10.11648/j.jim.20251402.11
T2  - Journal of Investment and Management
JF  - Journal of Investment and Management
JO  - Journal of Investment and Management
SP  - 24
EP  - 33
PB  - Science Publishing Group
SN  - 2328-7721
UR  - https://doi.org/10.11648/j.jim.20251402.11
AB  - Are more sustainable companies also more profitable? Against a backdrop of greater disclosure in sustainable finance regulation, particularly in the European Union, there has been considerable focus on indicators of environmental, social and governance performance in corporate operations. This focus on the systems and processes which companies have in place - which enable them to produce, manufacture, distribute or deliver a service in ways which limit negative sustainability outcomes - is about de-risking operations and value protection. The ‘other side’ of sustainability in markets is about opportunities and value creation. Public market research from banks and market data firms has analysed correlation between stock price performance and revenues derived earned from sustainability-aligned activities. This question is less easy to answer in private markets, where relevant data is not typically aggregated across firms. Thus, such analysis is largely missing in relation to companies held in the portfolios of private equity investors. This paper draws on a proprietary means of collating data for private equity investments, via which revenues are demarcated to 37 sustainability trends, and finds a relatively weak degree of positive correlation - that across 50 companies, those with revenues which experience greater support from sustainability-linked drivers are slightly more likely to also achieve greater EBIT (earnings before interest and taxes) margins. If the result of the research for this paper were to be replicated for a larger sample, and therefore at a more statistically significant scale, it is the author’s belief that this would demonstrate a high likelihood that companies which derive a greater share of revenues from products and services which are solutions to sustainability challenges, are also able to be more profitable. This would, in turn, be valuable to such companies and industries in attracting lower-cost capital, facilitating growth and accelerating the speed at which economies and societies can address environmental challenges and crisis.
VL  - 14
IS  - 2
ER  -
Copy
|
Download