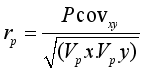
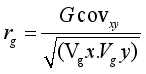
Coffee is still one of Ethiopian’s primary agricultural export crops accounting for more than 25% of export earnings. Arsi coffee is known to produce Harar C coffee quality grade and known for its unique flavor and aroma. Therefore, this study was conducted to determine association among coffee bean quality traits and, the direct and indirect effects of bean quality traits on overall quality of coffee. A total of 56 Arsi coffee accessions and four Hararghe coffee varieties were evaluated for bean physical and organoleptic coffee quality traits using Completely Randomized Design with three replications. The analysis of variance results showed significant variation among Arsi coffee accession for all traits except astringency, bitterness, and odor. The overall coffee quality had positive and significant phenotypic and genotype correlations with aromatic intensity, aromatic quality, acidity, body, flavor, overall standard quality and overall cup quality. These traits also had positive direct effects on overall coffee quality however; aromatic intensity and body exerted negligible negative direct effects at genotypic level whereas aromatic quality had negative direct effect at phenotypic level. All these traits through overall standard quality, and aromatic intensity, aromatic quality and acidity via each other and through body and flavor exerted positive direct effects on overall coffee quality at genotypic level. Thus majority of quality traits could be used for indirect selection of genotypes for overall coffee quality.
| Published in | Journal of Food and Nutrition Sciences (Volume 12, Issue 4) |
| DOI | 10.11648/j.jfns.20241204.14 |
| Page(s) | 196-204 |
| Creative Commons |
This is an Open Access article, distributed under the terms of the Creative Commons Attribution 4.0 International License (http://creativecommons.org/licenses/by/4.0/), which permits unrestricted use, distribution and reproduction in any medium or format, provided the original work is properly cited. |
| Copyright |
Copyright © The Author(s), 2024. Published by Science Publishing Group |
Cup Quality, Correlation, Path Coefficient Analysis
Acc. no. | Collection area | Woreda | Acc. no. | Collection area | Woreda |
|---|---|---|---|---|---|
Ar04/11 | Haro | Gololcha | Ar78/11 | Jinka Dhibu | Gololcha |
Ar08/11 | M/laga Buna | Chole | Ar50/11 | Manya Adare | Chole |
Ar40/11 | M/Warqi Darartu | Gololcha | Ar76/11 | Mine Gora | Gololcha |
Ar56 /11 | Mine Gora | Gololcha | Ar23/11 | M/Oda Adi | Chole |
Ar07/11 | M/laga Buna | Chole | Ar30/11 | Darartu | Chole |
Ar82/11 | Jinka Dhibu | Gololcha | Ar119/11 | Mine Gora | Gololcha |
Ar83/11 | Jinka Dhibu | Gololcha | Ar75/11 | Mine Gora | Gololcha |
Ar10/11 | M/laga Buna | Chole | Ar26/11 | M/Oda Adi | Chole |
Ar57/11 | Mine Gora | Gololcha | Ar72/11 | Mine Gora | Gololcha |
Ar53/11 | Manya Adare | Gololcha | Ar28/11 | M/Oda Adi | Chole |
Ar52/11 | Manya Adare | Chole | Ar74/11 | Mine Gora | Gololcha |
Ar63/11 | Mine Gora | Gololcha | Ar36/11 | M/Warqi Darartu | Chole |
Ar64/11 | Mine Gora | Gololcha | Ar44/11 | Manya Adare | Chole |
Ar65/11 | Mine Gora | Chole | Ar115/11 | Mine Gora | Gololcha |
Ar77/11 | Mine Gora | Gololcha | Ar46/11 | Manya Adare | Chole |
Ar87/11 | Jinka Dhibu | Chole | Ar33/11 | M/Warqi Darartu | Chole |
Ar88/11 | Jinka Dhibu | Gololcha | Ar118/11 | Mine Gora | Gololcha |
Ar15/11 | M/laga Buna | Chole | Ar47/11 | Manya Adare | Chole |
Ar18/11 | M/laga Buna | Gololcha | Ar69/11 | Mine Gora | Gololcha |
Ar19 /11 | M/laga Buna | Chole | Ar106/11 | Geda Seka | Chole |
Ar03/11 | Jeda Saqa | Chole | Ar102/11 | Geda Seka | Chole |
Ar84/11 | Jinka Dhibu | Gololcha | Ar95/11 | Geda Seka | Gololcha |
Ar38/11 | Darartu | Chole | Ar12/11 | M/laga Buna | Gololcha |
Ar101/11 | Geda Seka | Gololcha | Ar100/11 | Geda Seka | Gololcha |
Ar11/11 | M/laga Buna | Chole | Ar34/11 | Darartu | Chole |
Ar93/11 | Geda Seka | Gololcha | Ar103/11 | Geda Seka | Gololcha |
Ar21/11 | M/Oda Adi | Chole | Arusa | ||
Ar66/11 | Mine Gora | Gololcha | Mocha | Standard checks | |
Ar37/11 | M/Warqi Darartu | Chole | Mechara-1 | ||
Ar02/11 | Jeda Saqa | Chole | Bultum | ||
Parameters | Scale | Description of each scale | |||||
|---|---|---|---|---|---|---|---|
0 | 1 | 2 | 3 | 4 | 5 | ||
Aromatic intensity | 0-5 | Nil | V. light | Light | Medium | Strong | V. strong |
Aromatic quality | 0-5 | Nil | V. light | Light | Medium | Strong | V. strong |
Bitterness | 0-5 | Nil | V. light | Light | Medium | Strong | V. strong |
Astringency | 0-5 | Nil | V. light | Light | Medium | Strong | V. strong |
Parameters | Scale | Description of each scale | |||||
0 | 2 | 4 | 6 | 8 | 10 | ||
Acidity | 0-10 | Nil | Lacking | Light | Medium | M. pointed | pointed |
Body | 0-10 | Nil | V. light | Light | Medium | M. full | Full |
Flavor | 0-10 | Nil | Bad | Fair | Medium | Good | V. good |
Overall standard | 0-10 | Nil | Bad | Regular | Good | V. good | Excellent |
Shape and make (15%) | Color (15%) | Odor (10%) | |||
|---|---|---|---|---|---|
Quality | Points | Quality | points | Quality | Points |
Very good | 15 | Bluish | 15 | Clean | 10 |
Good | 12 | Grayish | 12 | Fair clean | 8 |
Fair good | 10 | Greenish | 10 | Trace | 6 |
Average | 8 | Coated | 8 | Light | 4 |
Mixed | 6 | Faded | 6 | Moderate | 2 |
Small | 4 | White | 4 | Strong | 0 |
Trait | Genotype | EMS | SE | CV% |
|---|---|---|---|---|
Acidity | 0.68** | 0.21 | 0.51 | 6.19 |
Aromatic Intensity | 0.22* | 0.15 | 0.42 | 9.44 |
Aromatic Quality | 0.38* | 0.21 | 0.49 | 11.09 |
Astringency | 0.16ns | 0.38 | 0.6 | 14.8 |
Bitterness | 0.22ns | 0.49 | 0.7 | 17 |
Body | 0.44** | 0.18 | 0.46 | 5.66 |
Flavor | 0.84** | 0.12 | 0.37 | 4.8 |
Overall Standard | 0.79** | 0.17 | 0.47 | 5.58 |
Total cup quality | 20.71** | 3.95 | 2.21 | 4.31 |
Bean size | 867.10** | 1.06 | 1.17 | 1.37 |
Color | 0.63* | 0.3 | 0.66 | 4.29 |
Odor | 0.05ns | 0.05 | 0.23 | 2.4 |
Shape and make | 2.85** | 0.42 | 0.68 | 5.44 |
Total raw | 4.31** | 0.88 | 1.12 | 2.71 |
Overall Quality | 25.29** | 4.94 | 2.33 | 2.75 |
AI | AQ | AC | BO | FL | OVS | TC | SHM | CO | TR | BS | OV | |
|---|---|---|---|---|---|---|---|---|---|---|---|---|
AI | 1 | 0.79** | 0.62** | 0.58** | 0.67** | 0.59** | 0.74** | 0.07 | -0.2 | 0 | -0.12 | 0.67** |
AQ | 1 | 0.66** | 0.63** | 0.69** | 0.67** | 0.80** | 0.04 | -0.28* | -0.07 | -0.11 | 0.70** | |
AC | 1 | 0.89** | 0.92** | 0.93** | 0.94** | 0.06 | -0.2 | -0.04 | -0.09 | 0.84** | ||
BO | 1 | 0.92** | 0.92** | 0.92** | 0.14 | -0.12 | 0.06 | 0.03 | 0.85** | |||
FL | 1 | 0.94** | 0.96** | 0.1 | -0.16 | 0.01 | -0.05 | 0.87** | ||||
OVS | 1 | 0.95** | 0.06 | -0.15 | -0.01 | -0.07 | 0.86** | |||||
TC | 1 | 0.11 | -0.18 | 0.01 | -0.06 | 0.91** | ||||||
SHM | 1 | 0.35** | 0.92** | 0.78** | 0.48** | |||||||
CO | 1 | 0.66** | 0.25* | 0.11 | ||||||||
TR | 1 | 0.72 | 0.43** | |||||||||
BS | 1 | 0.24* | ||||||||||
OV | 1 |
AI | AQ | AC | BO | FL | OVS | TC | SHM | CO | TR | BS | OV | |
|---|---|---|---|---|---|---|---|---|---|---|---|---|
AI | 1 | |||||||||||
AQ | 0.99** | 1 | ||||||||||
AC | 1.19 | 1.035** | 1 | |||||||||
BO | 1.18 | 1.01** | 1.09** | 1 | ||||||||
FL | 1.22 | 1.04** | 1.02** | 1.10* | 1 | |||||||
OVS | 1.07 | 1.05** | 1.02** | 1.06** | 0.99** | 1 | ||||||
TC | 1.05* | 0.98** | 1.04** | 1.07** | 1.02** | 1.01** | 1 | |||||
SHM | 0.13 | 0.04 | 0.02 | 0.14 | 0.09 | 0.05 | 0.11 | 1 | ||||
CO | -0.43 | -0.52 | -0.22 | -0.2 | -0.18 | -0.18 | -0.21 | 0.44* | 1 | |||
TR | 0.02 | -0.11 | -0.07 | 0.05 | 0.01 | -0.03 | 0.01 | 0.96* | 0.68 | 1 | ||
BS | 0.21 | 0.44 | 0.32 | 0.33 | 0.25 | 0.28 | 0.32 | 0.11 | -0.11 | 0.08 | 1 | |
OV | 0.96** | 0.84** | 0.91** | 0.99** | 0.93** | 0.91** | 0.91** | 0.49 | 0.09 | 0.42 | 0.27 | 1 |
AI | AQ | AC | BO | FL | OVS | TC | rp | |
|---|---|---|---|---|---|---|---|---|
AI | 0.0007 | -0.0005 | 0.0017 | 0.0015 | -0.0018 | -0.0041 | 0.673 | 0.67** |
AQ | 0.0006 | -0.0007 | 0.0018 | 0.0016 | -0.0018 | -0.0047 | 0.7294 | 0.70** |
AC | 0.0005 | -0.0004 | 0.0027 | 0.0023 | -0.0025 | -0.0064 | 0.8595 | 0.84** |
BO | 0.0004 | -0.0004 | 0.0024 | 0.0026 | -0.0024 | -0.0063 | 0.8346 | 0.85** |
FL | 0.0005 | -0.0005 | 0.0025 | 0.0024 | 0.0027 | -0.0065 | 0.8732 | 0.87** |
OVS | 0.0004 | -0.0005 | 0.0025 | 0.0024 | -0.0025 | 0.0069 | 0.8652 | 0.86** |
TC | 0.0005 | -0.0005 | 0.0025 | 0.0024 | -0.0026 | -0.0066 | 0.9102 | 0.91** |
AI | AQ | AC | BO | FL | OVS | TC | Rg | |
|---|---|---|---|---|---|---|---|---|
AI | -0.001 | 0.001 | 0.024 | -0.007 | -0.04 | 0.007 | 0.96 | 0.96** |
AQ | -0.001 | 0.001 | 0.021 | -0.006 | -0.034 | 0.007 | 0.90 | 0.84** |
AC | -0.001 | 0.001 | 0.02 | -0.006 | -0.033 | 0.007 | 0.96 | 0.91** |
BO | -0.001 | 0.001 | 0.022 | -0.006 | -0.036 | 0.007 | 0.98 | 0.99** |
FL | -0.001 | 0.001 | 0.02 | -0.006 | 0.033 | 0.007 | 0.94 | 0.93** |
OVS | -0.001 | 0.001 | 0.02 | -0.006 | -0.032 | 0.007 | 0.93 | 0.91** |
TC | -0.001 | 0.001 | 0.021 | -0.006 | -0.033 | 0.007 | 0.92 | 0.91** |
| [1] | Abeyot Tessema, Sentayehu Alamerew, Taye Kufa and Weyessa Garedew. 2011. Genetic diversity analysis for quality attributes of some promising Coffea arabica germplasm collections in southwestern Ethiopia. Journal of Biological Sciences, 11: 236-244. |
| [2] | Ariyo, O. J., M. E., Akeriova and C.A. Fatokun, 1987. Plant character correlation and path analysis of pod yield in Okra (Abelmoschus esculentus). Euphytica 36: 677-686. |
| [3] | Agwanda, C. O. 1999. Flavor: an ideal selection criterion for the genetic improvement of liquor quality in arabica coffee. In: the proceedings of 18th International Scientific Colloquium on Coffee. Helsinki, Finland. pp. 383-389. |
| [4] | Ashanafi, A. and Lemi, B. 2016. Genetic Variability, Heritability and Genetic Advance for yield and yield components of Limmu coffee (Coffea arabica L.). Middle-East Journal of Scientific Research, 24(6): 1913-1919. |
| [5] | Charrier, A. and Berthaud, J. 1990. Use and value of genetic resources of Coffea for breeding and their long-term conservation. Mitt Inst. Allg. Bot. Hamburg 23a, 65-72. |
| [6] | Getachew, W., Sentayehu, A. and Taye, K. 2014. Genotypic correlation and path coefficient analysis of organoleptic quality attributes of some Ethiopian specialty coffee (Coffea arabica L.) accessions. Sky Journal of Agricultural Research Vol. 3(3), pp. 046-052. |
| [7] | Getachew, W., Sentayehu, A. and Taye, K. 2015. Genetic Diversity Analysis of Some Ethiopian Specialty Coffee (Coffea arabica L.) Accessions for Cup Quality Attributing Traits. ISSN 2224-3208(Paper) ISSN 2225-093X (Online) Vol. 5, No. 5, 2015. |
| [8] | Getu Bekele. 2009. Genotype x environment interaction of Arabica coffee (Coffea arabica L.) for bean biochemical composition and organoleptic quality characteristics. An M.Sc thesis submitted to school of graduate studies of Alemaya University. 115p. |
| [9] | International Coffee Organization (ICO). 2016. World coffee consumption. Retrieved April 8, 2016, from |
| [10] | Johnson, H. W., Robinson, H. F. and Conmstock, R. E. 1955. Estimates of genetic and environmental variability in soybeans. Agronomy Journal, 47: 314-318. |
| [11] | Meyer, E. 1965. Notes on the wild Coffea arabica from Southwestern Ethiopia, Some historical considerations. Economic Botany 19: 136-151. |
| [12] | Monaco, L. C. 1968. Considerations on the genetic variability of Coffea arabica populations in Ethiopia. In FAO Coffee mission to Ethiopia 1964-65. Ed. FAO. pp 49-69. FAO, Rome, Italy. |
| [13] | Olika Kitila, Sentayehu Alamerew, Taye Kufa and Weyessa Garedew. 2011. Organoleptic Characterization of Some Limu Coffee (Coffea arabica L.) Germplasm at Agaro, Southwestern Ethiopia. International Journal of Agricultural Research, 6: 537-549. |
| [14] | Robertson, A. 1959. Biometrics. The sampling variance of genetic correlation coefficient. International Biometric Society, Publishers. 469-485. |
| [15] | Silvarolla MB, Mazzafera P, Fazuoli LC (2004). A naturally decaffeinated arabica coffee. Nature 429: 826. |
| [16] | Tadesse Woldemariam Gole. 2015. Coffee: Ethiopia’s Gift to the World: The traditional production systems as living examples of crop domestication, and sustainable production and an assessment of different certification schemes. Environment and Coffee Forest Forum. Addis Abeba, Ethiopia. |
| [17] | Tesfaye, K. 2006. Genetic Diversity of Wild Coffea arabica Populations in Ethiopia as a Contribution for Conservation and Use Planning. Ecology and Development Series, No. 44, Centre for Development Research, University of Bonn. |
| [18] | Tewolde, B. G. 1990. The importance of Ethiopian forests in the conservation of Arabica coffee genepools. Mitt Inst. Allg. Bot. Hamburg Band 23a, 65-72. |
| [19] | Wintgens, J. N. 2004. Coffee: Growing, Processing, Sustainable Production. A guide. |
| [20] | Yigzaw, D. 2005. Assessment of genetic diversity of Ethiopian arabica coffee genotypes using morphological, biochemical and molecular markers. PhD Dissertation, University of the free state, Bloemfontein, South Africa. |
APA Style
Girma, S., Mohammed, W., Ayano, A. (2024). Association and Path Coefficient Analysis of Some Arsi Coffee Accesions (Coffea arabica L.) for Quality Traits at Mechara, Ethiopia. Journal of Food and Nutrition Sciences, 12(4), 196-204. https://doi.org/10.11648/j.jfns.20241204.14
ACS Style
Girma, S.; Mohammed, W.; Ayano, A. Association and Path Coefficient Analysis of Some Arsi Coffee Accesions (Coffea arabica L.) for Quality Traits at Mechara, Ethiopia. J. Food Nutr. Sci. 2024, 12(4), 196-204. doi: 10.11648/j.jfns.20241204.14
@article{10.11648/j.jfns.20241204.14,
  author = {Sintayehu Girma and Wassu Mohammed and Ashenafi Ayano},
  title = {Association and Path Coefficient Analysis of Some Arsi Coffee Accesions (Coffea arabica L.) for Quality Traits at Mechara, Ethiopia
},
  journal = {Journal of Food and Nutrition Sciences},
  volume = {12},
  number = {4},
  pages = {196-204},
  doi = {10.11648/j.jfns.20241204.14},
  url = {https://doi.org/10.11648/j.jfns.20241204.14},
  eprint = {https://article.sciencepublishinggroup.com/pdf/10.11648.j.jfns.20241204.14},
  abstract = {Coffee is still one of Ethiopian’s primary agricultural export crops accounting for more than 25% of export earnings. Arsi coffee is known to produce Harar C coffee quality grade and known for its unique flavor and aroma. Therefore, this study was conducted to determine association among coffee bean quality traits and, the direct and indirect effects of bean quality traits on overall quality of coffee. A total of 56 Arsi coffee accessions and four Hararghe coffee varieties were evaluated for bean physical and organoleptic coffee quality traits using Completely Randomized Design with three replications. The analysis of variance results showed significant variation among Arsi coffee accession for all traits except astringency, bitterness, and odor. The overall coffee quality had positive and significant phenotypic and genotype correlations with aromatic intensity, aromatic quality, acidity, body, flavor, overall standard quality and overall cup quality. These traits also had positive direct effects on overall coffee quality however; aromatic intensity and body exerted negligible negative direct effects at genotypic level whereas aromatic quality had negative direct effect at phenotypic level. All these traits through overall standard quality, and aromatic intensity, aromatic quality and acidity via each other and through body and flavor exerted positive direct effects on overall coffee quality at genotypic level. Thus majority of quality traits could be used for indirect selection of genotypes for overall coffee quality.
},
 year = {2024}
}
TY  - JOUR
T1  - Association and Path Coefficient Analysis of Some Arsi Coffee Accesions (Coffea arabica L.) for Quality Traits at Mechara, Ethiopia

AU  - Sintayehu Girma
AU  - Wassu Mohammed
AU  - Ashenafi Ayano
Y1  - 2024/08/27
PY  - 2024
N1  - https://doi.org/10.11648/j.jfns.20241204.14
DO  - 10.11648/j.jfns.20241204.14
T2  - Journal of Food and Nutrition Sciences
JF  - Journal of Food and Nutrition Sciences
JO  - Journal of Food and Nutrition Sciences
SP  - 196
EP  - 204
PB  - Science Publishing Group
SN  - 2330-7293
UR  - https://doi.org/10.11648/j.jfns.20241204.14
AB  - Coffee is still one of Ethiopian’s primary agricultural export crops accounting for more than 25% of export earnings. Arsi coffee is known to produce Harar C coffee quality grade and known for its unique flavor and aroma. Therefore, this study was conducted to determine association among coffee bean quality traits and, the direct and indirect effects of bean quality traits on overall quality of coffee. A total of 56 Arsi coffee accessions and four Hararghe coffee varieties were evaluated for bean physical and organoleptic coffee quality traits using Completely Randomized Design with three replications. The analysis of variance results showed significant variation among Arsi coffee accession for all traits except astringency, bitterness, and odor. The overall coffee quality had positive and significant phenotypic and genotype correlations with aromatic intensity, aromatic quality, acidity, body, flavor, overall standard quality and overall cup quality. These traits also had positive direct effects on overall coffee quality however; aromatic intensity and body exerted negligible negative direct effects at genotypic level whereas aromatic quality had negative direct effect at phenotypic level. All these traits through overall standard quality, and aromatic intensity, aromatic quality and acidity via each other and through body and flavor exerted positive direct effects on overall coffee quality at genotypic level. Thus majority of quality traits could be used for indirect selection of genotypes for overall coffee quality.

VL  - 12
IS  - 4
ER  -
Mechara Agricultural Research Center, Mechara, Ethiopia
Information

