Research Article | | Peer-Reviewed

Analysis of Aging Effect and Cell Balancing Problem of Lithium-Ion Battery

Received: 10 February 2025     Accepted: 22 February 2025     Published: 18 March 2025
Views:       Downloads:
Abstract

This study presents an in-depth analysis of ageing and temperature effects in lithium-ion batteries, as well as an investigation into cell balancing issues. The ageing effect, encompassing capacity fade and impedance rise over time, is scrutinized through experimental and computational approaches. Through controlled cycling tests under various temperature conditions, the impact of temperature on battery ageing is evaluated, revealing accelerated degradation at higher temperatures. Additionally, a comprehensive battery model integrating ageing and temperature effects is developed to simulate the long-term behavior of lithium-ion cells. Furthermore, the study addresses cell balancing challenges, essential for maintaining uniform cell voltages within battery packs to enhance performance and longevity. Various cell balancing techniques, including passive and active methods, are reviewed and compared in terms of effectiveness and implementation complexity. Additionally, novel algorithms for dynamic cell balancing are proposed to mitigate voltage deviations among cells during operation. Overall, this thesis contributes to a better understanding of aging and temperature effect in lithium and battery, here we can see if we add aging and temperature effect battery charging time and voltage increase our time, on the other hand discharging time and voltage decrease.

Published in Journal of Electrical and Electronic Engineering (Volume 13, Issue 2)
DOI 10.11648/j.jeee.20251302.11
Page(s) 92-107
Creative Commons

This is an Open Access article, distributed under the terms of the Creative Commons Attribution 4.0 International License (http://creativecommons.org/licenses/by/4.0/), which permits unrestricted use, distribution and reproduction in any medium or format, provided the original work is properly cited.

Copyright

Copyright © The Author(s), 2025. Published by Science Publishing Group

Keywords

Lithium-ion Battery, SOH, Energy Management System, SOC, Data Driven Techniques

1. Introduction
Batteries are the backbone of modern life, fueling everything from handheld gadgets to industrial machinery. Their classification is vital for understanding their wide-ranging applications and functionalities. Primary batteries are disposable, while secondary batteries are rechargeable, offering versatility for repeated use. Batteries are categorized as dry or wet cells based on electrolyte states, and as portable or non-portable depending on mobility, each classification serving distinct purposes across various sectors. Chemical properties play a pivotal role in battery classification, influencing energy density, voltage, and lifespan. This knowledge is crucial for selecting the most suitable battery for specific applications. Moreover, size and scale classification ensure batteries meet spatial and power requirements, catering to diverse devices and systems . Due to their high energy density, extended cycle life, and eco-friendliness, lithium-ion batteries find extensive application in electric vehicles, smart grids, and portable devices. Nevertheless, lithium-ion batteries encounter certain obstacles, including state of charge (SOC) estimation, temperature and aging impacts, and cell balancing . SOC estimation refers to gauging the available capacity and runtime of the battery. Temperature and aging impacts denote the factors altering the battery's characteristics and performance as time passes. Cell balancing involves aligning the SOC or voltage of cells linked in series or parallel to enhance battery efficiency and longevity. These challenges are interrelated and need to be addressed in a comprehensive way. In this Work, we compare two battery models for SOC estimation one that considers the effects of temperature and aging, and another that ignores them . We also incorporate cell balancing into the models to enhance the SOC estimation accuracy and robustness. We use a support vector regression (SVR) method to estimate the SOC based on the battery voltage and current. We evaluate the performance of the models under different driving conditions and measure the error and stability of the SOC estimation. We also analyze the impact of cell balancing on the battery performance and lifetime. Our results show that the model that incorporates temperature and aging and cell balancing has a lower estimation error and a higher stability than the model that neglects them. Therefore, we conclude that temperature and aging and cell balancing are significant factors that should be taken into account for accurate and reliable SOC estimation of lithium-ion batteries. The state of charge (SOC) of a lithium-ion battery is an important parameter that indicates the available capacity and runtime of the battery. However, the SOC estimation is affected by various factors, such as temperature and aging, that change the battery characteristics over time. In this study, we compare two battery models for SOC estimation one that considers the effects of temperature and aging, and another that ignores them. We evaluate the performance of the models under different driving conditions and measure the accuracy and robustness of the SOC estimation. Our results show that the model that incorporates temperature and aging has a lower estimation error and a higher stability than the model that neglects them. Therefore, we conclude that temperature and aging are significant factors that should be taken into account for accurate and reliable SOC estimation of lithium-ion batteries. The increasing reliance on rechargeable batteries, particularly in electric vehicles and renewable energy storage systems, necessitates accurate and reliable battery management systems (BMS). A BMS’s primary function is to ensure the safety and longevity of the battery, which is achieved through continuous monitoring and control of the battery’s SOC and SOH. However, existing methods for estimating SOC and SOH have limitations and do not always provide accurate results . The SOC and SOH are key metrics that describe the performance of the battery and help predict its future behavior. The SOC shows the amount of electric charge left in the battery, while the SOH provides an indication of the overall health and expected lifespan of the battery . Accurate monitoring of SOC and SOH is critical for effectively operating the BMS in a lithium battery. However, the current methods for estimating SOC and SOH have several shortcomings. For instance, they may not account for the effects of aging mechanisms on the battery, which can result in an increase in internal resistance and a decrease in capacity . Furthermore, these methods may not be able to accurately predict the SOC and SOH under varying operating conditions, such as different temperatures. Therefore, there is a need for a more accurate and reliable method for predicting SOC, SOH, and SOL in rechargeable batteries. This research aims to address this problem by developing a new approach for SOC, SOH, and SOL prediction in BMS, with a focus on rechargeable batteries . The proposed approach will aim to overcome the limitations of existing methods and provide more accurate and reliable predictions of SOC, SOH, and SOL. This will contribute to the development of more efficient and safer battery management systems, ultimately leading to longer battery life and improved performance of devices powered by rechargeable batteries. This study delves into the critical role of Battery Management Systems (BMS) in estimating the State of Charge (SOC), State of Health (SOH), and State of Life (SOL) of batteries, which are essential for optimizing performance and ensuring long-term functionality. The primary objective of a BMS is to enhance battery security and longevity through continuous monitoring and control of SOC and SOH. Accurate SOC estimation determines the remaining charge, SOH assesses the battery’s overall health, and SOL predicts its remaining useful life—an essential aspect for effective energy management and preventing over-discharge . The scope covers the selection of appropriate battery technology, as battery chemistry affects performance and thermal tolerance based on application (e.g., lithium-ion, lead-acid). Modeling and simulation efforts involve creating mathematical representations of battery behavior in tools like MATLAB Simulink to study responses under different conditions. Estimation algorithms, such as Kalman filters and neural networks, use real-time data and historical information to predict SOC, SOH, and SOL accurately . Validation and testing of the BMS are conducted with experimental data across various scenarios, ensuring accuracy and robustness. Hardware integration focuses on interfacing BMS with real battery packs for practical applications, including electric vehicles and renewable energy systems, where safety and reliability are paramount. Finally, user interfaces and reporting features provide accessible monitoring and reporting tools for users, ensuring informed decisions on battery usage and health management . Accurate SOC and SOH estimations are fundamental for sustainable energy management and extended battery life.
2. Literature Review
Lithium-ion batteries (LIBs) are critical for modern energy storage applications, including electric vehicles (EVs), renewable energy systems, and portable electronics. However, challenges such as aging effects and cell imbalance significantly impact their performance, safety, and lifespan. Aging mechanisms in LIBs, such as capacity fade and internal resistance increase, are influenced by factors like temperature, charge-discharge rates, and depth of discharge. Research by Xu et al. (2020) highlights that temperature fluctuations accelerate the formation of solid electrolyte interphase (SEI) layers, contributing to capacity loss and performance degradation. Additionally, Li et al. (2021) emphasizes the importance of understanding calendar aging and cycle aging to develop predictive models for battery lifespan estimation . Cell imbalance arises from manufacturing inconsistencies, operational stresses, and aging variations among cells in a battery pack. Imbalanced cells lead to uneven charging/discharging, reduced pack efficiency, and safety risks such as thermal runaway. Wu et al. (2019) demonstrated that active cell balancing methods, utilizing energy transfer between cells, are more effective than passive techniques in addressing imbalance while minimizing energy loss. Furthermore, studies by Kim et al. (2022) indicate that integrating advanced algorithms for dynamic cell balancing can optimize pack performance and prolong its operational life . Modern BMS technologies focus on mitigating aging effects and ensuring effective cell balancing. Zhang et al. (2023) introduced a hybrid approach combining SOC estimation algorithms with adaptive control strategies, incorporating aging and temperature data to improve precision. Similarly, Chen et al. (2020) proposed an integrated BMS framework leveraging machine learning for real-time monitoring and balancing, achieving significant enhancements in system safety and efficiency . Aging in LIBs is categorized into calendar aging (time-dependent) and cycle aging (charge-discharge-dependent). Research by Ecker et al. (2014) has shown that both aging types contribute to capacity fade and increase internal resistance, driven by mechanisms like SEI layer growth, lithium plating, and electrode material degradation. A detailed study by Schmalstieg et al. (2018) revealed that high temperatures and deep discharge cycles exacerbate aging, leading to non-linear degradation patterns . Studies by Peled et al. (2017) identified the SEI layer as a key factor in capacity fade, suggesting that optimizing electrolyte composition can mitigate its impact. A study by Abraham et al. (2020) showed that lithium plating is more pronounced at low temperatures and high charge rates, emphasizing the need for thermal management. In a series-connected battery pack, cell imbalance occurs due to variations in initial capacity, aging rates, and operating conditions. This imbalance leads to overcharging or deep discharging of individual cells, reducing overall efficiency and safety. Passive balancing methods use resistors to dissipate excess energy from higher-capacity cells. While simple and cost-effective, these methods result in energy loss and are unsuitable for high-capacity systems (Huang et al., 2019). Active balancing techniques, such as switched-capacitor and inductor-based methods, redistribute energy between cells, improving efficiency and extending battery life. Research by Keil et al. (2021) demonstrated that active balancing reduces thermal stress and prevents overvoltage conditions. A recent study by Bian et al. (2023) proposed dynamic algorithms for real-time balancing, integrating SOC and SOH (State of Health) data to optimize energy transfer. BMS is crucial for addressing aging and balancing issues, integrating real-time monitoring, diagnostics, and control strategies. Modern BMS solutions employ machine learning (ML) and advanced algorithms to enhance performance . SOC and SOH Estimation: He et al. (2019) developed an adaptive Kalman filter algorithm that incorporates aging and temperature effects for accurate SOC estimation. Liu et al. (2022) introduced ML-driven predictive maintenance frameworks that analyze historical data to forecast degradation and recommend timely interventions. A combined BMS and thermal management system by Zhao et al. (2023) was shown to mitigate aging effects and maintain cell balance in high-temperature environments. To address aging and balancing issues comprehensively, future research should focus on multi-scale electrochemical modeling, real-time diagnostics, and advanced materials. Incorporating data-driven predictive algorithms and thermal management solutions will further enhance LIB performance and reliability.
3. Methodology
Lithium-ion batteries are the cornerstone of modern portable electronics and electric vehicles due to their high energy density and long lifespan. Optimizing the charging and discharging methods of these batteries is crucial for enhancing their performance and extending their service life. Various charging techniques such as constant current, constant voltage, and pulse charging, along with discharging methods like intermittent and continuous discharging, have been developed to improve efficiency and safety . Monitoring the State of Health (SoH) and State of Charge (SoC) of lithium-ion batteries is essential for managing their health and predicting their remaining capacity accurately. Here explores different charging and discharging methods of lithium-ion batteries, as well as methodologies for calculating SoH and SoC to facilitate efficient and reliable energy storage solutions.
Figure 1. Battery Management Systems Flow chart .
3.1. Charge and Discharge Characteristics
The circuit parameters can be adjusted to model a particular battery type and its discharge traits. A standard discharge curve is comprised of three segments.
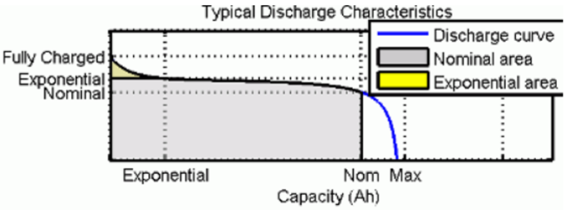
Figure 2. Specific battery type and its discharge characteristics curve.
The initial segment illustrates the exponential decrease in voltage during battery charging, with the drop's magnitude varying based on the battery type. The second segment reflects the charge available from the battery until its voltage falls below the nominal level. The third segment signifies the complete discharge of the battery, characterized by a rapid voltage drop. In cases where the battery current is negative, indicating recharging, it follows a charging pattern.
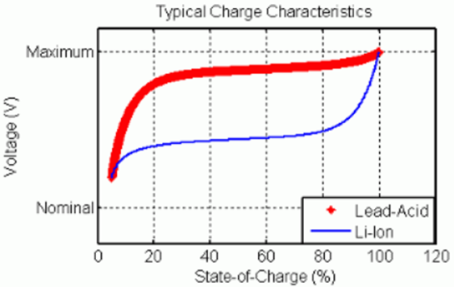
Figure 3. Charge characteristic of lead- Acid and Li-Ion.
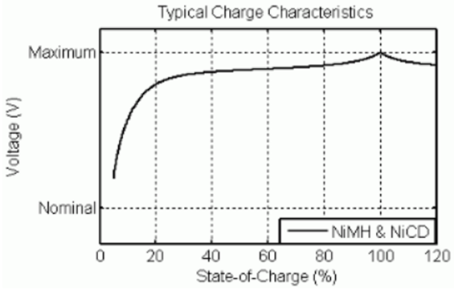
Figure 4. Charge characteristic of NiMH & NiCD.
The model parameters are obtained from the discharge traits, assuming that the charging and discharging characteristics are identical. The Exp(s) transfer function portrays the hysteresis phenomenon observed in lead-acid, nickel-cadmium (NiCD), and nickel-metal hydride (NiMH) batteries during charge and discharge cycles . During charging, the voltage exhibits an exponential rise, regardless of the battery's charge status. Conversely, during discharge, the voltage experiences an immediate exponential decline.
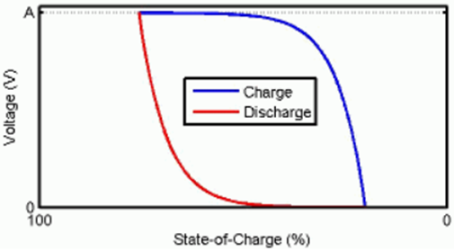
Figure 5. Exponential zone for lead- Acid, NiMH & NiCD.
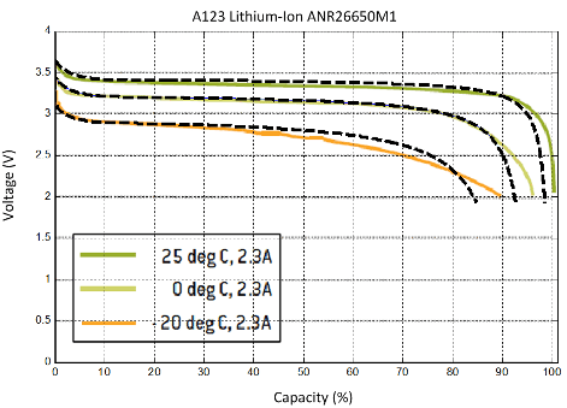
Figure 6. Different ambient temperatures discharging curve.
The state of charge (SOC) of a battery indicates its level of charge, typically represented as a percentage of its full capacity. The depth of discharge (DOD) is the numerical complement of the SOC, calculated as DOD = 100% - SOC.
For example, if the SOC is:
100% — The battery is completely charged, with a DOD of 0%.
75% — The battery is three-quarters charged, with a DOD of 25%.
50% — The battery is half charged, with a DOD of 50%.
0% — The battery is completely discharged, with a DOD of 100%.
The discharge curves from the simulation at various ambient temperatures are displayed in the figure by the dotted lines.
For the lead-acid battery type, the model uses these equations.
Discharge Model (i* > 0)
ſiit,i*,i,Exp=E0 -Ki-Kit+1it+Laplace+0.1(1-Ki+LaplaceExps)QQ-it(1)
Charge Model (i* < 0)
ſiit,i,i*,Exp=E0 -0.1(1-Ki+LaplaceExps)Qit(2)
For the lithium-ion battery type, the model uses these equations.
Discharge Model (i* > 0)
ſiit,i*,i=E0 -K.Qit+0.1Q.i*-K.Qit+0.1Qit+A.Exp-B.it(3)
Charge Model (i* < 0)
ſiit,i*,i=E0 -K.QQ-it.i*-K.QQ-itit+A.Exp-B.it(4)
3.2. Proposed Methodology
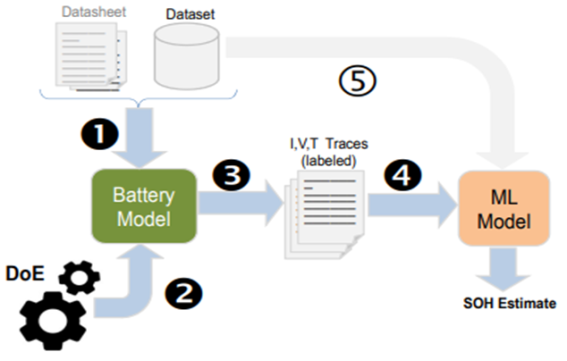
Figure 7. Conceptual flow of the proposed methodology.
We propose using the datasets mentioned earlier, or a part of them, to create a detailed Simula table battery model. This model will include State of Health (SOH) and cover all aspects of battery behavior. Then, we'll use this Simula table model to create more data points, which will expand the training set for a stronger data-driven SOH model. Figure 7 outlines the envisioned workflow for implementing this approach .
The process starts by using a set of battery data, usually collected under different conditions during operation. This data can be freshly collected or taken from public datasets. Although battery datasheets offer information, they often lead to less accurate model construction . After that, we use the battery datasets to find the parameters of a battery model, known as the simulation model. This model monitors, at least, the desired target value, like State of Health (SOH). The process of finding model parameters follows a particular method based on the type of model. Section III-B outlines the simulation model requirements, and Section III-C surveys prominent models in the literature that meet these criteria. Once we have the simulation model set up, we move on to a Design-of-Experiment (DoE) stage where we create a detailed set of synthetic traces (step 2). These traces cover as many points as possible in the model's input space. For each design point, we run a simulation of the battery model, which gives us an output trace (step 3). Then, we use each trace from the simulation model to train the State of Health (SOH) Machine Learning (ML) model, which we'll call the data-driven model from now on (step 4). Section III-D discusses different options for data-driven models and how they affect Battery Management Systems (BMS) . If the formats of traces 1 and 3 match, we can use a combination of real (measured) and simulated (model-driven) traces to train or test the model (step 5). Although not explicitly shown in the flow, this step highlights the flexibility of the approach.
3.3. Battery Aging
Battery aging includes both calendar aging (L_cal) and cycle aging. Calendar aging refers to the natural degradation of the battery during inactive periods, affected by factors like temperature, State of Charge (SOC), and elapsed time. On the other hand, cycle aging indicates the capacity loss that happens during each charge/discharge cycle (L_cyc). This loss depends on average values of current (I), SOC, cell temperature (T), and Depth of Discharge (DoD), which is the difference between the final and initial SOC. The total capacity loss (L_C) is the combination of a general term for calendar aging and the accumulated degradation from individual cycles .
LCt, SOC, DoD, I, T=
 Lcal(t, SOC, T)+i=1NLcyc(Ii,SOCi,DoDi,Ti)(5)
Here, N stands for the count of charge/discharge cycles, SOC and T are averaged over a duration of t in L_cal, and they indicate each specific cycle i in L_cyc. Advanced models for L_cal and L_cyc either use the resemblances in the fatigue process of materials under cyclic loading or include the electro-chemical characteristics of the charge/discharge process. This work doesn't intend to delve into the specifics of the models themselves; for a thorough understanding of these models .
4. Results and Discussion
The analysis highlights that incorporating aging and temperature effects into SOC estimation significantly improves accuracy and reliability compared to simplified models. The advanced model's adaptive control strategies enhance battery performance, lifespan, and efficiency. This underscores the necessity of integrating these factors for effective battery management in practical applications. Cell balancing is a process used to ensure that individual cells within a battery pack maintain uniform voltage levels. In a battery pack, individual cells may have slight variations in capacity, resistance, or other characteristics due to manufacturing differences, aging, or environmental factors. These variations can cause some cells to become overcharged or over discharged compared to others, leading to reduced overall battery performance, efficiency, and lifespan. Cell balancing aims to mitigate these differences by redistributing energy among the cells to ensure they all reach and maintain similar voltage levels. This process can involve various techniques, such as:
Passive balancing: This method involves dissipating excess energy from cells with higher voltage through resistors or other passive components. It's a simple and cost-effective approach but may not be suitable for high-power applications due to energy loss as heat.
Active balancing: Active balancing actively transfers charge between cells using switches, capacitors, or other electronic components. This approach is more efficient than passive balancing and can handle higher power levels, but it's generally more complex and expensive.
Cell balancing is essential for maximizing the performance, efficiency, and lifespan of battery packs, especially in applications where multiple cells are connected in series or parallel configurations, such as electric vehicles, renewable energy storage systems, and portable electronics. Proper cell balancing helps ensure safety, reliability, and optimal performance of battery-powered devices and systems.
Table 1. Quick charging effect at difference temperature and aging.

Temp (°C)

Aging (%)

No Aging, No Temp SOC%

SOC% at Different Combination

Difference

Percentage of difference

10

0

42.83

40.89

1.94

4.74

25

38.41

4.42

11.50

50

35.37

7.216

21.09

75

33.74

9.09

26.94

100

29.44

13.39

45.48

20

0

41.19

1.64

3.98

25

38.72

4.11

10.61

50

36.48

6.35

17.40

75

33.57

9.26

27.58

30

0

41.15

1.68

4.08

25

38.49

4.34

11.35

50

35.7

7.13

19.97

75

32.42

9,41

28.15

100

28.89

13.94

48.25

40

0

41.15

1.68

4.08

25

38.44

4.39

11.42

50

35.6

7.23

20.30

75

32.95

9.88

29.98

100

28.84

13.99

48.50

Table 2. Charging time and Discharging time voltage at difference temperature and aging.

Temperature (°C)

Aging (%)

Charging time (min)

Discharging time (min)

Charging Battery voltage (v)

Discharging Battery voltage (v)

0

0

51.1

32.062

21.22

0.157

10

0

47.56

39.52

13.14

2.029

25

51.19

35.69

13.66

2.03

50

55.27

31.62

14.27

2.04

75

59.24

27.45

14.44

2.05

100

63.75

23.03

15.35

2.08

20

0

47.07

39.73

13.20

2.03

25

51

35.28

13.83

2.05

50

55.59

31.26

14.7

2.06

75

59.08

27.12

14.20

2.01

100

63.07

22.39

14.92

2.07

30

0

47.43

39.59

13.81

2.02

25

51.32

35.47

13.90

2.03

50

55.26

31.23

14.27

2.04

75

59.024

27.22

14.46

2.08

100

63.21

22.63

14.60

2.07

40

0

47.55

39.78

13.20

2.01

25

51.195

35.86

14.10

2.02

50

55.19

31.43

14.11

2.03

75

59.03

26.89

14.88

2.06

100

63.002

22.65

15.13

2.07

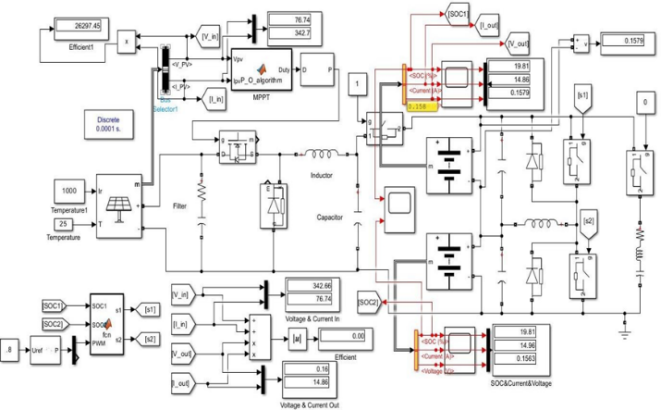
Figure 8. Battery charging simulation.
Table 3. Charging time and voltage at different temperature and aging also Discharging time and voltage at different temperature and aging.

Temperature (°C)

Aging (%)

Charging time (min)

Discharging time (min)

Charging time Battery Voltage (v)

Battery Voltage (v)

Battery SOH (%)

0

0

101.85

238.25

8.166

7.773

-

10

0

102.05

220.56

8.814

8.229

100

25

102.25

217

8.824

8.228

75

50

102.33

214.33

8.833

8.229

50

75

102.53

210.58

8.841

8.23

25

100

102.71

207.83

8.856

8.23

0

20

0

102.08

220.58

8.815

8.229

100

25

102.23

217.41

8.823

8.229

75

50

102.36

214.16

8.832

8.23

50

75

102.55

211

8.841

8.23

25

100

102.73

208

8.856

8.228

0

30

0

102.05

220.5

8.814

8.229

100

25

102.21

217.25

8.823

8.23

75

50

102.36

238.25

8.832

8.231

50

75

102.56

220.56

8.841

8.231

25

100

102.73

217

8.850

8.229

0

40

0

102.06

214.33

8.814

8.23

100

25

102.20

210.58

8.823

8.23

75

50

102.38

207.83

8.832

8.23

50

75

102.51

220.58

8.841

8.232

25

100

102.76

217.41

8.850

8.229

0

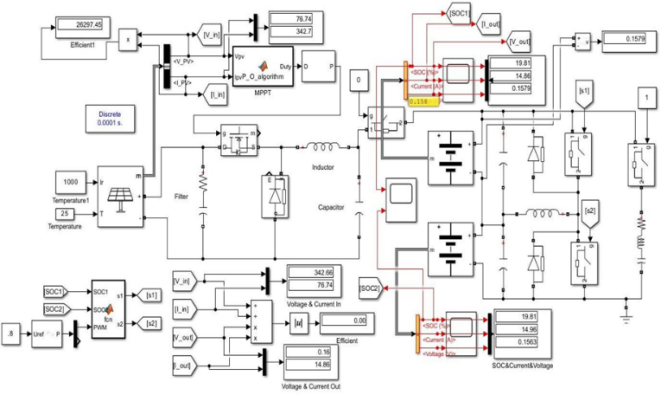
Figure 9. Battery discharging simulation.
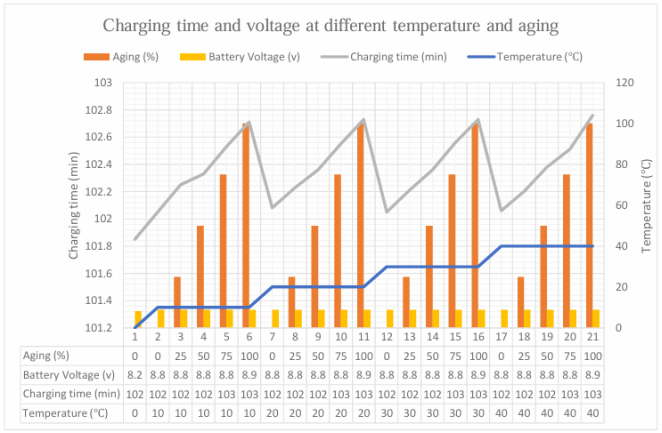
Figure 10. Charging time and voltage at different temperature and aging.
This graph shows us how battery characteristics change with aging and temperature, crucial for optimizing battery life and performance. Charging time and voltage at different temperature and aging provides insights into battery behavior. Here are the key takeaways.
Aging Percentage: Ranges from 0% to 100%.
Battery Voltage: Varies between 8.17 V and 8.85 V.
Charging Time: Fluctuates between 101 and 103 minutes.
Temperature: Ranges from 0°C to 40°C.
From the graph we can see when temperature and aging is not considered battery takes less time to charge and fully charged voltage also less just 8.1. when we considered battery temperature and aging, we see battery takes more time to charge as the battery gets older charging time takes more time at 100% SOC battery takes most time to charge here temperature doesn’t affect the battery charging time much because lithium-ion battery can operate between 10–40-degree temperature without any effect.
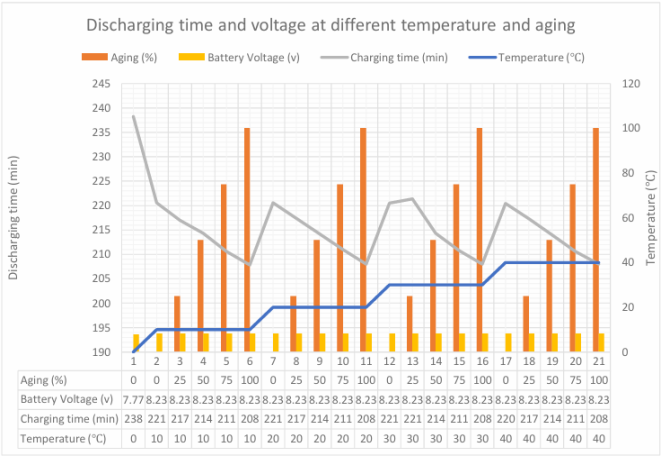
Figure 11. Discharging time and voltage at different temperature and aging.
The chart shows the discharging time and voltage of a battery at different temperatures and aging. Here are the key takeaways:
Aging and Voltage Stability:
The orange vertical bars represent aging in percentage, increasing progressively.
The battery voltage remains relatively constant at 3.283 volts (depicted by a horizontal line).
As aging increases, there’s a slight decrease in voltage stability.
Charging Time:
The grey line indicates charging time, fluctuating between approximately 210 to 230 minutes as aging progresses.
Longer charging times may be necessary as the battery ages.
Temperature Effects:
The blue line represents temperature, which generally increases with aging.
At 0% aging, the temperature is 0°C, but it rises as aging reaches 100%.
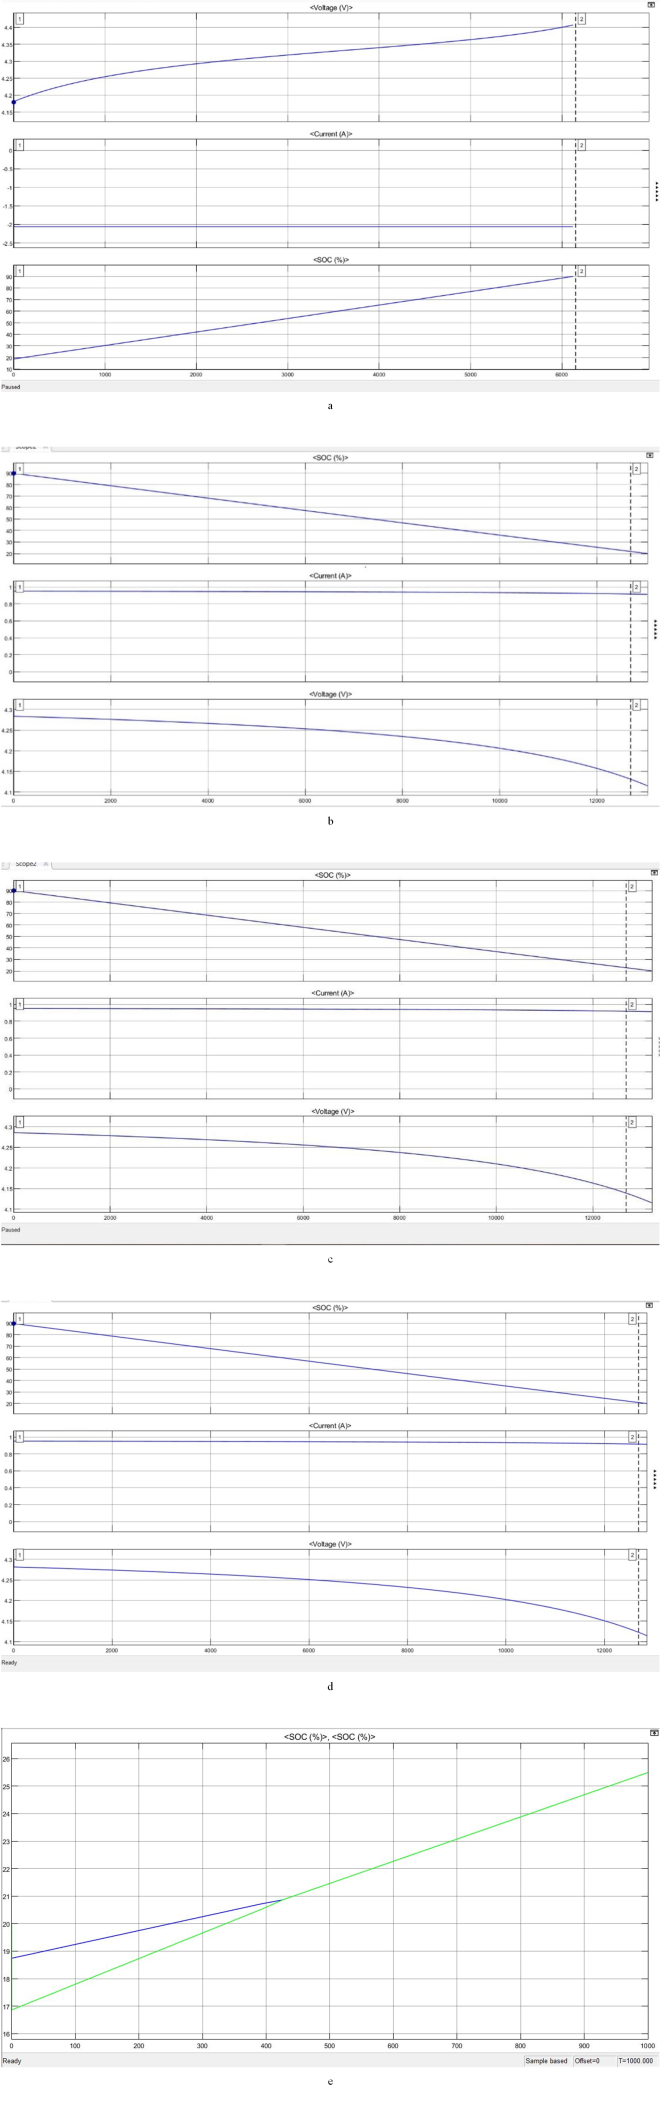
Figure 12. (a) Charging output graph of 30°C temperature 100% aging battery. (b) Discharging output graph of 0°C temperature 0% aging battery. (c) Discharging output graph of 30°C temperature 0% aging battery. (d) Discharging output graph of 30°C temperature 100% aging battery. (e) Active cell balancing charging output graph. (f) Active cell balancing discharging output graph.
Here we can see three types of graphs first of all voltage vs time, second one is current vs time and last one is state of charge vs time. In voltage vs time graph, we see that the voltage starts just under 3.95 V then increased gradually approaches around 4.1 V. In second graph negative sign indicate current is flowing into battery which means battery is charging and the charging current is levelled off. The state of charge vs time graph shows Figure 12 (a) that SOC increased sharply from 20% to 90% which indicates battery is charging. In voltage vs time graph, we see that the voltage starts just over 4.15 V then increased gradually approaches around 4.4 V. In second graph negative sign indicate current is flowing into battery which means battery is charging and the charging current is levelled off. The state of charge vs time graph shows that SOC increased sharply from nearly 15% to 90% which indicates battery is charging in Figure 12 (b). In voltage vs time graph, we see that the voltage starts about 4.16 V then increased gradually approaches well under 4.45 V. In second graph negative sign indicate current is flowing into battery which means battery is charging and the charging current is levelled off. The state of charge vs time graph shows that SOC increased gradually from nearly 17% to 90% which indicates battery is charging. In voltage vs time graph, we see that the voltage starts about 4.17 V then increased gradually approaches just over 4.4 V. In second graph negative sign indicate current is flowing into battery which means battery is charging and the charging current is levelled off. The state of charge vs time graph shows that SOC increased gradually from nearly 20% to 90% which indicates battery is charging. In voltage vs time graph, we see that the voltage starts just under 4.2 V then increased gradually approaches well under 4.45 V. In second graph negative sign indicate current is flowing into battery which means battery is charging and the charging current is levelled off. The state of charge vs time graph shows that SOC increased gradually from nearly 20% to 90% which indicates battery is charging in Figure 12 (b). The state of charge vs time graph shows that SOC decreased gradually from nearly 90% to 20% which indicates battery is discharging. In second graph positive sign indicates consistent load applied to the battery which means battery is discharging and the discharging current is levelled off. In voltage vs time graph, we see that the voltage started around 4 V then decreased gradually approaches just over 3.88 V. The state of charge vs time graph shows that SOC decreased gradually from nearly 90% to 20% which indicates battery is discharging. In second graph positive sign indicates consistent load applied to the battery which means battery is discharging and the discharging current is levelled off. In voltage vs time graph, we see that the voltage started around 4.27 V then decreased gradually approaches just over 4.1 V. The state of charge vs time graph shows that SOC decreased gradually from nearly 90% to 20% which indicates battery is discharging. In second graph positive sign indicates consistent load applied to the battery which means battery is discharging and the discharging current is levelled off. In voltage vs time graph, we see that the voltage started around 4.26 V then decreased gradually approaches just over 4.12 V in Figure 12 (c) In Figure 12 (e) & (f) This graph illustrating cell balancing between two cells: one new and another 50% aged. Here are the key points. The graph displays two lines. A blue line represents the new cell, showing a steady increase from the origin. A green line represents the 50% aged cell, with a faster rate of increase compared to the blue line. Cell balancing aims to equalize the charge/discharge levels between cells in a battery pack. The graph likely represents the state of charge (SOC) for both cells over time. The new cell charges faster, while the aged cell lags behind due to capacity loss. Effective cell balancing is crucial for optimal battery performance and longevity. The graph displays two lines. A blue line represents the new cell, showing a steady decrease from the origin. A green line represents the 50% aged cell, with a faster rate of decrease compared to the blue line. Cell balancing aims to equalize the charge/discharge levels between cells in a battery pack. The graph likely represents the state of charge (SOC) for both cells over time. The new cell discharges slower, while the aged cell lags discharge fast due to capacity loss in Figure 12 (f).
5. Conclusion
This study presents a thorough investigation of the aging effects and cell balancing challenges in lithium-ion batteries, offering insights critical for optimizing their performance, safety, and longevity. By analyzing the impact of temperature and aging on battery behavior, we demonstrated that aging mechanisms, including capacity fade and impedance rise, significantly influence the accuracy of state-of-charge (SOC) and state-of-health (SOH) estimations. The integration of these parameters into battery models has shown marked improvements in predictive accuracy and reliability, a step forward for advanced battery management systems (BMS), as illustrated in Figures 8 and 9. Our findings underscore the importance of temperature management in mitigating battery degradation. Specifically, the study reveals that lithium-ion batteries perform optimally at moderate temperatures, particularly around 20°C to 30°C. The battery exhibits the best balance between charging and discharging efficiency at these temperatures, with minimal degradation over time. Higher temperatures (40°C) accelerate aging, leading to increased capacity fade and reduced battery lifespan, while lower temperatures (10°C or below) result in slower charging rates and reduced efficiency. These findings emphasize the critical role of temperature management in mitigating degradation and the need for robust methodologies to address the complex interdependencies between aging, temperature, and operational conditions, as shown in the tables. The comparison of passive and active cell balancing techniques underscores the advantages of active methods in maintaining voltage uniformity and extending battery lifespan, particularly in high-demand applications such as electric vehicles and renewable energy storage. Beyond technical advancements, this work highlights the importance of adopting comprehensive battery management strategies that incorporate data-driven algorithms, real-time diagnostics, and advanced modeling techniques. Such strategies are essential for overcoming limitations in existing systems and meeting the growing energy demands of modern applications. The results of this study contribute to the broader field of sustainable energy by advancing the understanding of lithium-ion battery dynamics under aging and temperature stressors. These insights provide a foundation for developing next-generation batteries and BMS that prioritize efficiency, safety, and reliability, ultimately supporting the transition to a greener and more sustainable energy future. Future research should explore the integration of artificial intelligence and machine learning to further enhance battery diagnostics, predictive maintenance, and overall system performance. Additionally, the development of advanced materials and multi-scale electrochemical models could offer deeper insights into battery aging mechanisms, enabling the design of more resilient and high-performance batteries. The integration of thermal management systems with BMS could further mitigate the adverse effects of temperature fluctuations, ensuring optimal battery operation across diverse environmental conditions. By addressing these challenges, the research paves the way for innovative solutions that enhance the sustainability and reliability of energy storage systems, driving progress toward a cleaner and more energy-efficient future.
Abbreviations

SOC

State of Charge

SOH

State of Health

SOL

State of Life

LIBs

Lithium-Ion Batteries

BMS

Battery Management System

SEI

Solid Electrolyte Interphase

DoD

Depth of Discharge

SVR

Support Vector Regression

Acknowledgments
I would like to extend my heartfelt gratitude to my esteemed advisor, Dr. Md. Anwar Hossain, Professor PhD, University of the Ryukyus, Okinawa, Japan, for his invaluable guidance, unwavering support, and insightful encouragement throughout this research journey. My sincere thanks also go to my colleagues, whose collaboration and encouragement played a pivotal role in the completion of this work on the "Improved Microgrid Controller with Robust Stability, Conjunction with PID Controllers."
Data Availability Statement
Data sharing not applicable to this article as no datasets were generated or analyzed during the current study.
Funding
None.
Conflicts of Interest
The authors declare no conflicts of interest.
References
[1] Shehzar Shahzad Sheikh, “Battery Health Monitoring Using Machine Learning,” 2019,
[2] M. Ecker et al., “Calendar and cycle life study of Li(NiMnCo)O2-based 18650 lithium-ion batteries,” J. Power Sources, vol. 248, pp. 839–851, Feb. 2014,
[3] K. K and P. P, “Analysis of cell balancing of Li-ion batteries with dissipative and non-dissipative systems for electric vehicle applications,” Energy Rep., vol. 12, pp. 2408–2428, Dec. 2024,
[4] A. Gaga, A. Tannouche, Y. Mehdaoui, and B. El Hadadi, “Methods for estimating lithium-ion battery state of charge for use in electric vehicles: a review,” Energy Harvest. Syst., vol. 9, no. 2, pp. 211–225, Nov. 2022,
[5] S. D. Nagarale and B. P. Patil, “Accelerating AI-Based Battery Management System’s SOC and SOH on FPGA,” Appl. Comput. Intell. Soft Comput., vol. 2023, pp. 1–18, Jun. 2023,
[6] S. Barcellona, S. Colnago, G. Dotelli, S. Latorrata, and L. Piegari, “Aging effect on the variation of Li-ion battery resistance as function of temperature and state of charge,” J. Energy Storage, vol. 50, p. 104658, Jun. 2022,
[7] P. Keil and A. Jossen, “Aging of Lithium-Ion Batteries in Electric Vehicles: Impact of Regenerative Braking,” World Electr. Veh. J., vol. 7, no. 1, pp. 41–51, Mar. 2015,
[8] M. Schindler, P. Jocher, A. Durdel, and A. Jossen, “Analyzing the Aging Behavior of Lithium-Ion Cells Connected in Parallel Considering Varying Charging Profiles and Initial Cell-to-Cell Variations,” J. Electrochem. Soc., vol. 168, no. 9, p. 090524, Sep. 2021,
[9] E. Laakso et al., “Aging mechanisms of NMC811/Si-Graphite Li-ion batteries,” J. Power Sources, vol. 599, p. 234159, Apr. 2024,
[10] N. Khan, C. A. Ooi, A. Alturki, M. Amir, Shreasth, and T. Alharbi, “A critical review of battery cell balancing techniques, optimal design, converter topologies, and performance evaluation for optimizing storage system in electric vehicles,” Energy Rep., vol. 11, pp. 4999–5032, Jun. 2024,
[11] P. Di Prima, D. Dessantis, D. Versaci, J. Amici, S. Bodoardo, and M. Santarelli, “Understanding calendar aging degradation in cylindrical lithium-ion cell: A novel pseudo-4-dimensional electrochemical-thermal model,” Appl. Energy, vol. 377, p. 124640, Jan. 2025,
[12] G. Krishna et al., “Advanced battery management system enhancement using IoT and ML for predicting remaining useful life in Li-ion batteries,” Sci. Rep., vol. 14, no. 1, p. 30394, Dec. 2024,
[13] D. Chrenko, M. Fernandez Montejano, S. Vaidya, and R. Tabusse, “Aging Study of In-Use Lithium-Ion Battery Packs to Predict End of Life Using Black Box Model,” Appl. Sci., vol. 12, no. 13, p. 6557, Jun. 2022,
[14] S. Sharma, A. K. Panwar, and M. M. Tripathi, “Storage technologies for electric vehicles,” J. Traffic Transp. Eng. Engl. Ed., vol. 7, no. 3, pp. 340–361, Jun. 2020,
[15] D. Baek, A. Bocca, and A. Macii, “A cost of ownership analysis of batteries in all-electric and plug-in hybrid vehicles,” Energy Ecol. Environ., vol. 7, no. 6, pp. 604–613, Dec. 2022,
[16] J. V. Barreras, E. Schaltz, S. J. Andreasen, and T. Minko, “Datasheet-based modeling of Li-Ion batteries,” in 2012 IEEE Vehicle Power and Propulsion Conference, Seoul, Korea (South): IEEE, Oct. 2012, pp. 830–835.
[17] B. Xu, A. Oudalov, A. Ulbig, G. Andersson, and D. S. Kirschen, “Modeling of Lithium-Ion Battery Degradation for Cell Life Assessment,” IEEE Trans. Smart Grid, vol. 9, no. 2, pp. 1131–1140, Mar. 2018,
[18] G. Vennam, A. Sahoo, and S. Ahmed, “A survey on lithium-ion battery internal and external degradation modeling and state of health estimation,” J. Energy Storage, vol. 52, p. 104720, Aug. 2022,
Cite This Article
  • APA Style

    Molla, S., Shawon, M., Nawaj, M. S., Emon, A. E. (2025). Analysis of Aging Effect and Cell Balancing Problem of Lithium-Ion Battery. Journal of Electrical and Electronic Engineering, 13(2), 92-107. https://doi.org/10.11648/j.jeee.20251302.11

    Copy | Download

    ACS Style

    Molla, S.; Shawon, M.; Nawaj, M. S.; Emon, A. E. Analysis of Aging Effect and Cell Balancing Problem of Lithium-Ion Battery. J. Electr. Electron. Eng. 2025, 13(2), 92-107. doi: 10.11648/j.jeee.20251302.11

    Copy | Download

    AMA Style

    Molla S, Shawon M, Nawaj MS, Emon AE. Analysis of Aging Effect and Cell Balancing Problem of Lithium-Ion Battery. J Electr Electron Eng. 2025;13(2):92-107. doi: 10.11648/j.jeee.20251302.11

    Copy | Download

  • @article{10.11648/j.jeee.20251302.11,
      author = {Sohan Molla and Md Shawon and Md Sajib Nawaj and Asif Eakball Emon},
      title = {Analysis of Aging Effect and Cell Balancing Problem of Lithium-Ion Battery
    },
      journal = {Journal of Electrical and Electronic Engineering},
      volume = {13},
      number = {2},
      pages = {92-107},
      doi = {10.11648/j.jeee.20251302.11},
      url = {https://doi.org/10.11648/j.jeee.20251302.11},
      eprint = {https://article.sciencepublishinggroup.com/pdf/10.11648.j.jeee.20251302.11},
      abstract = {This study presents an in-depth analysis of ageing and temperature effects in lithium-ion batteries, as well as an investigation into cell balancing issues. The ageing effect, encompassing capacity fade and impedance rise over time, is scrutinized through experimental and computational approaches. Through controlled cycling tests under various temperature conditions, the impact of temperature on battery ageing is evaluated, revealing accelerated degradation at higher temperatures. Additionally, a comprehensive battery model integrating ageing and temperature effects is developed to simulate the long-term behavior of lithium-ion cells. Furthermore, the study addresses cell balancing challenges, essential for maintaining uniform cell voltages within battery packs to enhance performance and longevity. Various cell balancing techniques, including passive and active methods, are reviewed and compared in terms of effectiveness and implementation complexity. Additionally, novel algorithms for dynamic cell balancing are proposed to mitigate voltage deviations among cells during operation. Overall, this thesis contributes to a better understanding of aging and temperature effect in lithium and battery, here we can see if we add aging and temperature effect battery charging time and voltage increase our time, on the other hand discharging time and voltage decrease.
    },
     year = {2025}
    }
    

    Copy | Download

  • TY  - JOUR
    T1  - Analysis of Aging Effect and Cell Balancing Problem of Lithium-Ion Battery
    
    AU  - Sohan Molla
    AU  - Md Shawon
    AU  - Md Sajib Nawaj
    AU  - Asif Eakball Emon
    Y1  - 2025/03/18
    PY  - 2025
    N1  - https://doi.org/10.11648/j.jeee.20251302.11
    DO  - 10.11648/j.jeee.20251302.11
    T2  - Journal of Electrical and Electronic Engineering
    JF  - Journal of Electrical and Electronic Engineering
    JO  - Journal of Electrical and Electronic Engineering
    SP  - 92
    EP  - 107
    PB  - Science Publishing Group
    SN  - 2329-1605
    UR  - https://doi.org/10.11648/j.jeee.20251302.11
    AB  - This study presents an in-depth analysis of ageing and temperature effects in lithium-ion batteries, as well as an investigation into cell balancing issues. The ageing effect, encompassing capacity fade and impedance rise over time, is scrutinized through experimental and computational approaches. Through controlled cycling tests under various temperature conditions, the impact of temperature on battery ageing is evaluated, revealing accelerated degradation at higher temperatures. Additionally, a comprehensive battery model integrating ageing and temperature effects is developed to simulate the long-term behavior of lithium-ion cells. Furthermore, the study addresses cell balancing challenges, essential for maintaining uniform cell voltages within battery packs to enhance performance and longevity. Various cell balancing techniques, including passive and active methods, are reviewed and compared in terms of effectiveness and implementation complexity. Additionally, novel algorithms for dynamic cell balancing are proposed to mitigate voltage deviations among cells during operation. Overall, this thesis contributes to a better understanding of aging and temperature effect in lithium and battery, here we can see if we add aging and temperature effect battery charging time and voltage increase our time, on the other hand discharging time and voltage decrease.
    
    VL  - 13
    IS  - 2
    ER  - 

    Copy | Download

Author Information
  • Department of Electrical & Electronic Engineering, Bangladesh University of Business and Technology, Dhaka, Bangladesh

  • Department of Electrical & Electronic Engineering, Bangladesh University of Business and Technology, Dhaka, Bangladesh

    Biography: Md Shawon Specializes in renewable energy, power electronics, and battery storage systems. His research focuses on perovskite solar cells, smart grid optimization, and lithium-ion battery aging analysis. He has published work on solar cell performance enhancement and smart transmission line protection. Additionally, he has explored HVDC transmission, IoT-based energy management, and VLSI circuit design for microgrid controllers. His goal is to advance sustainable energy technologies and intelligent power systems.

    Research Fields: Md Shawon's research focuses on renewable energy, power electronics, and battery storage systems, with expertise in perovskite solar cells, lithium-ion battery aging, and smart grid optimization. He has worked on HVDC transmission, IoT-based energy management, and VLSI circuit design for microgrid controllers, aiming to advance sustainable energy solutions and intelligent power systems.

  • Department of Electrical & Electronic Engineering, Bangladesh University of Business and Technology, Dhaka, Bangladesh

  • Department of Electrical & Electronic Engineering, Bangladesh University of Business and Technology, Dhaka, Bangladesh