The Joint Warfighting Concept is a framework for how the United States will fight in the future security landscape. To successfully carry out these new concepts, the military services must find ways to lessen the logistics burden at the strategic, operational, and tactical levels. Only by reducing the demands on its current and planned sustainment systems can the United States continue to be a dominant force on the world stage. However, defense agencies such as the Logistics Functional Capability Board lack a quantitative, credible, repeatable process to effectively assess and manage demand reduction initiatives. This paper is based on work from a student/faculty team that created an assessment system for demand reduction initiatives. Discussion highlights the systems engineering techniques that were used in the effort, which includes but is not limited to stakeholder analysis, functional analysis, morphological analysis, and value modeling. The blended qualitative and quantitative methods focused on user and stakeholder needs to create a process system to evaluate technologically disparate, multicriteria systems. The team expects that the resultant assessments system’s applicability to a range of demand reduction initiatives would be of interest to organizations that must prioritize technology proposals, as well as perform trade-off analysis. Additionally, the approach to create the assessment system has the flexibility to adapt to changes in the stakeholders’ requirements from the reduction initiatives, as well as the ongoing evolution of the warfighting concepts.
This is an Open Access article, distributed under the terms of the Creative Commons Attribution 4.0 International License (http://creativecommons.org/licenses/by/4.0/), which permits unrestricted use, distribution and reproduction in any medium or format, provided the original work is properly cited.
Demand Reduction, Value Modeling, Functional Analysis, Complex System, Assessment, Systems Analysis, Systems Engineering
1. Introduction
The Department of Defense (DoD) has shifted its focus on “near-peer threats.” This change necessitates new sustainment requirements, prompting investments in advanced technologies and processes. Additionally, the DoD has issued a directive to all military service to seek initiatives to reduce demand on the sustainment system
[1]
Webb, M. Personal communication. Oct. 2021.
[1]
. This directive generated technological, procedural, as well as personnel-related proposals.
A change in how the U.S. conducts war requires modifications in sustainment operations, specifically overseas. The 20 years of continual combat have resulted in a less capable sustainment force that will significantly hinder and possibly cause the failure of large-scale military operations
[2]
Lundy, M., Creed, R., Pence, S. Feeding the Forge: Sustaining Large-Scale Combat Operations. [Internet]. U.S. Army. 18 July 2019. Available from:
. The DoD envisions successful demand reduction initiatives (DRI) that will enable freedom of maneuver (FoM) and the ability of U.S. forces to increase operational tempo, reach, and endurance
[3]
Department of Defense. 2021. Joint Concept for Contested Logistics Draft. Washington, DC: Department of Defense.
[3]
. To reduce the logistical burden in the spectrum and levels of military operations, DoD is considering a range of DRIs
[1]
Webb, M. Personal communication. Oct. 2021.
[1]
. Consequently, the Logistics Functional Capability Board (LOG FCB) continues to grow a pipeline of new initiatives. However, LOG FCB lacks a quantitative, credible, and repeatable process to effectively evaluate and prioritize dissimilar DRIs.
A team comprised of students and faculty addressed the LOG FCB concerns through a series of case studies of DRI cases
[4]
Achor, Nathanael B.; Franks, Courtney N.; Gillogly, William N.; Groller, Randall P. 2022. “Developing an Assessment System for DoD Demand Reduction Initiatives.” Master’s thesis, Naval Postgraduate School.
. This paper is a synopsis of that research effort. Additionally, the study offers extensions that enable LOG FCB to adopt the assessment system for future evaluation challenges.
The primary objective of this research project is to develop the DRI Assessment System (DAS), a process system, which can manage proposed DRI through assessment, comparison, and prioritization for investment based on the JWC. In achieving this main objective, the research team also addressed the following:
1. Identify measurable attributes common to different DRIs.
2. Construct value models to score attributes of different DRIs on a common scale.
3. Conduct a comparative analysis of prioritized DRI with and without DAS.
4. Draft a DAS User’s Manual.
Additionally, the team had to consider to which DRIs that DAS could be applied, as well as the stakeholders’ value system that could, at times, not align with the JWC needs. The team’s systematic approach to development was critical for remaining unbiased in the final version of DAS.
1.1. Scope and Data
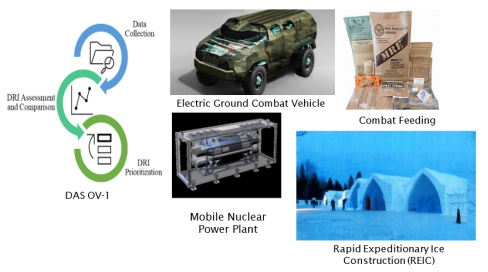
The scope of this study is bound by the availability of data to guide development of the system. In this case, the “data” are the proposed DRIs that are mature enough in the development process to allow the team to analyze relevant information about the DRIs. The team considered DRIs that were available in the period, October 2021 – June 2022 (Figure 1). The complexity of each system required a systems engineering approach to analyze the appropriate elements of each system
[5]
Johnson, B., Hernandez, A. S. Exploring Engineered Complex Adaptive Systems of Systems. Procedia Computer Science. 2016. 95, 58–65.
. The LOG FCB’s projects ranged from the Rapid Expeditionary Ice Construction (REIC), an additive manufacturing system that utilizes ice, snow, and a lightweight cellulose instead of concrete, to mobile nuclear power plants (MNPP).
Another challenging consideration for developing an assessment system was the need to accommodate each Service’s priorities along with the JWC mandates. Therefore, the researchers examined the DRIs in context of the operational environment for the next five years. To meet the project sponsor’s goal, the team delivered results in time for the Joint Staff J-4 and LOG FCB chair to apply during fiscal year 2023 reviews.
This research creates an assessment system that can produce a prioritized list of DRIs to inform the LOG FCB Chair’s decisions. The development of DAS offers the user with the means to identify relevant DRI data as input for the value models. In prioritizing the initiatives that reduce demands on the sustainment structure, LOG FCB expects that the long-term benefit to the warfighter will be an increase in operational reach, lessening of logistical complications during missions in contested environments, while saving time, money and lives. The results of this work will allow the end user to refine the DAS for implementation to future initiatives.
1.2. Overview of the Study Approach
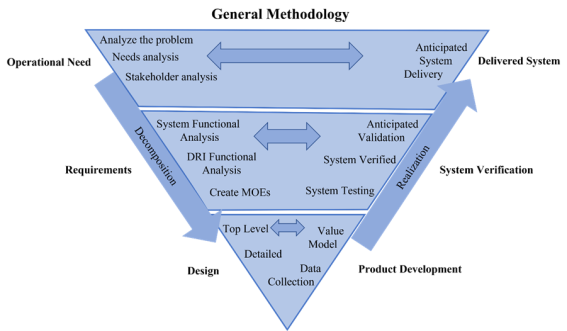
The systems engineering vee-model was used to design and develop the DAS (Figure 2). This process has five key areas of discussion: (1) problem definition, (2) system requirements, (3) functional decomposition, (4) design and development, and (5) verification
[6]
Blanchard, B., Fabrycky, W. Systems engineering analysis. 5th ed. Harlow, Essex: Pearson Education Limited; 2014.
Blanchard, B., Fabrycky, W. Systems engineering analysis. 5th ed. Harlow, Essex: Pearson Education Limited; 2014.
[6]
.
The steps on the left-hand side of the vee-model are fundamental to the systems engineering process. Different techniques may be used at each step. For instance, the problem definition can be developed with cause-and-effect diagrams, i.e., an Ishikawa diagram. Interviews or surveys are instrumental for stakeholder analysis to define overarching system requirements and user objectives. Conceptual designs are created through different means such as analogous systems, general morphological analysis, or synectics. This paper describes the techniques that the development team used.
The team followed the general process of the vee-model. When necessary, the team modified the techniques to accommodate the nature of the problem. For instance, the Ishikawa diagram
[7]
Ishikawa, K. Guide to quality control. Translated by the Asian Productivity Organization. Tokyo: JUSE Press Ltd; 1974.
[7]
is a cause-and-effect tool for a team to come to consensus on the problem to be addressed and the situation surrounding the problem. However, the team used the Ishikawa diagram for stakeholder analysis, a systems engineering approach to elicit the stakeholders’ requirements. Traditionally, stakeholder analysis is performed through a relatively regimented process. Formal interviews and questionnaires are common instruments. Because the issue is complex, the team opted for the Ishikawa diagram, which provided a more in-depth discussion with the stakeholder in the development of the diagram.
2. Preliminary Analysis for Das Development
Stakeholder Analysis through the Ishikawa or Fishbone Diagram
An Ishikawa diagram
[7]
Ishikawa, K. Guide to quality control. Translated by the Asian Productivity Organization. Tokyo: JUSE Press Ltd; 1974.
[7]
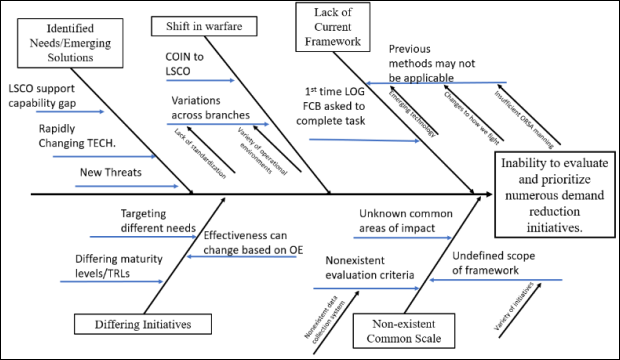
identified five major factors that contributed to the overall problem, the inability to compare and prioritize sustainment focused DRIs (Figure 3). The “head” of the fish is on the right side of the diagram, and each fin is the cause of the problem.
1. Shift in warfare to focus on near-peer competitors,
2. New needs of the force associated with the JWC,
3. Range of disparate, dissimilar DRIs,
4. Absence of an assessment system for initiatives traditionally unrelated to sustainment, and
5. Lack of an approach to compare disparate initiatives.
These factors mapped onto the required capabilities that the eventual DAS must possess. The following sections show the trace of these causal factors into the design for the DAS.
Figure 3. The Cause-and-Effect Diagram for DAS Development. Adapted from
[4]
Achor, Nathanael B.; Franks, Courtney N.; Gillogly, William N.; Groller, Randall P. 2022. “Developing an Assessment System for DoD Demand Reduction Initiatives.” Master’s thesis, Naval Postgraduate School.
Ishikawa, K. Guide to quality control. Translated by the Asian Productivity Organization. Tokyo: JUSE Press Ltd; 1974.
[4, 7]
.
2.1. Hierarchical Objectives and System Level Requirements Analysis
These activities enabled development of a high-level system requirements hierarchy. A needs analysis established the baseline for system level requirements against which other design configurations were evaluated. The Joint Staff, J-4 Analysis Branch is the primary stakeholder for this project and the end user for the DAS tool. The main purpose for DAS is to prioritize DRIs. A stakeholder analysis provided the background for determining end-user needs and capability gaps. From these conversations with the stakeholder, the team defined system level requirements to support system functional analysis and design.
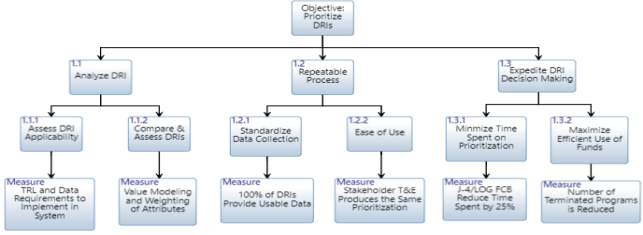
Another result from the needs analysis is an understanding of how the stakeholder expects the system to behave. These non-functional requirements are the basis of constructing an objectives hierarchy. This systems engineering technique created a tree of the customer’s needs. The structure of the tree led to development of metrics for evaluation (Figure 4). Metrics identification is a critical step for value modeling that will comparative analysis of dissimilar DRIs on a common scale.
Figure 4. Stakeholder Objectives Hierarchy for the DAS
[4]
Achor, Nathanael B.; Franks, Courtney N.; Gillogly, William N.; Groller, Randall P. 2022. “Developing an Assessment System for DoD Demand Reduction Initiatives.” Master’s thesis, Naval Postgraduate School.
The system level requirements led the team to develop an understanding of what DAS must do to achieve its overarching purpose. This section explains 1) the function of each component in the system, 2) the necessary physical methods for the component to achieve the function, and 3) how components complement each other in the fully functioning system. The team’s key areas of work to build DAS included collecting accurate and usable data, identifying how to analyze that data, and frequent communication with the stakeholders to verify that DAS construction was in accordance with where LOG FCB envisioned it would be applied.
Functional analysis of the DAS began with the identification of the overarching purpose for the system. This critical step resulted in determining specific functions that the system must perform. The essence of this analysis is to ask the question, “What must the system do to achieve its overarching purpose?” The primary purpose for DAS is to Prioritize Disparate Initiatives (1.0) at the top of the functional tree. The three sub-functions are: 1.1 Gather Data, 1.2 Identify DRI Attributes, and 1.3 Rank DRIs. The three sub-functions were further broken down into their most basic functions as depicted in Table 1.
Table 1. DAS Functional Analysis Requirements
[4]
Achor, Nathanael B.; Franks, Courtney N.; Gillogly, William N.; Groller, Randall P. 2022. “Developing an Assessment System for DoD Demand Reduction Initiatives.” Master’s thesis, Naval Postgraduate School.
The DAS shall provide a repeatable process resulting in prioritized DRIs.
1.1
Gather Data
The DAS shall gather data from DRI sponsors.
1.1.1
Standardize Data
The DAS shall standardize data received from DRI sponsors.
1.1.2
Identify Measurable Data
The DAS shall provide instruction on applicable quantitative or qualitative data.
1.2
Identify DRI Attributes
The DAS shall provide and/or identify DRI attributes.
1.2.1
Identify Metrics
The DAS shall implement appropriate quantitative and/or qualitative metrics for assessment.
1.2.1.1
Link Data to Metrics
The DAS shall provide metrics specific to each attribute.
1.2.1.2
Normalize Metric Data
That DAS shall include a scaling of attributes to assess all DRIs evenly, in a repeatable manner.
1.2.2
Narrow Attributes that only effect Operational Needs
The DAS shall eliminate non-technology DRIs and out-of-scope attributes.
1.3
Rank DRIs
The DAS shall provide a prioritization of DRIs.
1.3.1
Conduct AoA
The DAS shall conduct AoA to enable the assessment and comparison of DRIs.
1.3.2
Compare DRIs
The DAS shall compare DRIs.
Table 1 shows the decomposition of the DAS’s required functions and detailed subfunctions in the first two columns. They match the objectives tree from the stakeholder analysis (Figure 4). The right-hand side of the table explains the system requirement that addresses one or more functions. Following this process ensured that the system requirements were traceable to the original needs of the stakeholder. These systems engineering steps were the basis for developing the DAS. Of note, functional decomposition is a critical activity in the DAS. The research team next mapped functions in Table 1 to potential physical forms that would perform each function.
2.3. Function-to-Component Mapping and the Morphological Box
The team researched and identified a variety of physical forms to achieve the functions in Table 1. The left-hand column in Table 2 is a list of functions that DAS must perform. The right-hand columns are component options to achieve the function. For instance, options to “Gather Data” are questionnaires and interviews. Therefore, to generate one instance of a conceptual design, the engineer selects one option from each row, as shown in the green shaded boxes in Table 2.
The team reviewed all feasible instantiations and, for demonstration purposes in this study, chose a reasonable system (shaded in green) that would be able to perform all the identified system functions. While the research sponsor agreed to this specific design, the team recommends an in-depth analysis of alternatives to reduce the options to a manageable subset of feasible conceptual designs.
As an additional trace, the team developed a physical decomposition of DAS to connect the chosen forms from Table 2 to the function(s) that the component would perform. The idea for this hierarchical tree is to ensure that each function that the DAS must perform is addressed by a specific component. For instance, the value modeling process of DAS served to normalize the data, while functional analysis determined metrics linked to the attributes. The following sections illustrate the application of the conceptual design outlined in Table 2.
Table 2. System Functions Traceability Matrix
[4]
Achor, Nathanael B.; Franks, Courtney N.; Gillogly, William N.; Groller, Randall P. 2022. “Developing an Assessment System for DoD Demand Reduction Initiatives.” Master’s thesis, Naval Postgraduate School.
A critical step in creating the DAS involved establishing the common attributes of any DRI proposal that LOG FCB would expect to assess. The team used the set of known proposals from the set of initial DRIs from LOG FCB as the basis for establishing the core attributes of a DRI. A functional analysis of the DRIs provided identified the functions that the DRI is to serve if implemented. These functions are listed on the left-hand side of Table 3. The following columns are the specific DRIs. An “X” marked in the box associated the function with the DRI. This visual provided the team with an understanding of the common functions across the different DRIs.
This functional analysis traced the JWC areas that each DRI impacted. Stakeholders also determined that two of the functions in Table 3 are unlikely to be considered as core functions in future DRI proposals. Therefore, they were removed. The next step for the team was to construct appropriate measures to evaluate the degree that each function is achieved.
Table 3. Comparison of Functions to DRIs
[4]
Achor, Nathanael B.; Franks, Courtney N.; Gillogly, William N.; Groller, Randall P. 2022. “Developing an Assessment System for DoD Demand Reduction Initiatives.” Master’s thesis, Naval Postgraduate School.
The team first compared the attributes to their effect on maneuverability as being the most critical during operations according to the JWC and Joint Concept of Contested Logistics. Related to maneuverability, other operational factors against which the DRI attributes were compared are speed, reach, endurance, and flexibility
[2]
Lundy, M., Creed, R., Pence, S. Feeding the Forge: Sustaining Large-Scale Combat Operations. [Internet]. U.S. Army. 18 July 2019. Available from:
. These final operational factors became the basis for selecting the subset of DRI functions. Using a rating scale of low (1), medium (3), and high (5) with regard to operational impact, the team scored the DRI functions (Table 4).
Table 4. Top Functions Based on Impact on Operations
[4]
Achor, Nathanael B.; Franks, Courtney N.; Gillogly, William N.; Groller, Randall P. 2022. “Developing an Assessment System for DoD Demand Reduction Initiatives.” Master’s thesis, Naval Postgraduate School.
The right most column suggests that “Reduce Storage,” “Reduce Augmented Power Sources,” and “Reduce Costs” should be removed as core functions. The primary stakeholders agreed with the team.
The team administered a questionnaire to the DRI developers as a second method to reduce the functions to a manageable subset. A major item in the questionnaire was the availability of relevant data to evaluate the function. From this review, the team determined that the functions shaded in yellow, “Reduce Resupply Platforms” and “Increase Availability,” were unlikely to produce usable data for the DAS. Additionally, if the team could not determine or found the claim not credible regarding the function’s impact, the response was discarded. The primary stakeholder agreed that these two functions were not significant for assessing DRIs. The final four common functions provide clarity into how to assess DRIs. See Table 5. Within each definition is a unit of measurement. These measures are the attributes that will be used to assess different DRIs.
Table 5. Final Four Common DRI Functions and Associated Measures
[4]
Achor, Nathanael B.; Franks, Courtney N.; Gillogly, William N.; Groller, Randall P. 2022. “Developing an Assessment System for DoD Demand Reduction Initiatives.” Master’s thesis, Naval Postgraduate School.
The amount of space occupied by a three-dimensional object as measured in cubic units. Does not include volume of fuel.
Reduce Fuel Consumption
The amount of fuel the engine of a system burns each hour in gallons, or the amount of fuel no longer required to transport.
Reduce Weight
The amount that an object weighs as measured in pounds (lbs.). Does not include weight of fuel.
Reduce Manhours
The number of hours required for military and civilian personnel that are required, authorized, and potentially available to train, operate, maintain, and support the system. (1 FTE = 40-hour work week)
3.2. Rank DRIs Through Value Modeling
The next component of DAS to develop is a process to Rank DRIs. The team used a value modeling approach
[7]
Ishikawa, K. Guide to quality control. Translated by the Asian Productivity Organization. Tokyo: JUSE Press Ltd; 1974.
[8]
Parnell, G., Trainor, T. Using the Swing Weight Matrix to Weight Multiple Objectives. Proceedings of the INCOSE International Symposium. 2009, 19 (1), 283–298.
[9]
Keeney, R. L. Value focused thinking: A path to creative decision-making. Cambridge, MA: Harvard University Press; 1992.
[7-9]
. Developing a value function for DAS required LOG FCB leaders and staff to map each measurable attribute to a common scale for level of “goodness,” where goodness is the ability of the DRI to achieve an objective or function
[9]
Keeney, R. L. Value focused thinking: A path to creative decision-making. Cambridge, MA: Harvard University Press; 1992.
[9]
. A common value scale provided a reasonable, repeatable method to aggregate dissimilar units of measure to assess different DRIs. The team selected a value scale that ranged from 1 to 20, with one being the stakeholder’s lowest perceived value of the DRI if it were to achieve the reduction it claimed. If an attribute did not appear in the DRI, that attribute had zero value.
3.3. Value Modeling of Attributes
Developing relevant metrics is an important step in value modeling. The team performed studies from industry and DoD to identify useful metrics for this study. The results led to organizations that rated product lines in terms of the attributes in Table 5. The team reviewed studies from and about companies such as Ford, Amazon, Tesla, Dell, and the DoD that were intended to improve efficiency and business practices. Highlights from these studies are listed below and informed the team on the appropriate data to collect and relate to the value scale
[4]
Achor, Nathanael B.; Franks, Courtney N.; Gillogly, William N.; Groller, Randall P. 2022. “Developing an Assessment System for DoD Demand Reduction Initiatives.” Master’s thesis, Naval Postgraduate School.
1. Ford Motor Company switched its automobile body from steel to aluminum, which was projected to reduce fuel consumption by 2% and other changes, such as engine options, to further reduce fuel consumption by 5–29%
[10]
Woodyard, C. Ford Sees Gas Mileage Gains in New F-150 Pickups. USA Today. 21 November 2014. Available from:
3. The U.S. Army’s Improved Turbine Engine has a goal of reducing fuel consumption by 25%
[12]
National Research Council. Force multiplying technologies for logistics support to military operations. Washington, DC: The National Academies Press; 2014.
4. The U.S. Army’s goal in research of waste-to-energy was to displace 85% of Jet Propellant-8
[12]
National Research Council. Force multiplying technologies for logistics support to military operations. Washington, DC: The National Academies Press; 2014.
5. The U.S. Army’s efficient power train program aimed to develop engines with a 15–20% reduction in fuel consumption
[12]
National Research Council. Force multiplying technologies for logistics support to military operations. Washington, DC: The National Academies Press; 2014.
6. A microgrid test in Afghanistan had a 17% fuel-consumption reduction
[12]
National Research Council. Force multiplying technologies for logistics support to military operations. Washington, DC: The National Academies Press; 2014.
7. The U.S. Marine Corps studied a new ship-to-shore connector that had 11% better fuel efficiency
[12]
National Research Council. Force multiplying technologies for logistics support to military operations. Washington, DC: The National Academies Press; 2014.
8. A Bradley replacement engine was predicted to reduce fuel consumption by 50%
[12]
National Research Council. Force multiplying technologies for logistics support to military operations. Washington, DC: The National Academies Press; 2014.
10. Utilizing the under armor auxiliary power unit (UAAPU) on the Abrams M1A2 SEPv3 battle tank, provided a 78% reduction in fuel consumption when running the main engine at idle
[14]
Director Operational Test and Evaluation. FY 2020 Annual Report. Washington, DC, USA; 2021. Available from:
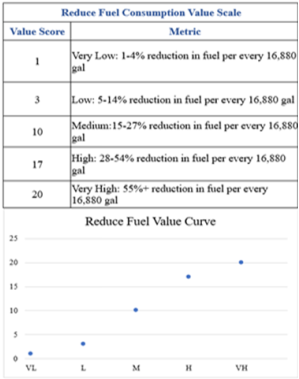
The average reduction from the studies was 28% with a standard deviation of 0.27, which the team used to develop the end points of the measure. To normalize the comparisons, the team used the daily fuel consumption that a 5,000-person camp would require in a desert climate. This amount was 16,880 gallons of fuel
[15]
Gildea, G., Carpenter, P., Campbell, B., Quigley, J., Diaz, J., Langley, J., … Miletti, J. SLB-STO-D Analysis Report: Modeling and Simulation Analysis of Fuel, Water, and Waste Reductions in Base Camps: 50, 300, and 1000 Persons. U. S. Army Natick Soldier Research Development and Engineering Center, Natick, MA, NATICK/TR-17/023, 2017. Available from:
Figure 5. Attribute Value Scale and Value Curve for Fuel Consumption
[4]
Achor, Nathanael B.; Franks, Courtney N.; Gillogly, William N.; Groller, Randall P. 2022. “Developing an Assessment System for DoD Demand Reduction Initiatives.” Master’s thesis, Naval Postgraduate School.
The team used a constructed approach to develop the value curves “Reduced Fuel Consumption.” This was an appropriate method in this initial model, given the expected difficulties in data collection. The study of these companies enabled the team to stratify data and develop a value model. Parnell and Trainor
[8]
Parnell, G., Trainor, T. Using the Swing Weight Matrix to Weight Multiple Objectives. Proceedings of the INCOSE International Symposium. 2009, 19 (1), 283–298.
[8]
provide a step-by-step description for mapping metrics to value scores. Figure 5 presents the value scale for the attribute “Reduce Fuel Consumption.” The top half of Figure 5 consists of an explanation for the meaning of specific value scores. For instance, if the DRI reduced fuel consumption by 1 to 4% per 16,880 gallons, the stakeholder considered this attribute to be low for the DRI and assigned it a score of 1. The team collaborated with the stakeholder to ensure that the value scales captured the stakeholder’s intent.
The lower half of Figure 5 is a visualization of the shape of the relationship between the attribute measure and the value scores. For “Reduce Fuel Consumption,” the categories of “Very Low through Very High” are linear or proportionally related to the value score. This same process was used for the other attributes.
3.4. Attribute Weights: Measuring Importance to Stakeholder(s)
Understanding the importance of a measure or attribute to the stakeholder is essential to DAS. The degree of importance is captured in swing weights (1–100), raw scores that when normalized is the relative weight of an attribute in context of other attributes being considered. The Parnell Matrix is a common technique to reflect swing weights as shown in Table 6
[8]
Parnell, G., Trainor, T. Using the Swing Weight Matrix to Weight Multiple Objectives. Proceedings of the INCOSE International Symposium. 2009, 19 (1), 283–298.
[8]
. The matrix is structured in terms of importance and variance. The columns indicate the stakeholder’s view of the importance of the attribute as High, Medium, or Low. The rows of the matrix describe the range of the raw measure of the attribute. The greater ranges between minimum and maximum enable analysts to differentiate between a good and bad result more easily. For instance, when evaluating a vehicle for purchase where top speed is a desired attribute, the buyer can easily decide when one vehicle can reach 120 miles per hour (mph) and the other vehicle’s top speed is 80 mph. It would not be so straightforward a choice if the difference between top speed were 100 mph and 95 mph.
Attributes that the stakeholder views of greatest importance and having the greatest variance are placed in the top left corner of the matrix and assigned the highest swing weight. Conversely, those viewed as least important and having the least variance are placed in the bottom right corner. In collaboration with the team, representatives from the J-4 Analysis Branch assigned the swing weights as shown in Table 6.
The swing weights were normalized by summing the swing weights from each attribute and then dividing each swing weight by the total. The resulting weight is shown in Table 7, “Measured Weight.” The stakeholders verified and approved the attributes’ measured weights to be used within the DAS.
Table 6. Swing Weight Matrix. Adapted from
[4]
Achor, Nathanael B.; Franks, Courtney N.; Gillogly, William N.; Groller, Randall P. 2022. “Developing an Assessment System for DoD Demand Reduction Initiatives.” Master’s thesis, Naval Postgraduate School.
Parnell, G., Trainor, T. Using the Swing Weight Matrix to Weight Multiple Objectives. Proceedings of the INCOSE International Symposium. 2009, 19 (1), 283–298.
Achor, Nathanael B.; Franks, Courtney N.; Gillogly, William N.; Groller, Randall P. 2022. “Developing an Assessment System for DoD Demand Reduction Initiatives.” Master’s thesis, Naval Postgraduate School.
The three major components of DAS are established processes that the J-4 Analysis Branch can apply to prioritize DRIs and make recommendations to the LOG FCB for investments. DRIs that had a total value score (TVS) close to 20 would be the likely candidates for continued support. Table 8 easily shows that MAFFS and Combat Feeding initiatives have the greatest overall value. This computation informs the decision makers on managing their investment of resources to deliver useful products to warfighters. A TVS is computed for a DRI by multiplying the DRI’s value score for each attribute by the associated measured weight, and then summing the resultant products. For instance, MNPP has a TVS of 7.37 while STAMP has a TVS of 10.96 (Table 8). Given these two choices, the J-4 would recommend STAMP ahead of MNPP. Although the two systems are different, value modeling enables comparison because the core functions and associated attribute measures are the only consideration in the assessment
[4]
Achor, Nathanael B.; Franks, Courtney N.; Gillogly, William N.; Groller, Randall P. 2022. “Developing an Assessment System for DoD Demand Reduction Initiatives.” Master’s thesis, Naval Postgraduate School.
. Table 8 shows all 10 DRIs that the J-4 provided. The total under each “Weight” column of the DRI is its TVS. In this manner, the J-4 analysts can prioritize the full set of DRIs and trace the justification for the recommendations. Should the stakeholder decide to change the weights, the process can adjust accordingly with new prioritization. As a result of this effort, the LOG FCB used this process during the 2023 financial year review.
Table 8. Application of DAS on Proposed DRIs
[4]
Achor, Nathanael B.; Franks, Courtney N.; Gillogly, William N.; Groller, Randall P. 2022. “Developing an Assessment System for DoD Demand Reduction Initiatives.” Master’s thesis, Naval Postgraduate School.
The challenges that the JWC presented to the sustainment and logistics community were numerous. Ideas to reduce demands on sustainment and logistics systems are prevalent and generate technological solutions. However, the demands that are to be reduced come in many disparate units of measures. The technologies themselves come in numerous forms. Each manufacturer claims specific performance measures to promote their product. Yet, these measures of performance are not necessarily the critical element of the solution being offered. The logistics and sustainment communities lack a means to manage the various DRIs that are offered.
This study has developed a tool to evaluate a range of DRIs. In creating this instrument, the team provides the LOG FCB with a way to manage the resources that might be invested in the proposed DRI. The application of a systems engineering approach analyzed the fundamental functions and components for an assessment system that supports quantitative comparison and prioritization of the DRIs. A key component of the DAS is a value modeling approach that can be adjusted as the logistics, sustainment, JWC, and the security requirements change
[9]
Keeney, R. L. Value focused thinking: A path to creative decision-making. Cambridge, MA: Harvard University Press; 1992.
[9]
. The overall methodology remains the same.
The resultant system, DAS, was demonstrated on the set of DRIs that were mature enough to provide the necessary quantitative information. The system clearly shows the differences between the DRIs based on unbiased total value scores computed from critical measures that the primary stakeholders identified. Concepts for how the DAS is implemented in the LOG FCB process or contingency planning within the JWC framework remain to be developed.
The team encountered some obstacles during the development of DAS. Recommendations seek to remove the limitations and constraints. The most significant of these recommendations is the need to identify relevant, quantifiable, collectable measures for the reductions that the DRI proposes. LOG FCB review of proposals should include operator buy-in for the plausibility and feasibility of the DRI to be implemented in operations. Stakeholders should review the core functions and associated attribute measures that will be used for future DRI assessments. It is likely that the core set of functions will grow as more diverse DRIs are considered. It will be incumbent on LOG FCB or DAS users to develop relevant measures. The methodology that the team used can be followed by other scientists and managers who wish to compare a set of diverse systems.
Abbreviations
AoA
Analysis of Alternatives
APM
Autonomous Predictive Maintenance
BLS
Biomanufacturing of Lubricants from Seawater
CF
Combat Feeding
DAS
DRI Assessment System
DoD
Department of Defense
DRI
Demand Reduction Initiatives
FoM
Freedom of Maneuver
JWC
Joint Warfighting Concept
LOG FCB
Logistics Functional Capability Board
MAFFS
Mobile Advanced Fuel Filling Station
MNPP
Mobile Nuclear Power Plants
mph
Miles Per Hour
REIC
Rapid Expeditionary Ice Construction
STAMP
Secure Tactical Advanced Mobile Power
TaCV-E
Tactical and Combat Vehicle-Electrification
TVS
Total Value Score
UCA
Underwater Cure Adhesives
Conflicts of Interest
The authors declare no conflicts of interest.
References
[1]
Webb, M. Personal communication. Oct. 2021.
[2]
Lundy, M., Creed, R., Pence, S. Feeding the Forge: Sustaining Large-Scale Combat Operations. [Internet]. U.S. Army. 18 July 2019. Available from:
Department of Defense. 2021. Joint Concept for Contested Logistics Draft. Washington, DC: Department of Defense.
[4]
Achor, Nathanael B.; Franks, Courtney N.; Gillogly, William N.; Groller, Randall P. 2022. “Developing an Assessment System for DoD Demand Reduction Initiatives.” Master’s thesis, Naval Postgraduate School.
Blanchard, B., Fabrycky, W. Systems engineering analysis. 5th ed. Harlow, Essex: Pearson Education Limited; 2014.
[7]
Ishikawa, K. Guide to quality control. Translated by the Asian Productivity Organization. Tokyo: JUSE Press Ltd; 1974.
[8]
Parnell, G., Trainor, T. Using the Swing Weight Matrix to Weight Multiple Objectives. Proceedings of the INCOSE International Symposium. 2009, 19 (1), 283–298.
[9]
Keeney, R. L. Value focused thinking: A path to creative decision-making. Cambridge, MA: Harvard University Press; 1992.
[10]
Woodyard, C. Ford Sees Gas Mileage Gains in New F-150 Pickups. USA Today. 21 November 2014. Available from:
National Research Council. Force multiplying technologies for logistics support to military operations. Washington, DC: The National Academies Press; 2014.
Gildea, G., Carpenter, P., Campbell, B., Quigley, J., Diaz, J., Langley, J., … Miletti, J. SLB-STO-D Analysis Report: Modeling and Simulation Analysis of Fuel, Water, and Waste Reductions in Base Camps: 50, 300, and 1000 Persons. U. S. Army Natick Soldier Research Development and Engineering Center, Natick, MA, NATICK/TR-17/023, 2017. Available from:
Hernandez, A., Achor, N., Franks, C., Gillogly, W., Groller, R., et al. (2024). An Engineered Assessment System to Manage Demand Reduction Initiatives. International Journal of Systems Engineering, 8(1), 11-21. https://doi.org/10.11648/j.ijse.20240801.12
Hernandez, A.; Achor, N.; Franks, C.; Gillogly, W.; Groller, R., et al. An Engineered Assessment System to Manage Demand Reduction Initiatives. Int. J. Syst. Eng.2024, 8(1), 11-21. doi: 10.11648/j.ijse.20240801.12
Hernandez A, Achor N, Franks C, Gillogly W, Groller R, et al. An Engineered Assessment System to Manage Demand Reduction Initiatives. Int J Syst Eng. 2024;8(1):11-21. doi: 10.11648/j.ijse.20240801.12
@article{10.11648/j.ijse.20240801.12,
  author = {Alejandro Hernandez and Nathanael Achor and Courtney Franks and William Gillogly and Randall Groller and William Hatch and Nicholas Ulmer},
  title = {An Engineered Assessment System to Manage Demand Reduction Initiatives
},
  journal = {International Journal of Systems Engineering},
  volume = {8},
  number = {1},
  pages = {11-21},
  doi = {10.11648/j.ijse.20240801.12},
  url = {https://doi.org/10.11648/j.ijse.20240801.12},
  eprint = {https://article.sciencepublishinggroup.com/pdf/10.11648.j.ijse.20240801.12},
  abstract = {The Joint Warfighting Concept is a framework for how the United States will fight in the future security landscape. To successfully carry out these new concepts, the military services must find ways to lessen the logistics burden at the strategic, operational, and tactical levels. Only by reducing the demands on its current and planned sustainment systems can the United States continue to be a dominant force on the world stage. However, defense agencies such as the Logistics Functional Capability Board lack a quantitative, credible, repeatable process to effectively assess and manage demand reduction initiatives. This paper is based on work from a student/faculty team that created an assessment system for demand reduction initiatives. Discussion highlights the systems engineering techniques that were used in the effort, which includes but is not limited to stakeholder analysis, functional analysis, morphological analysis, and value modeling. The blended qualitative and quantitative methods focused on user and stakeholder needs to create a process system to evaluate technologically disparate, multicriteria systems. The team expects that the resultant assessments system’s applicability to a range of demand reduction initiatives would be of interest to organizations that must prioritize technology proposals, as well as perform trade-off analysis. Additionally, the approach to create the assessment system has the flexibility to adapt to changes in the stakeholders’ requirements from the reduction initiatives, as well as the ongoing evolution of the warfighting concepts.
},
 year = {2024}
}
TY  - JOUR
T1  - An Engineered Assessment System to Manage Demand Reduction Initiatives

AU  - Alejandro Hernandez
AU  - Nathanael Achor
AU  - Courtney Franks
AU  - William Gillogly
AU  - Randall Groller
AU  - William Hatch
AU  - Nicholas Ulmer
Y1  - 2024/06/29
PY  - 2024
N1  - https://doi.org/10.11648/j.ijse.20240801.12
DO  - 10.11648/j.ijse.20240801.12
T2  - International Journal of Systems Engineering
JF  - International Journal of Systems Engineering
JO  - International Journal of Systems Engineering
SP  - 11
EP  - 21
PB  - Science Publishing Group
SN  - 2640-4230
UR  - https://doi.org/10.11648/j.ijse.20240801.12
AB  - The Joint Warfighting Concept is a framework for how the United States will fight in the future security landscape. To successfully carry out these new concepts, the military services must find ways to lessen the logistics burden at the strategic, operational, and tactical levels. Only by reducing the demands on its current and planned sustainment systems can the United States continue to be a dominant force on the world stage. However, defense agencies such as the Logistics Functional Capability Board lack a quantitative, credible, repeatable process to effectively assess and manage demand reduction initiatives. This paper is based on work from a student/faculty team that created an assessment system for demand reduction initiatives. Discussion highlights the systems engineering techniques that were used in the effort, which includes but is not limited to stakeholder analysis, functional analysis, morphological analysis, and value modeling. The blended qualitative and quantitative methods focused on user and stakeholder needs to create a process system to evaluate technologically disparate, multicriteria systems. The team expects that the resultant assessments system’s applicability to a range of demand reduction initiatives would be of interest to organizations that must prioritize technology proposals, as well as perform trade-off analysis. Additionally, the approach to create the assessment system has the flexibility to adapt to changes in the stakeholders’ requirements from the reduction initiatives, as well as the ongoing evolution of the warfighting concepts.

VL  - 8
IS  - 1
ER  -