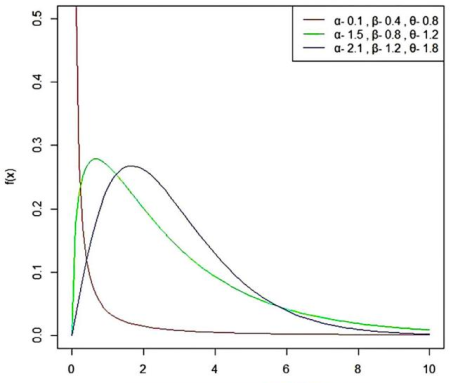
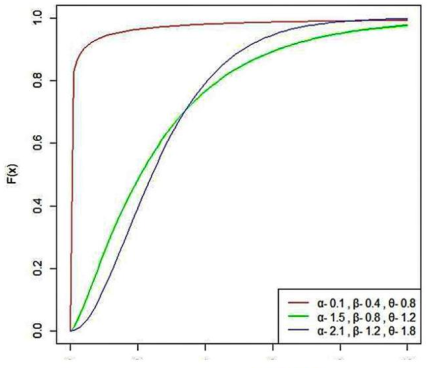
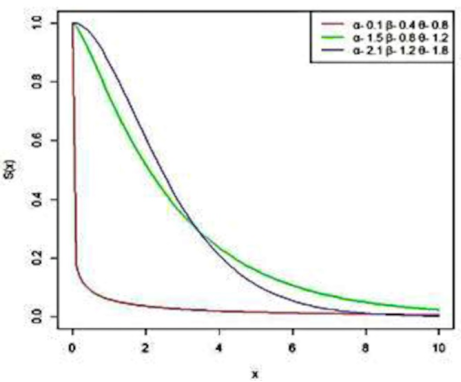
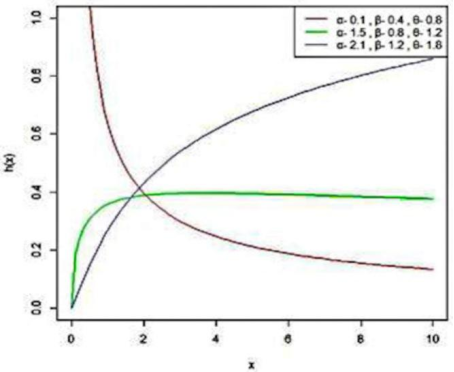
This article introduces a new exponentiated distribution called the Siya Distribution by incorporating a new parameter into the existing two-parameter Gamma distribution. It is a versatile three-parameter model designed to capture various data behaviors encountered in biological and environmental studies. Siya distribution accounts for data that exhibit variable degrees of skewness and kurtosis, making it suitable for complex datasets such as medical measurements, reliability analysis, and survival times. We derive fundamental properties including the probability density function (PDF), moments, the cumulative distribution function (CDF), and moment generating function (MGF), along with the hazard function to allow comprehensive analytical exploration of the distribution’s behavior. Parameter estimation is conducted using Maximum Likelihood Estimation (MLE), providing robust estimators for real-world applications. Model performance is evaluated using two real datasets against three alternative existing parameter distributions using the Akaike Information Criterion (AIC), Corrected AIC (AICc), and Bayesian Information Criterion (BIC), demonstrating that the Siya Distribution consistently achieves a superior fit, especially with highly skewed data. Empirical applications to biological and medical data illustrate the model’s adaptability and potential to improve data representation in fields requiring precise distribution modelling. The Exponentiated Siya distribution thus offers a significant tool for advanced statistical analyses in applied sciences, supporting more accurate and nuanced interpretation of complex data trends.
| Published in | International Journal of Statistical Distributions and Applications (Volume 11, Issue 1) |
| DOI | 10.11648/j.ijsda.20251001.12 |
| Page(s) | 11-19 |
| Creative Commons |
This is an Open Access article, distributed under the terms of the Creative Commons Attribution 4.0 International License (http://creativecommons.org/licenses/by/4.0/), which permits unrestricted use, distribution and reproduction in any medium or format, provided the original work is properly cited. |
| Copyright |
Copyright © The Author(s), 2025. Published by Science Publishing Group |
Exponentiated, General Gamma Distribution, Incomplete Gamma, Poly Gamma, Di-Gamma Distributions, Maximum Likelihood Estimation
90 | 78 | 72 | 80 | 84 | 70 | 88 | 84 | 78 | 80 | 78 | 72 | 84 | 84 |
70 | 78 | 84 | 98 | 76 | 84 | 84 | 80 | 80 | 78 | 76 | 84 | 82 | 88 |
80 | 74 | 70 | 80 | 80 | 76 | 80 | 82 | 74 | 60 | 80 | 70 | 80 | |
64 | 82 | 82 | 74 | 76 | 80 | 82 | 78 | 82 | 80 | 86 | 78 | 72 | |
80 | 78 | 74 | 76 | 86 | 84 | 78 | 78 | 78 | 72 | 72 | 78 | 74 | |
98 | 80 | 82 | 84 | 90 | 86 | 82 | 72 | 76 | 76 | 80 | 80 | 80 | |
82 | 84 | 78 | 80 | 84 | 88 | 84 | 80 | 78 | 82 | 86 | 84 | 68 | |
70 | 84 | 80 | 78 | 88 | 86 | 76 | 82 | 84 | 84 | 70 | 82 | 88 | |
84 | 80 | 78 | 74 | 70 | 74 | 80 | 60 | 84 | 96 | 86 | 112 | 86 | |
72 | 74 | 82 | 80 | 98 | 86 | 84 | 84 | 78 | 86 | 80 | 80 | 74 | |
88 | 84 | 84 | 80 | 84 | 80 | 80 | 72 | 84 | 88 | 80 | 86 | 76 | |
80 | 80 | 86 | 88 | 76 | 84 | 80 | 92 | 84 | 84 | 84 | 72 | 82 | |
80 | 78 | 84 | 86 | 80 | 80 | 88 | 98 | 86 | 78 | 78 | 80 | 84 | |
82 | 80 | 78 | 86 | 74 | 78 | 78 | 80 | 84 | 84 | 82 | 78 | 86 |
Models | MLE | S. E | -2Log L | AIC | BIC | AICc |
|---|---|---|---|---|---|---|
Exponentiated Siya |
|
0.4701 8.6905 | 1335.7495 | 1341.7495 | 1351.6445 | 1341.872 |
3-parameter Weibull |
3.5454 57.2204 |
0.2804 1.5055 | 1351.6555 | 1357.6555 | 1367.5505 | 1357.7780 |
Power gamma |
1.7798 0.0102 |
0.026 0.001 | 1361.4773 | 1367.4773 | 1377.3722 | 1367.5997 |
3-parameter generalised Lindley |
32.6255 1.1478 |
679.6864 0.1153 | 1385.7188 | 1391.7188 | 1401.6138 | 1391.8413 |
Exponentiated gamma exponential |
3.6012 3.6999 |
42.0219 43.1322 | 1436.6794 | 1442.6794 | 1452.5743 | 1442.8018 |
Exponentiated Lomax distribution |
0.0064 10.536 |
46.04 0.5507 | 1674.3437 | 1680.3437 | 1690.2387 | 1680.4662 |
38.3 | 37.7 | 33.5 | 39.1 | 33.5 | 31.9 | 38.3 | 32.8 | 32.5 | 41.8 | 31.5 |
27.2 | 38.8 | 44.8 | 36.6 | 37 | 37 | 25 | 34.9 | 29 | 29.5 | 35.1 |
39 | 33.2 | 38.1 | 34.2 | 41.6 | 44.5 | 27.5 | 38.5 | 32.2 | 35 | 25.9 |
39.5 | 36.6 | 40.3 | 38.4 | 35.4 | 38.9 | 29.5 | 43.6 | 34.5 | 39.6 | 40.6 |
32.4 | 33.4 | 43.3 | 30.9 | 35.8 | 28.2 | 24.2 | 34.5 | 44.6 | 26.2 | 39.4 |
33 | 44.8 | 34.2 | 49.6 | 36.4 | 26.9 | 30.1 | 37.3 | 37.6 | 39.7 | 39.4 |
37.4 | 39.4 | 31.6 | 37.6 | 41.2 | 26.4 | 38.8 | 37.6 | 36.4 | 37.2 | 44 |
37.4 | 35.4 | 36.2 | 38.2 | 38.7 | 39.7 | 33 | 34.2 | 31.7 | 36.9 | 37.1 |
34.9 | 35.7 | 38.4 | 42.3 | 35.2 | 38.3 | 34.6 | 31.5 | 33.8 | 30.1 | 41.5 |
33.5 | 33.7 | 30.1 | 35.7 | 35.3 | 37.7 | 33.3 | 27.5 | 34.3 | 40.8 | 40.3 |
33 | 37.3 | 34.4 | 35.5 | 37.8 | 34 | 28.4 | 36.8 | 35.2 | 43.2 | |
42.8 | 35 | 29.7 | 35.6 | 36.1 | 31.9 | 40.8 | 33.06 | 35 | 37.1 | |
36.3 | 35.2 | 36 | 38 | 42.2 | 36 | 35.4 | 27.2 | 34 | 35.2 | |
34.9 | 31.9 | 42.9 | 37.3 | 47.6 | 33.4 | 35.4 | 34 | 37.8 | 41.7 |
Models | MLE | S. E | -2Log L | AIC | BIC | AICc |
|---|---|---|---|---|---|---|
Exponentiated Siya |
3.3176 21.5493 |
01.5549 11.3877 | 883.4203 | 889.4203 | 898.4522 | 889.5847 |
3Parameter Weibull |
3.6972 20.4877 |
0.6265 2.364 | 883.9458 | 889.9458 | 898.9777 | 890.1102 |
Power Gamma |
1.4276 0.1763 |
0.2783 0.2434 | 885.0009 | 891.0009 | 900.0328 | 891.1653 |
Exponentiated Gamma Exponential |
0.837 1.3804 |
3.4213 5.6531 | 885.8165 | 891.8165 | 900.8484 | 891.9809 |
Exponentiated Lomax |
0.0075 18.8011 |
0.00005 1.3278 | 1007.4598 | 1013.4598 | 1022.4917 | 1013.6242 |
AIC | Akaike Information Criterion |
AICc | Corrected Akaike Information Criterion |
BIC | Bayesian Information Criterion |
CDF | Cumulative Distribution Function |
Probability Density Function | |
MGF | Moment Generating Function |
MLE | Maximum Likelihood Estimation |
SE | Standard Error |
| [1] | Faisal Muhammad Amiru et.al (2025) The Additive Dhillon-Chen Distribution: Properties and Application to failure time data International Journal of Statistical Distribution and Applications, |
| [2] | Rajagopalan, V. P. Soumya & Rashid a Gunaie (2021) A new Exponentiated Two parameter distribution with Biometric Application. October 2021 International Journal of Engineering and Management Research 06(10): 56-65. |
| [3] | Muhammed Adamu Umar and Waheed Babatunde (2021) A New Exponential Gamma Distribution with Application. Journal of Modern Applied Statistical Methods. |
| [4] | Thomas, P. Yageen and Jose, Jitto (2021). Weibull-Burr impounded bivariate distribution. Japanese Journal of Statistics and Data Science, 4(1): 73-105. |
| [5] | Thomas, P. Yageen and Jose, Jitto (2020). A new bivariate distribution with Rayleigh and Lindley distributions as marginals Journal of Statistical Theory and Practice. 14 Article ID 28. |
| [6] | C Subramanian & Aafaq A Rather (2019). Exponentiated Power Distribution: Properties and Estimation. Science, Technology and Development, Volume VIII issue 2019 September. |
| [7] | Rama Shanker, et al A three-parameter Lindley distribution (2017). American Journal of Mathematics and Statistics. 7(1): 15-26. |
| [8] | Amal Soliman Hassan and Marwa Abdallah (2017) Exponentiated Lomax Geometric distribution properties and Application. Pakistan Journal of Statistics and Operational Research. |
| [9] | Manish Pal and Montip Jiensuwan (2015) Exponentiated Transmuted modified Weibul Distribution. European journal of Pure and Applied Mathematics. Volume 8 No.1 (2015). |
| [10] | Rama Shanker (2015) Akash Distribution and Its Application. International Journal of Probability and Statistics. |
| [11] | Rashid A Ganaie, V Rajagopalan and Saeed Aldulaimi. The Weighted Power Shanker Distribution with Characterisations and Applications of Real Lifetime Data. Journal of Statistical Application & Probability. |
| [12] | I. Shawky and R. A. Bakoban. Exponentiated Gamma distribution: Different methods of Estimations”. Journal of Applied Mathematics. Volume2012. |
| [13] | Amal Soliman Hassan (2017) Exponentiated Lomax Geometric Distribution-Its properties and application. Pakistan Journal of Statistics and Operation Research. |
| [14] | Surya Jabeen & Bilal Para (2018) Exponentiated Gamma Exponential Distribution. Sohag Journal of Mathematics. |
| [15] | Nosakhare Ekhosuchi (2018) A Three parameter Generalised Lindly Distribution - Properties and Application. STATISTICA, anno LXXVIII n 3, 2018. |
APA Style
Raj, S. C., Vijayakumar, M. (2025). A New Exponentiated Siya Distribution and Its Biomedical Application. International Journal of Statistical Distributions and Applications, 11(1), 11-19. https://doi.org/10.11648/j.ijsda.20251001.12
ACS Style
Raj, S. C.; Vijayakumar, M. A New Exponentiated Siya Distribution and Its Biomedical Application. Int. J. Stat. Distrib. Appl. 2025, 11(1), 11-19. doi: 10.11648/j.ijsda.20251001.12
@article{10.11648/j.ijsda.20251001.12,
  author = {Shiny Chulliparambil Raj and Mani Vijayakumar},
  title = {A New Exponentiated Siya Distribution and Its Biomedical Application
},
  journal = {International Journal of Statistical Distributions and Applications},
  volume = {11},
  number = {1},
  pages = {11-19},
  doi = {10.11648/j.ijsda.20251001.12},
  url = {https://doi.org/10.11648/j.ijsda.20251001.12},
  eprint = {https://article.sciencepublishinggroup.com/pdf/10.11648.j.ijsda.20251001.12},
  abstract = {This article introduces a new exponentiated distribution called the Siya Distribution by incorporating a new parameter into the existing two-parameter Gamma distribution. It is a versatile three-parameter model designed to capture various data behaviors encountered in biological and environmental studies. Siya distribution accounts for data that exhibit variable degrees of skewness and kurtosis, making it suitable for complex datasets such as medical measurements, reliability analysis, and survival times. We derive fundamental properties including the probability density function (PDF), moments, the cumulative distribution function (CDF), and moment generating function (MGF), along with the hazard function to allow comprehensive analytical exploration of the distribution’s behavior. Parameter estimation is conducted using Maximum Likelihood Estimation (MLE), providing robust estimators for real-world applications. Model performance is evaluated using two real datasets against three alternative existing parameter distributions using the Akaike Information Criterion (AIC), Corrected AIC (AICc), and Bayesian Information Criterion (BIC), demonstrating that the Siya Distribution consistently achieves a superior fit, especially with highly skewed data. Empirical applications to biological and medical data illustrate the model’s adaptability and potential to improve data representation in fields requiring precise distribution modelling. The Exponentiated Siya distribution thus offers a significant tool for advanced statistical analyses in applied sciences, supporting more accurate and nuanced interpretation of complex data trends.
},
 year = {2025}
}
TY  - JOUR
T1  - A New Exponentiated Siya Distribution and Its Biomedical Application

AU  - Shiny Chulliparambil Raj
AU  - Mani Vijayakumar
Y1  - 2025/03/13
PY  - 2025
N1  - https://doi.org/10.11648/j.ijsda.20251001.12
DO  - 10.11648/j.ijsda.20251001.12
T2  - International Journal of Statistical Distributions and Applications
JF  - International Journal of Statistical Distributions and Applications
JO  - International Journal of Statistical Distributions and Applications
SP  - 11
EP  - 19
PB  - Science Publishing Group
SN  - 2472-3509
UR  - https://doi.org/10.11648/j.ijsda.20251001.12
AB  - This article introduces a new exponentiated distribution called the Siya Distribution by incorporating a new parameter into the existing two-parameter Gamma distribution. It is a versatile three-parameter model designed to capture various data behaviors encountered in biological and environmental studies. Siya distribution accounts for data that exhibit variable degrees of skewness and kurtosis, making it suitable for complex datasets such as medical measurements, reliability analysis, and survival times. We derive fundamental properties including the probability density function (PDF), moments, the cumulative distribution function (CDF), and moment generating function (MGF), along with the hazard function to allow comprehensive analytical exploration of the distribution’s behavior. Parameter estimation is conducted using Maximum Likelihood Estimation (MLE), providing robust estimators for real-world applications. Model performance is evaluated using two real datasets against three alternative existing parameter distributions using the Akaike Information Criterion (AIC), Corrected AIC (AICc), and Bayesian Information Criterion (BIC), demonstrating that the Siya Distribution consistently achieves a superior fit, especially with highly skewed data. Empirical applications to biological and medical data illustrate the model’s adaptability and potential to improve data representation in fields requiring precise distribution modelling. The Exponentiated Siya distribution thus offers a significant tool for advanced statistical analyses in applied sciences, supporting more accurate and nuanced interpretation of complex data trends.

VL  - 11
IS  - 1
ER  -
Department of Statistics, Annamalai University, Annamalai Nagar, Tamil Nadu, India
Department of Statistics, Annamalai University, Annamalai Nagar, Tamil Nadu, India
Information