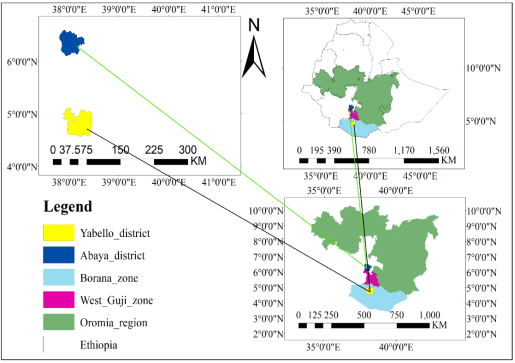
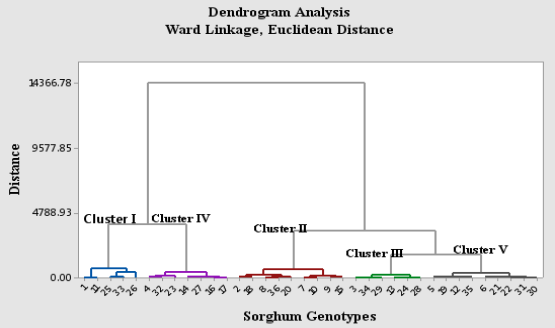
Sorghum is a critical crop especially in areas where there is inadequate moisture. Globally it is the 5th most important crop among the cereals and 2nd in ‘injera’ making next to ‘tef’ in Ethiopia. Genetic variation within crop genotypes has a greater contribution to do selection and important for identification of the well-performed genotypes for further breeding programs. The experiment was conducted at Yabello and Abaya, Southern Oromia, Ethiopia, during 2022 main cropping season using a total of 36 lowland sorghum genotypes. Simple lattice design 6x6 with two replications at both location was used to test the genetic variability between tested genotypes among traits considered. Data were recorded and analyzed for fourteen quantitative and three qualitative traits to test variability and select suitable genotypes. Results showed considerable amount of variation among genotypes in the studied traits. The outcome of the pooled data across locations showed that the genotypes with higher grain yield (kgha-1) are G26 (4994.2) followed by G33 (4707.6), G25 (4609.8), G11 (4395.1) and G1 (4385.1). Tested genotypes was grouped into five distinct classes. Therefore, better performed genotypes should be advanced to regional variety trial (RVT) to be repeated and finally to be released as new varieties.
| Published in | International Journal of Photochemistry and Photobiology (Volume 7, Issue 2) |
| DOI | 10.11648/j.ijpp.20250702.11 |
| Page(s) | 40-51 |
| Creative Commons |
This is an Open Access article, distributed under the terms of the Creative Commons Attribution 4.0 International License (http://creativecommons.org/licenses/by/4.0/), which permits unrestricted use, distribution and reproduction in any medium or format, provided the original work is properly cited. |
| Copyright |
Copyright © The Author(s), 2025. Published by Science Publishing Group |
Cluster, Multivariate, Sorghum, Genetic Distance
G-code | Genotype | Pedigree | G-code | Genotype | Pedigree |
|---|---|---|---|---|---|
G-1 | ETSC17213-3-2 | IESV92084/E36-1/Melkam | G-19 | ETSC17268-7-1 | MR812/B35/Gambella1107 |
G-2 | ETSC17023-14-1 | 90BK4184/85MW5552/NTJ2 | G-20 | ETSC17354-12-1 | WSV387/P-9403/ETSL101857 |
G-3 | ETSC16032-4-1 | 05MW6073/M-204 | G-21 | ETSC16006-3-1 | 14MWLSDT7324/ICSTG2372 |
G-4 | ETSC15363-1-2 | S35/Gambella1107 | G-22 | ETSC14695-1-2 | Debir/13sudanint#27 |
G-5 | ETSC17300-4-2 | PGRCE6940/SAR24/SRN39 | G-23 | ETSC17298-4-1 | PGRCE6940/SAR24/ETSL101848 |
G-6 | ETSC17328-8-1 | 90BK4184/85MW5552/SRN39 | G-24 | ETSC17354-12-1 | WSV387/P-9403/ETSL101857 |
G-7 | ETSC16091-10-1 | 235421/M-204 | G-25 | ETSC17321-11-1 | ((148/E-35-1)-4/CS3541derive5-4-2-1)/P9401/ETSL101865 |
G-8 | ETSC17115-5-1 | WSV387/P9403/E-36-1/ETSL102496 | G-26 | ETSC15385-2-2 | WSV387/P9405/Meko-1 |
G-9 | ETSC17007-9-1 | PGRCE6940/SAR24/Framida | G-27 | ETSC14804-4-2 | SILA/13sudanint#10-1 |
G-10 | ETSC17257-6-1 | ICSR24010/B35/ETSL101857 | G-28 | ETSC15312-3-1 | Debir/(Hodem/Gobiye) |
G-11 | ETSC17354-9-1 | WSV387/P-9403/ETSL101857 | G-29 | ETSC16006-3-1 | 14MWLSDT7324/ICSTG2372 |
G-12 | ETSC17142-9-3 | WSV387/P9403/B35/ETSL100307 | G-30 | ETSC17115-5-1 | WSV387/P9403/E-36-1/ETSL102496 |
G-13 | ETSC17298-5-2 | PGRCE6940/SAR24/ETSL101848 | G-31 | ETSC15437-2-2 | 14MILSDT7086/Gambella1107 |
G-14 | ETSC17360-18-2 | WSV387/P-9403/ETSL101853 | G-32 | Argiti | Argiti |
G-15 | ETSC172963-1 | PGRCE6940/SAR24/Gambella1107 | G-33 | ETSC17111-3-1 | WSV387/P9403/E-36-1/NTJ2 |
G-16 | ETSC17032-6-1 | 90BK4236/87PW3173/ETSL101857 | G-34 | ETSC17142-9-3 | WSV387/P9403/B35/ETSL100307 |
G-17 | ETSC17073-6-2 | ((148/E-35-1)-4/CS3541derive5-4-2-1)/P9401/SRN39 | G-35 | Melkam | Melkam |
G-18 | ETSC17156-1-4 | MR812/76T1#23/ETSL101865 | G-36 | Dekeba | Dekeba |
Source of Variation | Degree of freedom | Sum squares | Mean squares |
|---|---|---|---|
Location (L) | L-1 | SSL | MSL |
Replication with in location | (r-1)L | SSr | MSr |
Blocks within replication (b) | rL (b-1) | SSb | MSb |
Genotype (g) | g-1 | SSg | MSg |
G x L interaction (i) | (g-1) (L-1) | SSgxL | MSgxL |
Error (e) | L (b-1)(rb-b-1) | SSe | MSe |
Total | Lrb2-1 | Toss |
Source | Genotype (df=35) | Location (df=1) | Gen* Loc (df= 35) | Rep (df=1) | Block (Rep*loc) (df=20) | Lattice error (df=61) | RCBD error (df=70) | R.E% | CV% | R2% |
|---|---|---|---|---|---|---|---|---|---|---|
DF | 14.38*** | 217.56*** | 6.87** | 8.51ns | 6.75* | 3.77 | 3.85 | 102.12 | 3.33 | 85.00 |
DM | 82.92*** | 1653.78** | 16.79** | 11.11ns | 9.88* | 5.25 | 5.45 | 103.81 | 2.44 | 95.32 |
GFP | 53.30*** | 671.67*** | 1287* | 39.06* | 8.83ns | 6.35 | 6.67 | 105.04 | 7.11 | 91.00 |
PH | 294.44*** | 17257.20*** | 100.03** | 103.36ns | 101.57** | 36.58 | 51.26 | 140.13 | 3.70 | 95.00 |
PL | 8.66*** | 9.15* | 5.45*** | 0.08ns | 4.95** | 1.95 | 2.19 | 112.31 | 6.47 | 86.00 |
PW | 4.4*** | 725.72*** | 4.1* | 38.16* | 5.22** | 1.83 | 2.19 | 119.67 | 12.80 | 93.05 |
PE | 2.71** | 136.56** | 1.22ns | 4.49* | 1.88** | 0.80 | 0.99 | 123.75 | 10.23 | 89.20 |
TN | 0.24*** | 1.00*** | 0.06** | 0.00ns | 0.03ns | 0.02 | 0.02 | 100 | 15.23 | 91.68 |
HW | 4608.72*** | 19969.20*** | 1203.73* | 6.74ns | 720.51ns | 633.25 | 627.50 | 99.10 | 10.90 | 88.28 |
GYPP | 5585.51*** | 32347.54*** | 740.18* | 84.62 | 627.11ns | 269.46 | 358.81 | 133.16 | 16.54 | 93.6 |
BY | 68.71*** | 2127.3*** | 11.63* | 0.99ns | 9.69ns | 6.09 | 6.94 | 113.96 | 11.72 | 94.00 |
TSW | 27.26*** | 0.74ns | 0.71ns | 2.7ns | 3.51ns | 2.33 | 2.63 | 112.88 | 5.10 | 90.00 |
GY | 1994871.82*** | 8227459.4*** | 158440.8*** | 147752* | 74571.36* | 30244.38 | 34538.33 | 114.2 | 5.33 | 98.00 |
HI | 9.08* | 451.01*** | 10.67** | 7.11 | 6.2ns | 4.4 | 4.88 | 110.91 | 13.08 | 85.38 |
Recorded Traits | Clusters | |||||
|---|---|---|---|---|---|---|
I | II | III | IV | V | Grand Mean | |
Days to flowering | 59.35 | 57.22 | 57.63 | 59.76 | 58.47 | 58.39 |
Days to maturity | 98.85 | 88.92 | 93.83 | 96.80 | 93.61 | 93.82 |
Grain filling period | 39.60 | 31.69 | 36.21 | 37.04 | 35.14 | 35.44 |
Plant height | 169.93 | 156.69 | 164 | 169.07 | 161.71 | 163.41 |
Panicle length | 23.36 | 20.50 | 21.43 | 22.12 | 21.47 | 21.61 |
Panicle width | 12.13 | 9.82 | 10.35 | 10.92 | 10.37 | 10.58 |
Panicle exertion | 8.54 | 8.72 | 8.82 | 9.17 | 8.6 | 8.77 |
Tiller number | 1.13 | 0.85 | 1.03 | 1.09 | 0.88 | 0.97 |
Head weight | 286.36 | 194.22 | 231.54 | 244.68 | 225.5 | 230.87 |
Grain yield per panicle | 184.6 | 80.18 | 109.03 | 139.88 | 100.54 | 116.19 |
Biomass yield | 28.79 | 17.27 | 20.53 | 23.17 | 19.21 | 21.04 |
Thousand seed weight | 34.26 | 28.22 | 28.64 | 32.53 | 28.17 | 29.96 |
Grain yield per hectare | 4618.36 | 2542.09 | 3180.05 | 3769.76 | 2882.92 | 3260.71 |
Harvest index | 16.90 | 15.22 | 16.04 | 17.01 | 15.58 | 16.03 |
Cluster | I | II | III | IV | V |
|---|---|---|---|---|---|
I | 182.12 | ||||
II | 2081.06** | 104.51 | |||
III | 1441.40** | 639.79** | 38.05 | ||
IV | 580.83** | 1230.28** | 590.71** | 85.32 | |
V | 1738.61** | 342.97** | 297.33** | 887.97** | 56.99 |
Characters | PC1 | PC2 | PC3 |
|---|---|---|---|
Days to flowering | 0.197 | 0.110 | -0.230 |
Days to maturity | 0.315 | 0.047 | -0.277 |
Grain filling period | 0.292 | -0.00 | -0.218 |
Plant height | 0.273 | 0.170 | -0.291 |
Panicle length | 0.228 | -0.207 | 0.244 |
Panicle width | 0.251 | 0.069 | 0.222 |
Panicle exertion | 0.035 | 0.735 | 0.022 |
Tiller number | 0.200 | 0.534 | 0.122 |
Head weight | 0.314 | -0.162 | 0.023 |
Grain yield per panicle | 0.335 | -0.149 | 0.092 |
Biological yield | 0.334 | -0.137 | -0.147 |
Thousand seed weight | 0.305 | -0.060 | 0.031 |
Grain yield per hectare | 0.344 | -0.084 | 0.169 |
Harvest index | 0.111 | 0.074 | 0.744 |
Eigen value | 7.572 | 1.438 | 1.326 |
% of total variation explained | 0.541 | 0.103 | 0.095 |
Cumulative% of total variation explained | 0.541 | 0.644 | 0.738 |
Recorded traits | Phenotypic Class | Frequency | Percent | H’ |
|---|---|---|---|---|
Seed Color | Very white | 12.00 | 33.33 | 0.34 |
White | 19.00 | 52.78 | 0.31 | |
Light red | 5.00 | 13.89 | 0.25 | |
Panicle form | Loose | 5.00 | 13.89 | 0.25 |
Fairly loose | 20.00 | 55.56 | 0.30 | |
Compacted | 11.00 | 30.56 | 0.33 | |
Glume cover | Quarter covered | 17.00 | 47.22 | 0.32 |
Half-covered | 13.00 | 36.11 | 0.34 | |
75% seed covered | 6.00 | 16.67 | 0.27 |
OARI | Oromia Agricultural Research Inistiutue |
FAO | Food and Agricultural Organization of the United Nations |
YPDARC | Yabello Pastoral and Dryland Agriculture Researchn Center |
CSA | Central Statistical Agency |
FAO | Food and Agricultural Organization of the United Nations |
| [1] | Olani Nagara. 2017. Genetic Diversity Analysis of Sorghum [Sorghum bicolor (L.) Moench] Races in Ethiopia Using SSR Markers. |
| [2] | Asfaw Adugna. 2014. Analysis of in situ diversity and population structure in Ethiopian cultivated Sorghum bicolor landraces using phenotypic traits and SSR markers. Springer Plus. 3(1): 212. |
| [3] | Vavilov NI. 1951. The origin, variation, immunity and breeding of cultivated plants 72; 482. |
| [4] | Doggett, H. 1988. Sorghum, 2nd ed. – Longman. |
| [5] | Taye Tadesse, Emma S. Mace, Ian D. Godwin, David R. Jordan. 2016. Heterosis in locally adapted sorghum genotypes and potential of hybrids for increased productivity in contrasting environments in Ethiopia. The University of Queensland, Department of Agriculture and Fisheries, Hermitage Research Facility, 604 Yangan Rd, Warwick, QLD, 4370, Australia. |
| [6] | Schütz, H. J. M.; Verhoff, M. A. 2011. How to Feed the World in 2050. Arch. Kriminol. (228): Pp. 151–159. |
| [7] | Fracasso, Alessandra, TrindadeLuisa M. and Amaducci Stefano. 2016. Drought stress tolerance strategies revealed by RNA-Seq in two sorghum genotypes with 54 contrasting WUE‟, BMC Plant Biology. BMC Plant Biology, 16(115); Pp. 1-18. |
| [8] | Central Statistical Agency (CSA). 2020/21. Agricultural Sample Survey report on Area and Production of Major Crops (Private Peasant Holdings ‘Meher’ Season): The FDRE Statistical Bulletin 585. Addis Ababa, Ethiopia. |
| [9] | Food and Agricultural Organization of the United Nations (FAO). 2020. Food and Agriculture Organization of the United Nations Database of agricultural production. |
| [10] | Fisha W., Gashaw A., Mamo M., Gebre-Mariam T., & Assefa S. 2016. Response of sorghum genotypes in moisture stressed areas of eastern Amhara, Ethiopia. In Proceeding. 4th National Annual Research Conference A. Dejen, R. Hassan, & A. Tessema (Eds.). Pp. 18–24. |
| [11] | Aminon I, D Yêyinou Loko L, Adjatin A, Ewédjè BK, Dansi A, Rakshit S, Cissé N, Vishnu Patil J, Agbangla C, Sanni A, Akoègninou A, Akpagana K 2015. Genetic Divergence in Northern Benin sorghum (Sorghum bicolor (L.) Moench) landraces as revealed by agro-morphological traits and selection of candidate genotypes. The Scientific World Journal. 1-10. |
| [12] | Girma Mengistu, Hussein Shimelis, Mark Laing, Dagnachew Lule, and Isack Mathew. 2020. "Genetic variability among Ethiopian sorghum landrace accessions for major agro-morphological traits and anthracnose resistance." Euphytica, 16(7); Pp. 1-15. |
| [13] | Kassahun Tesfaye. 2017. Genetic diversity study of sorghum [Sorghum bicolor (L.) Moench] genotypes, Ethiopia. Acta Universitatis Sapientiae Agriculture and Environment, (9); p 4454. |
| [14] | Yagdi K (2009). Path coefficient analysis of some yield components in durum wheat (Triticum durum Desf). Pakistan Journal of Botany, 41(2): Pp. 745-751. |
| [15] | Cochran, W. G. and Cox, G. M. 1957. Experimental Design. 2nd Edition, John Wiley and Sons, New York, 615 p. |
| [16] | SAS Institute Inc. 2016. SAS /STAT users guide. Version 9.4, 4th edition. Cat, NC. |
| [17] | Muhammad Asif Masood, Khalid Farooq, Yaqub Mujahid and Muhammad Zubair. 2008. Improvement in Precision of Agricultural field Experiments through Design and analysis. Pakistan Journal of Life and Social Sciences, 6 (2): Pp. 89-91. |
| [18] | Gomez, K. A. and A. A. Gomez. 1984. Statistical Procedures for Agricultural Research, 2nd edit. John Wiley and Sons, New York. |
| [19] | Chaudhary, B. D., O. P. Luthra, and V. P. Singh. 1977. Studies on harvest index and related correlation in soybean and their implication in selection. Agronomy Journal, 47(51); Pp. 515-518. |
| [20] | Mahalanobis, P. C. 1936. On the generalized distance in statistics. Proceedings of the national instituite of science of india. (2); Pp. 49-55. |
| [21] | Hennink, S. and A. C. Zeven. 1991. The interpretation of Nei and Shannon–Weaver within. |
| [22] | Tafere Mulualem, Sintayehu Alamrew, Taye Tadesse and Dagne Wegary. 2018. Correlation and Path Coefficient Analysis for Agronomical Traits of Lowland Adapted Ethiopian Sorghum (Sorghum bicolor (L.) Genotypes. Greener Journal of Agricultural Sciences, (8): Pp. 155-159. |
| [23] | Kassahun Amare, Habtamu Zeleke and Geremew Bultosa. 2015. Variability for yield, yield related traits and association among traits of sorghum [Sorghum bicolor (L.) Moench] Varieties in Wollo, Ethiopia. Journal of Plant Breeding and Crop Science, 7(5); Pp. 125-133. |
| [24] | Chelachaw Endalemaw and Zigale Semahegn. 2020. "Genetic Variability and Yield Performance of Sorghum." International Journal of Advanced Biological and Biomedical Research, (2); Pp. 193-213. |
| [25] | Ganesamurthy, K., Punitha, D., and Elangovan, M. 2010. Genetic diversity among the landraces of sorghum collected in Tamil Nadu. Electronic Journal of Plant Breeding, 1(6): Pp. 1375-1379. |
| [26] | Swamy. 2018. Genetic diversity analysis for productivity traits in rabi sorghum [Sorghum bicolor (L.) Moench], Journal of Pharmacognosy and Phytochemistry, 7(5): Pp. 1780–1783. |
| [27] | Yitayeh, Z. S. 2019. The Genetic Improvement of Sorghum [sorghum bicolor (L.) Moench] in Ethiopia: Review, 9(3): Pp. 51–60. |
| [28] | Teshome A, Fahrig L, Torrance JK, Lambert JD, Arnason TJ, Baum BR. 1999. Maintenance of Sorghum [Sorghum bicolor (L.) Moench] Landrace Diversity by Farmers' Selection in Ethiopia. Economic Botany, 53(1): Pp. 79-88. |
| [29] | Gebrekidan B, Gebrehiwot B. 1982. Sorghum injera preparations and quality parameters. In: Proceedings of the International Symposium on Sorghum Grain Quality. Patancheru, AP, India. ICRISAT, Patancheru, AP India, Pp. 55- 66. |
| [30] | Ng'uni, D., Mulatu Geleta, M., Hofvander, P. 2012. Comparative genetic diversity and nutritional quality variation among some important southern African sorghum accessions [Sorghum bicolor (L.) Moench]. Australian Journal of Crop Science, 6(1): Pp. 56-64. |
| [31] | Seboka B, Van Hintum T. 2006. The dynamics of on-farm management of sorghum in Ethiopia: Implication for the conservation and improvement of plant genetic resources. Genetic Resource and Crop Evolution, 53(7): Pp. 1385-1403. |
| [32] | Shewayrga H, Jordan DR, Godwin ID. 2008. Genetic erosion and changes in distribution of sorghum [Sorghum bicolor (L.) Moench] landraces in North-Eastern Ethiopia. Plant Genetic Resources: Charact Util. 6(1): Pp. 1-10. |
APA Style
Edeo, B. (2025). Multivariate Analysis in Lowland Sorghum (Sorghum Bicolor L.) Genotypes for Major Traits at Yabelo and Abaya Districts, Southern Oromia, Ethiopia. International Journal of Photochemistry and Photobiology, 7(2), 40-51. https://doi.org/10.11648/j.ijpp.20250702.11
ACS Style
Edeo, B. Multivariate Analysis in Lowland Sorghum (Sorghum Bicolor L.) Genotypes for Major Traits at Yabelo and Abaya Districts, Southern Oromia, Ethiopia. Int. J. Photochem. Photobiol. 2025, 7(2), 40-51. doi: 10.11648/j.ijpp.20250702.11
@article{10.11648/j.ijpp.20250702.11,
  author = {Belda Edeo},
  title = {Multivariate Analysis in Lowland Sorghum (Sorghum Bicolor L.) Genotypes for Major Traits at Yabelo and Abaya Districts, Southern Oromia, Ethiopia
},
  journal = {International Journal of Photochemistry and Photobiology},
  volume = {7},
  number = {2},
  pages = {40-51},
  doi = {10.11648/j.ijpp.20250702.11},
  url = {https://doi.org/10.11648/j.ijpp.20250702.11},
  eprint = {https://article.sciencepublishinggroup.com/pdf/10.11648.j.ijpp.20250702.11},
  abstract = {Sorghum is a critical crop especially in areas where there is inadequate moisture. Globally it is the 5th most important crop among the cereals and 2nd in ‘injera’ making next to ‘tef’ in Ethiopia. Genetic variation within crop genotypes has a greater contribution to do selection and important for identification of the well-performed genotypes for further breeding programs. The experiment was conducted at Yabello and Abaya, Southern Oromia, Ethiopia, during 2022 main cropping season using a total of 36 lowland sorghum genotypes. Simple lattice design 6x6 with two replications at both location was used to test the genetic variability between tested genotypes among traits considered. Data were recorded and analyzed for fourteen quantitative and three qualitative traits to test variability and select suitable genotypes. Results showed considerable amount of variation among genotypes in the studied traits. The outcome of the pooled data across locations showed that the genotypes with higher grain yield (kgha-1) are G26 (4994.2) followed by G33 (4707.6), G25 (4609.8), G11 (4395.1) and G1 (4385.1). Tested genotypes was grouped into five distinct classes. Therefore, better performed genotypes should be advanced to regional variety trial (RVT) to be repeated and finally to be released as new varieties.},
 year = {2025}
}
TY  - JOUR
T1  - Multivariate Analysis in Lowland Sorghum (Sorghum Bicolor L.) Genotypes for Major Traits at Yabelo and Abaya Districts, Southern Oromia, Ethiopia

AU  - Belda Edeo
Y1  - 2025/07/10
PY  - 2025
N1  - https://doi.org/10.11648/j.ijpp.20250702.11
DO  - 10.11648/j.ijpp.20250702.11
T2  - International Journal of Photochemistry and Photobiology
JF  - International Journal of Photochemistry and Photobiology
JO  - International Journal of Photochemistry and Photobiology
SP  - 40
EP  - 51
PB  - Science Publishing Group
SN  - 2640-429X
UR  - https://doi.org/10.11648/j.ijpp.20250702.11
AB  - Sorghum is a critical crop especially in areas where there is inadequate moisture. Globally it is the 5th most important crop among the cereals and 2nd in ‘injera’ making next to ‘tef’ in Ethiopia. Genetic variation within crop genotypes has a greater contribution to do selection and important for identification of the well-performed genotypes for further breeding programs. The experiment was conducted at Yabello and Abaya, Southern Oromia, Ethiopia, during 2022 main cropping season using a total of 36 lowland sorghum genotypes. Simple lattice design 6x6 with two replications at both location was used to test the genetic variability between tested genotypes among traits considered. Data were recorded and analyzed for fourteen quantitative and three qualitative traits to test variability and select suitable genotypes. Results showed considerable amount of variation among genotypes in the studied traits. The outcome of the pooled data across locations showed that the genotypes with higher grain yield (kgha-1) are G26 (4994.2) followed by G33 (4707.6), G25 (4609.8), G11 (4395.1) and G1 (4385.1). Tested genotypes was grouped into five distinct classes. Therefore, better performed genotypes should be advanced to regional variety trial (RVT) to be repeated and finally to be released as new varieties.
VL  - 7
IS  - 2
ER  -
Oromia Agricultural Research Institute, Yabello Pastoral and Dryland Agricultural Research Center, Yabello, Ethiopia
Information