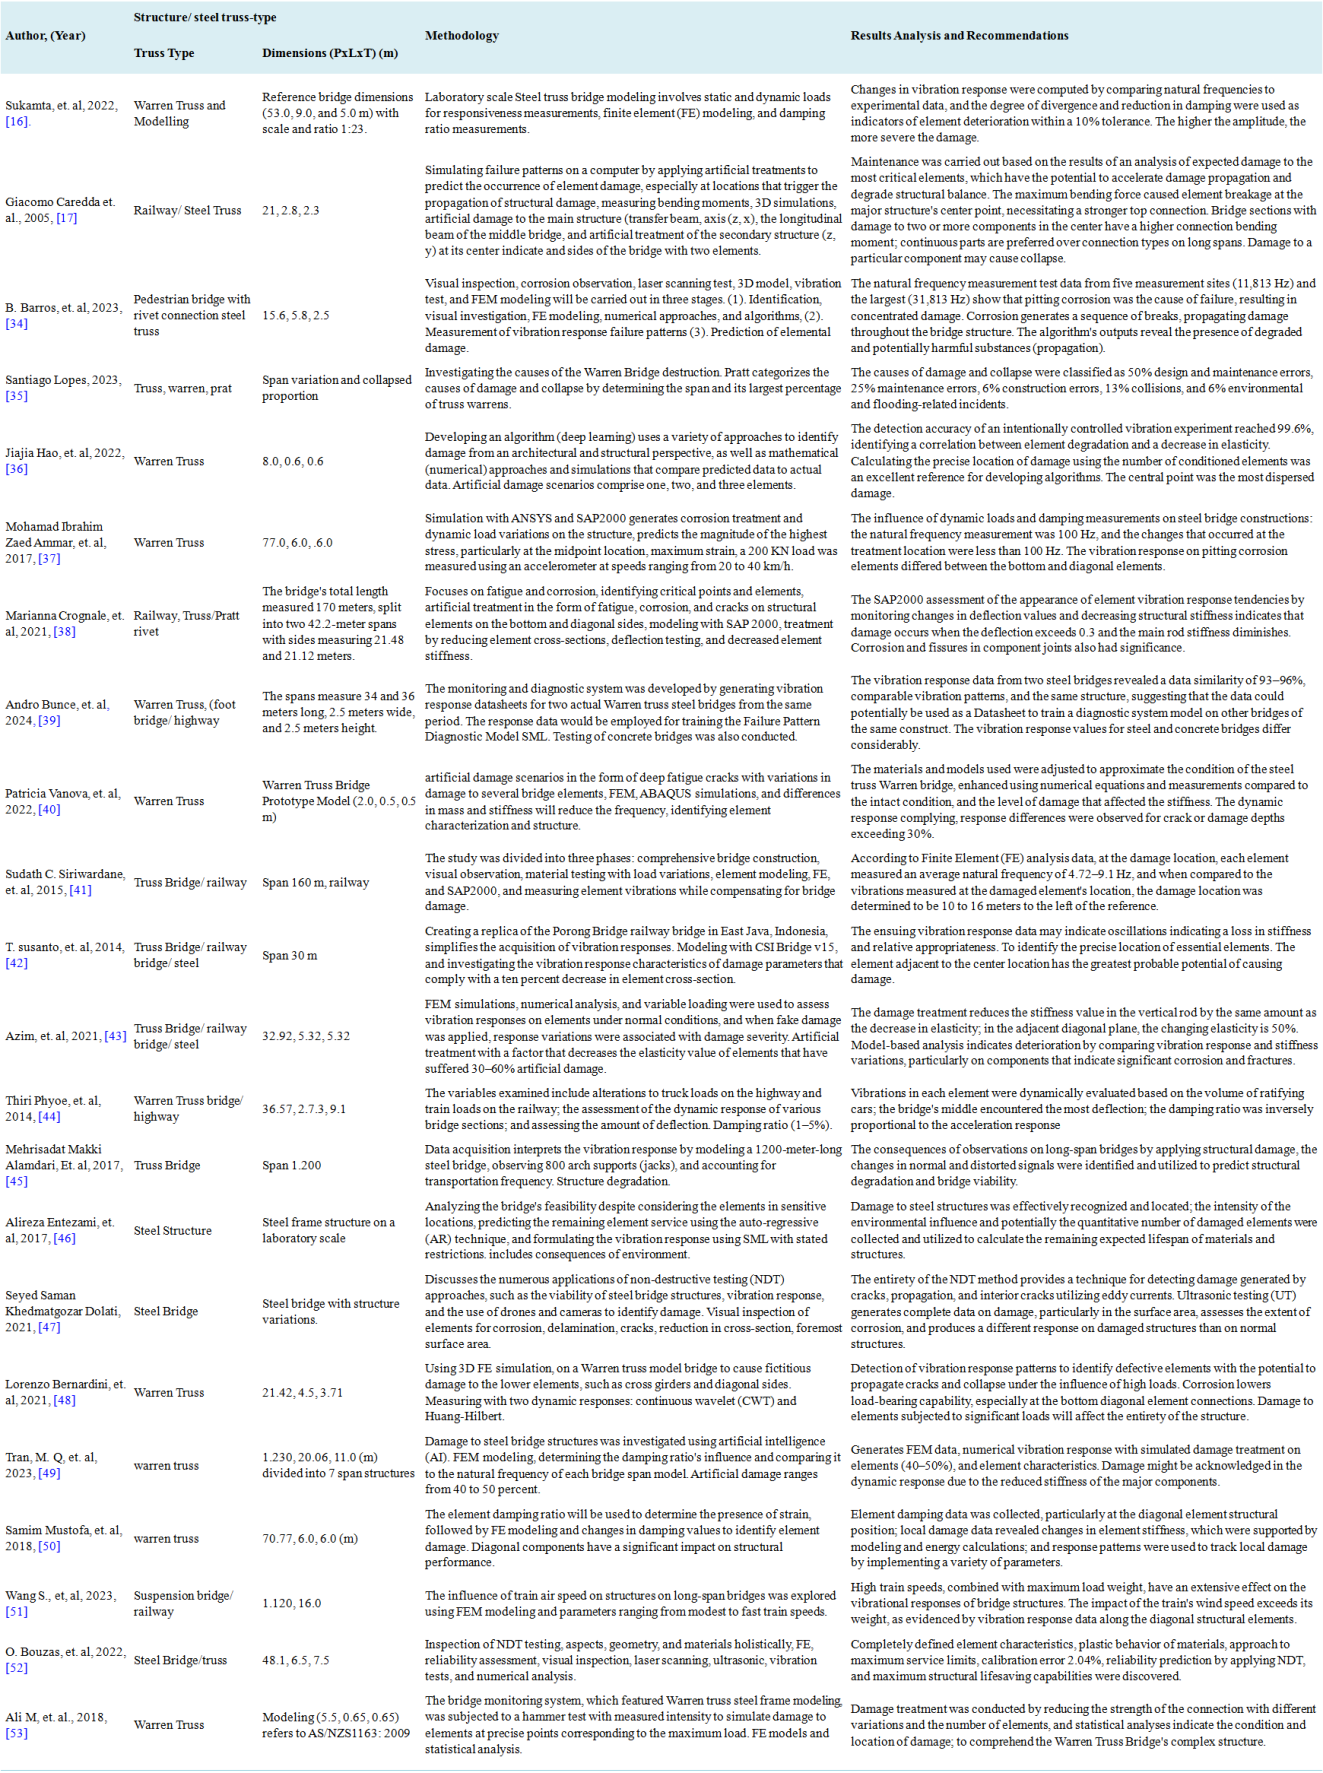
This article explores advancements in damage detection and structural diagnostics for steel bridges by proposing an integrated analysis method for failure patterns and structural feasibility validation. The approach incorporates the correlation between damage causes and vibrational data classified by intensity levels. Using a supervised machine learning framework, training datasets are developed by analyzing structural behavior identified through specific vibration characteristics, specifically examining the Warren Truss type. It explored a system that diagnosed failure sequences based on vibration-classified structures within the steel bridge frame. The system generated data on the feasibility conditions by analyzing the vibration characteristics of structural elements with varying levels of damage. This vibration classification could be used as a reference for structural maintenance and repair. Machine learning diagnosis involved investigating bridge collapses to identify the types of elements and their positions within the structure, with forecasts serving as the basis for interference detection. Identifying and classifying vibration patterns in bridge structures focuses on assessing their response to potential damage and dysfunctions to ensure their safety and long-term durability. This involves using vibration-based structural health monitoring (SHM) systems that detect anomalies or changes in the dynamic behavior of bridges. The primary objective is correlating specific vibration signatures with structural defects, such as fatigue cracks, material degradation, or connection failures. This assessment categorized structural degeneration into three levels: moderate (30%), urgent (50%), and severe/critical (≥70%). The findings of the assessment group informed the design of management strategies, technical maintenance plans, and overall structural performance improvements for Warren Truss Bridges. Factual values and ductility measurements were also considered. The study provided a more detailed summary of relevant research outcomes and the developmental stages of a recent vibration-based diagnostic system for future research.
| Published in | International Journal of Mechanical Engineering and Applications (Volume 13, Issue 1) |
| DOI | 10.11648/j.ijmea.20251301.11 |
| Page(s) | 1-26 |
| Creative Commons |
This is an Open Access article, distributed under the terms of the Creative Commons Attribution 4.0 International License (http://creativecommons.org/licenses/by/4.0/), which permits unrestricted use, distribution and reproduction in any medium or format, provided the original work is properly cited. |
| Copyright |
Copyright © The Author(s), 2025. Published by Science Publishing Group |
Fatigue Analysis, Machine Learning (ML), Warren Truss, Diagnostic, Structural Health Monitoring
Countries | Bridge Condition Criteria Level | Range Rating |
|---|---|---|
Indonesia | 0-5 bridge condition group | 5 |
Amerika (U.S) | 0-9 Eligibility condition cluster | 10 |
Korea | A-E Eligibility Condition Group | 5 |
China | CS 1- CS 5 Rating condition/Status | 5 |
Jepang | A,B,C,E1,E2,M,S Ratings | 6 |
Germany | 1= Very Good, 2 = Good, 3 = Satisfactory, 4= Poor, 5 = Very Poor | 5 |
Malaysia | 0-5 Rating condition/Status | 5 |
UK | 1-5 Damage Severity Condition, A to E, Increased level/rating | 5 |
Length (m) | Width (m) | Height (m) | Sidewalk (m) | Class |
|---|---|---|---|---|
55,30 | 7,0 | 5,0 | 1,0 | C |
Parameters | Mechanical Properties |
|---|---|
Density | 7.8 g/cm3 |
Modulus Young (Gpa) | 200 GPa |
Poission’sRatio | 0,3 |
Bulk Modulus | 166 GPa |
Shear Modulus | 76.9 GPa |
Tensile Yield Strength | 430 |
Tensile Ultimate Strength | 550 |
Parameters | No Fatik | 30% | 50% | 70% |
|---|---|---|---|---|
Modulus Young (Gpa) | 200 | 140 | 100 | 60 |
Poission’s Ratio | 0,3 | 0,3 | 0,3 | 0,3 |
Tensile Yield Strength (Mpa) | 430 | 301 | 215 | 129 |
Compressive Yield Strength (Mpa) | 430 | 301 | 215 | 129 |
Tensile Ultimate Strength (Mpa) | 550 | 385 | 275 | 165 |
SML | Supervised Machine Learning |
IoT | Internet of Things |
GPS | Global Positioning System |
GNSS | Global Navigations Satellite System |
FE | Finite Element |
FEM | Finite Element Method |
NDT | Non-Destructive Testing |
UT | Ultrasonic Testing |
CWT | Continuous Wavelet |
HHT | Huang-Hilbert |
AI | Artificial Intelligence |
SEM | Scanning Electron Microscopy |
XRF | X-Ray Fluorescence |
∆K | Fatigue Level of the Material |
W | The Element Specimen's Dimensions/Width |
a | Material Thickness |
B | Specimen Length |
α | The Typical Crack Length |
Vg | The Width of the Crack Opening |
P | Applied Load |
μ | Ductility |
δu | Crucial Deformation Near Collapse |
δy | Deformation at the Initial Melt |
| [1] | Kasano, H., and Yoda, T., Collapse Mechanism of I-35W Bridge in Minneapolis and Evaluation of Gusset Plate Adequacy. Doboku Gakkai Ronbunshuu, 2010, A 66 (2), pp. 312-323. |
| [2] | Miyachi, K., Nakamura, S., and Manda, A., Progressive Collapse Analysis of Steel Truss Bridges And Evaluation Of Ductility. Journal of Constructional Steel Research, 2012, 78, pp. 192-200. |
| [3] | Cook, W., and Barr, P. J., Observations and trends among collapsed bridges in New York State. Journal of Performance of Constructed Facilities, 2017, 31 (4). |
| [4] | R. K., Garg, S. Chandra, and A. Kumar, Analysis of bridge failures in India from 1977 to 2017, Struct. Infrastruct. Eng, 2017, 18 (3), pp. 295–312. |
| [5] | C. O., Yigit, M. Z., Coskun, H. Yavasoglu, A. Arslan, and Y. Kalkan, The potential of GPS precise point positioning method for point displacement monitoring: A case study, Measurement, 2016, vol 91, pp. 398-404. |
| [6] | Julien Lesouple, et. al., Multipath Mitigation for GNSS Positioning in an Urban Environment Using Sparse Estimation, IEEE Transactions on Intelligent Transportation Systems, 2019, 20 (4) pp. 1316-1328 |
| [7] | Yu, Jiayong, et. al, Global Navigation Satellite System-based Positioning Technology for structural health monitoring: A review. Structural Control and Health Monitoring, 2020, 27(1). |
| [8] | J., Paziewski, R., Sieradzki, and R., Baryla, Multi-GNSS high-rate RTK, PPP, and novel direct phase observation processing method: Application to precise dynamic displacement detection. Meas Sci. Technol, 2018, vol 29, no. 3, Art. no 035002. |
| [9] | Lee, G. C., et. al, A study of U S bridge failures (1980-2012), State University of New York at Buffalo, New York. 2013. |
| [10] | GUOJING ZHANG, et. al, Causes and statistical characteristics of bridge failures: A review. Journal of Traffic and Transportation Engineering (English Edition), 2022, Volume 9 Issue 3 Pages 388-406. |
| [11] | Sangiorgio V., Nettis A., UVA G., Pellegrino F., Varum H., and Adam J. M., Analytical Fault Tree and Diagnostic Aids for the Preservation of Historical Steel Truss Bridges. Eng Fail Anal, 2022, 133, 105996. |
| [12] | Buitrago M., Bertolesi E., Calder´on P. A., and Adam J. M., Robustness of steel truss bridges: laboratory testing of a full-scale 21-metre bridge span. Structures, 2021, 29, pp. 691–700. |
| [13] | Neves, A. C., Leander, J., González, I., and Karoumi, R., An approach to decision-making analysis for the implementation of structural health monitoring in bridges. Structural Control and Health Monitoring, 2019, 26, e2352. |
| [14] | Avci, O., et al., A review of vibration-based damage detection in civil structures: From traditional methods to Machine Learning and Deep Learning applications. Mechanical Systems and Signal Processing, 2021, 147, pp. 70-77. |
| [15] | Tchemodanova, S. P., et al., Fatigue assessment of complex structural components of steel bridges integrating finite element models and field-collected data. Engineering Structure, 2021, 234, p. 111996. |
| [16] | Sukamta, et al., Experimental Investigations of Truss Bridge Model Development for Vibration-Based Structural Health Monitoring. Lecture Notes in Civil Engineering, 2022 (LNCE, volume 215), pp. 137–153. |
| [17] | Lee, J. J., et al., Neural networks-based damage detection for bridges considering errors in baseline finite element models. Journal of Sound and Vibration, 2005, 280 (3-5), pp. 555-578. |
| [18] | Caredda, G., et al. (2022) Analysis of local failure scenarios to assess the robustness of steel truss-type bridges. Engineering Structures, 262, 114341. |
| [19] | Yang, Y. B. and Yang, J. P., State-of-the-art review on modal identification and damage detection of bridges by moving test vehicles. International Journal of Structural Stability and Dynamics, 2018, 18 (2), Art no 1850025. |
| [20] | Zhang, G., et al., Causes and statistical characteristics of bridge failures: A review. Journal of Traffic and Transportation Engineering, 2019, 9(3), pp. 388-406. |
| [21] | Liu M. M., Analysis of bridge accidents. Master thesis Southwest Jiaotong, University Chengdu, China. 2013. |
| [22] | Fu Z., et. al, Statistical analysis of the causes of the bridge collapse in China. In Forensic Engineering 2012: Gateway to a Safer Tomorrow. San Francisco. |
| [23] | Zhou, X., Yang, L., and Li, Q., Investigation of collapse of the Florida International University (FIU) pedestrian bridge. Engineering Structures, 2019. 200, p. 109733. |
| [24] | BIEZMA, M. V. and SCHANACK, F. (2007) Collapse of steel bridges. Journal of Performance of Constructed Facilities, 21 (5), pp. 398-405. |
| [25] | Daoyun Yuan, et. al, Fatigue Damage Evaluation Of Welded Joints In Steel Bridge Based On Meso-Damage Mechanics. International Journal of Fatigue, 2022, Volume 161, 106898. |
| [26] | Jyoti Bhandari, et. al, Modelling of pitting corrosion in marine and offshore steel structures – A technical review. Journal of Loss Prevention in the Process Industries, 2015, Volume 37, pp. 39-62. |
| [27] | Leitner, B., Bogenreiter, T., and Eberhart, F., Fatigue life prediction of mechanical structures under stochastic loading. MATEC Web of Conferences, 2018, 157, 04004. |
| [28] | Crognale, M., et al., Fatigue damage identification by a global-local integrated procedure for truss-like steel bridges. Structural Control and Health Monitoring, Hindawi, 2023, 23, Volume 2023. |
| [29] | Ha, M. G., et al., Corrosion environment monitoring of local structural members of a steel truss bridge under a marine environment. International Journal of Steel Structures, 2021, 21, pp. 167-177. |
| [30] | Eltouny, K., et. al, Unsupervised Learning Methods for Data-Driven Vibration-Based Structural Health Monitoring: A Review. Sensors, 2023, 23(6), 3290. |
| [31] | Sonbul, O. S., Rashid, M., Algorithms and Techniques for the Structural Health Monitoring of Bridges: Systematic Literature Review. Sensors 2023, 23(9), 4230; |
| [32] | Jing Jia, Ying Li, Deep Learning for Structural Health Monitoring: Data, Algorithms, Applications, Challenges, and Trends. Sensors (Basel), 2023, 23(21):8824. |
| [33] | Rosette N., et. al., Intelligent damage diagnosis in bridges using vibration-based monitoring approaches and machine learning: A systematic review. Results in Engineering, 2022, Volume 16. |
| [34] | B. Barros, et al., Design and testing of a decision tree algorithm for early failure detection in steel truss bridges. Engineering Structures, 2023, Vol. 289, 116243. |
| [35] | Lopez, S., Johnson, M., and Kim, Y., Learning from failure propagation in steel truss bridges. Engineering Failure Analysis, 2023, Volume 152, pp. 12-29. |
| [36] | Hao, J., et al., Damage localization and quantification of a truss bridge using PCA and convolutional neural network. Smart Structures and Systems, 2022, 30 (6), pp. 673-686. |
| [37] | Ammar, M. I. Z., et al., Effects of vibration located on the steel truss bridges under moving load. The 2nd International Conference on Civil Engineering Research (ICCER): Contribution of Civil Engineering toward Building Sustainable City, 2017. |
| [38] | Lachowicz, M. B., et al., Influence of Corrosion on Fatigue of the Fastening Bolts. Materials, 2021, 14(1485). |
| [39] | Bunce, A., et al., On population-based structural health monitoring for bridges: Comparing similarity metrics and dynamic responses between sets of bridges. Mechanical Systems and Signal Processing, 2024, 216, 111501. |
| [40] | Vanova, P., et al., Dynamic response analysis of a model truss bridge considering damage scenarios. Engineering Failure Analysis, 2023, 151, 107389. |
| [41] | Siriwardane, S. C., et al., Vibration measurement-based simple technique for damage detection of truss bridges: A case study. Engineering Failure Analysis, 2015, 4, pp. 50-58. |
| [42] | T. Susanto, et. al., Structural Damage Detection of A Steel-Truss Railway Bridge Using its Dynamic Characteristics. Journal of Proceeding Series, 2014, Vol. 1 ISSN: 2354-6026 pp 323. |
| [43] | Azim, M., Rehman, M. U., and Khan, A., Development of a Novel Damage Detection Framework for Truss Railway Bridges Using Operational Acceleration and Strain Response. Vibration, 2021, 4(2), pp. 422-443. |
| [44] | Phyoe, T., Wah, K. T. and Zaw, L. M., Vibration effect on steel truss bridge under moving loads. International journal of scientific engineering and technology research, 2014, 3 (14), pp. 3085-3090, ISSN 2319-8885. |
| [45] |
Alamdari, M. M., et al., A spectral-based clustering for structural health monitoring of the Sydney Harbour Bridge. Mechanical Systems and Signal Processing, 2017, 87 (A), pp. 384-400.
https://doi.org/ https://doi.org/10.1016/j.ymssp.2016.10.033 |
| [46] | Entezami, A., et al., An unsupervised learning approach by novel damage indices in structural health monitoring for damage localization and quantification. Structural Health Monitoring, 2017, pp. 1–21. |
| [47] | Dolati, K., et al., Non-Destructive Testing Applications for Steel Bridges. Applied Sciences, 2021, 11 (20), pp. 9757. |
| [48] | Bernardini L., Carnevale M., and Collina A., Damage Identificationin Warren Truss Bridges by Two Different Time–Frequency Algorithms. Appl. Sci., 2021, 11 10605. |
| [49] | Tran M. Q., et al., Structural Assessment Based on Vibration Measurement Test Combined with an Artificial Neural Network for the Steel Truss Bridge. Appl. Sci., 2023, 13 7484. |
| [50] | Mustafa, S., et al., Vibration-based health monitoring of an existing truss bridge using energy-based damping evaluation. Journal of Bridge Engineering, 2018, ISSN 1084-0702. |
| [51] | Wang S., et. al, Nonlinear Dynamic Analysis of the Wind–Train–Bridge System of a Long-Span Railway Suspension Truss Bridge. Buildings, 2023, 13, 277. |
| [52] | O. Bouzas B., et. al, A holistic methodology for the non-destructive experimental characterization and reliability-based structural assessment of historical steel bridges. Eng Struct, 2022, 270. |
| [53] | Ali, M. A. Y., Khoo, S., and Wang, Y., Probability distribution of decay rate: a statistical time-domain damping parameter for structural damage identification. Journal of Structural Health Monitoring, 2019, 18 (1), pp. 66-86. |
| [54] | Markogiannaki O, et. al, Vibration-based Damage Localization and Quantification Framework of Large-Scale Truss Structures. Structural Health Monitoring, 2023, 22(2): 1376-1398. |
| [55] | Teng, S., et al., Multi-sensor and decision-level fusion-based structural damage detection using a one-dimensional convolutional neural network. Sensors, 2021, 21 (12). |
| [56] | Bureick J., Alkhatib H., and Neumann I., Robust Spatial Approximation of Laser Scanner Point Clouds by Means of Free-form Curve Approaches in Deformation Analysis. Journal of Applied Geodesy, 2016, Vol. 10, Issue 1 pp. 27–35. |
| [57] | Schill F., Michel C., and Firus A., Contactless Deformation Monitoring of Bridges with Spatiotemporal Resolution: Profile Scanning and Microwave Interferometry. Sensors, 2022, 22 9562. |
| [58] | Kumar N. M., et. al., On the technologies empowering drones for intelligent monitoring of solar photovoltaic power plants. Procedia Comput. Sci., 2018, 133, pp. 585–593 |
| [59] | Choi Y., et. al, Utilization and Verification of Imaging Technology in Smart Bridge Inspection System: An Application Study. Sustainability, 2023, 1509. |
| [60] | Liao K. W., Lee Y. T., Detection of rust defects on steel bridge coatings via digital image recognition. Autom Constr, 2016, 71 pp. 294–306. |
| [61] | Sakaris, C., et al., Vibration-based damage precise localization in three-dimensional structures: Single versus multiple response measurements. Structural Health Monitoring, 2015, 14 (3), pp. 300-314. |
| [62] | Hester, D. and Gonzalez, A., The merits and limitations of drive-by monitoring in detecting localized bridge damage. Mechanical Systems and Signal Processing, 2017, 90, pp. 234-253. |
| [63] | Bjorheim, F., et al., A review of fatigue damage detection and measurement techniques. International Journal of Fatigue, 2022, 154, pp. 1-12. |
| [64] | Christensen, R. M., Mechanisms and measures for the ductility of materials failure. Proceedings of the Royal Society, 2020, 476: 2019.0719. |
| [65] | AASHTO Standard specifications for highway bridges. American Association of State Highway and Transportation Officials.2021. |
| [66] | Bontempi, F., Elementary concepts of structural robustness of bridges and viaducts. Journal of Civil Structural Health Monitoring, 2019, 9 (4), pp. 703-717. |
| [67] | Hebdon, M. H., et al., Fatigue life evaluation of critical details of the Hercílio Luz suspension bridge. Procedia Structural Integrity, 2017, 5, pp. 1027-1034. |
APA Style
Sugiantoro, B., Widyanto, S. A., Widodo, A., Sukamta, S. (2025). Vibration-Based Failure Diagnosis of Warren Truss Structures Using Supervised Machine Learning Techniques. International Journal of Mechanical Engineering and Applications, 13(1), 1-26. https://doi.org/10.11648/j.ijmea.20251301.11
ACS Style
Sugiantoro, B.; Widyanto, S. A.; Widodo, A.; Sukamta, S. Vibration-Based Failure Diagnosis of Warren Truss Structures Using Supervised Machine Learning Techniques. Int. J. Mech. Eng. Appl. 2025, 13(1), 1-26. doi: 10.11648/j.ijmea.20251301.11
AMA Style
Sugiantoro B, Widyanto SA, Widodo A, Sukamta S. Vibration-Based Failure Diagnosis of Warren Truss Structures Using Supervised Machine Learning Techniques. Int J Mech Eng Appl. 2025;13(1):1-26. doi: 10.11648/j.ijmea.20251301.11
@article{10.11648/j.ijmea.20251301.11,
  author = {Bambang Sugiantoro and Susilo Adi Widyanto and Achmad Widodo and Sukamta Sukamta},
  title = {Vibration-Based Failure Diagnosis of Warren Truss Structures Using Supervised Machine Learning Techniques},
  journal = {International Journal of Mechanical Engineering and Applications},
  volume = {13},
  number = {1},
  pages = {1-26},
  doi = {10.11648/j.ijmea.20251301.11},
  url = {https://doi.org/10.11648/j.ijmea.20251301.11},
  eprint = {https://article.sciencepublishinggroup.com/pdf/10.11648.j.ijmea.20251301.11},
  abstract = {This article explores advancements in damage detection and structural diagnostics for steel bridges by proposing an integrated analysis method for failure patterns and structural feasibility validation. The approach incorporates the correlation between damage causes and vibrational data classified by intensity levels. Using a supervised machine learning framework, training datasets are developed by analyzing structural behavior identified through specific vibration characteristics, specifically examining the Warren Truss type. It explored a system that diagnosed failure sequences based on vibration-classified structures within the steel bridge frame. The system generated data on the feasibility conditions by analyzing the vibration characteristics of structural elements with varying levels of damage. This vibration classification could be used as a reference for structural maintenance and repair. Machine learning diagnosis involved investigating bridge collapses to identify the types of elements and their positions within the structure, with forecasts serving as the basis for interference detection. Identifying and classifying vibration patterns in bridge structures focuses on assessing their response to potential damage and dysfunctions to ensure their safety and long-term durability. This involves using vibration-based structural health monitoring (SHM) systems that detect anomalies or changes in the dynamic behavior of bridges. The primary objective is correlating specific vibration signatures with structural defects, such as fatigue cracks, material degradation, or connection failures. This assessment categorized structural degeneration into three levels: moderate (30%), urgent (50%), and severe/critical (≥70%). The findings of the assessment group informed the design of management strategies, technical maintenance plans, and overall structural performance improvements for Warren Truss Bridges. Factual values and ductility measurements were also considered. The study provided a more detailed summary of relevant research outcomes and the developmental stages of a recent vibration-based diagnostic system for future research.},
 year = {2025}
}
TY  - JOUR
T1  - Vibration-Based Failure Diagnosis of Warren Truss Structures Using Supervised Machine Learning Techniques
AU  - Bambang Sugiantoro
AU  - Susilo Adi Widyanto
AU  - Achmad Widodo
AU  - Sukamta Sukamta
Y1  - 2025/02/11
PY  - 2025
N1  - https://doi.org/10.11648/j.ijmea.20251301.11
DO  - 10.11648/j.ijmea.20251301.11
T2  - International Journal of Mechanical Engineering and Applications
JF  - International Journal of Mechanical Engineering and Applications
JO  - International Journal of Mechanical Engineering and Applications
SP  - 1
EP  - 26
PB  - Science Publishing Group
SN  - 2330-0248
UR  - https://doi.org/10.11648/j.ijmea.20251301.11
AB  - This article explores advancements in damage detection and structural diagnostics for steel bridges by proposing an integrated analysis method for failure patterns and structural feasibility validation. The approach incorporates the correlation between damage causes and vibrational data classified by intensity levels. Using a supervised machine learning framework, training datasets are developed by analyzing structural behavior identified through specific vibration characteristics, specifically examining the Warren Truss type. It explored a system that diagnosed failure sequences based on vibration-classified structures within the steel bridge frame. The system generated data on the feasibility conditions by analyzing the vibration characteristics of structural elements with varying levels of damage. This vibration classification could be used as a reference for structural maintenance and repair. Machine learning diagnosis involved investigating bridge collapses to identify the types of elements and their positions within the structure, with forecasts serving as the basis for interference detection. Identifying and classifying vibration patterns in bridge structures focuses on assessing their response to potential damage and dysfunctions to ensure their safety and long-term durability. This involves using vibration-based structural health monitoring (SHM) systems that detect anomalies or changes in the dynamic behavior of bridges. The primary objective is correlating specific vibration signatures with structural defects, such as fatigue cracks, material degradation, or connection failures. This assessment categorized structural degeneration into three levels: moderate (30%), urgent (50%), and severe/critical (≥70%). The findings of the assessment group informed the design of management strategies, technical maintenance plans, and overall structural performance improvements for Warren Truss Bridges. Factual values and ductility measurements were also considered. The study provided a more detailed summary of relevant research outcomes and the developmental stages of a recent vibration-based diagnostic system for future research.
VL  - 13
IS  - 1
ER  -
Department of Mechanical Engineering, Diponegoro University, Semarang, Indonesia
Biography: Bambang Sugiantoro is a lecturer specializing in Mechanical Engineering and currently a doctoral candidate in the Mechanical Engineering Department, Faculty of Engineering, Diponegoro University. He holds a master’s degree in Engineering and focuses his dissertation research on the design of structural damage diagnostics for steel constructions, particularly steel bridges, utilizing vibration-based methodologies. His research aims to develop diagnostic systems that generate data for supervised machine learning, focusing on material characteristics under varying levels of damage. He is actively involved in various research initiatives and technological implementations, including mitigation strategies and the environmental impact of industrial operations. Bambang has secured several patents and industrial designs, with some of his machinery successfully commercialized. He has contributed to the deployment of industrial-scale technologies in several locations, including Banyumas, Purbalingga, and Banjarnegara. His work also includes developing IoT-based control systems for production machinery and intelligent applications that enable real-time performance monitoring and process analysis.

Department of Mechanical Engineering, Diponegoro University, Semarang, Indonesia
Biography: Susilo Adi Widyanto is a senior lecturer at Mechanical Engineering Department the Faculty of Engineering, Diponegoro University, as a postgraduate (doctoral-level). He had completed both his Master’s and Ph.D. degrees at Universitas Gadjah Mada, Yogyakarta. With a strong academic foundation, he actively teaches various subjects, including manufacturing, robotics, and structural design. Renowned for his significant contributions, he has designed innovative machinery ranging from prototype to industrial-scale applications. His achievements include developing continuous tube annealing machines and conducting environmental impact analyses. Additionally, he has worked extensively on structural mitigation projects, particularly in steel construction. His expertise lies in vibration system analysis and material treatment to evaluate fatigue limits and fatigue life. Over the years, he has actively participated in collaborative research projects, contributing to advancements in structural diagnostics and material properties. One notable project involved determining the modulus of elasticity, Poisson’s ratio, and strain hardening coefficients of metals through discontinuous uniaxial tensile testing, which has direct applications in vibration-based diagnostic systems for steel structures.

Department of Mechanical Engineering, Diponegoro University, Semarang, Indonesia
Biography: Achmad Widodo is a senior lecturer at the Department of Mechanical Engineering, Faculty of Engineering, Diponegoro University, where he teaches postgraduate (doctoral-level) courses. He earned his Master of Engineering (M.Eng.) degree from the Department of Mechanical Engineering, Bandung Institute of Technology (ITB) in 2000. He pursued his doctoral studies and received a Doctor of Engineering (Dr.Eng.) degree from Pukyong National University, South Korea, in 2007. Currently, he is actively teaching courses in mechanical engineering, focusing on areas such as Engineering Mathematics, Engineering Analysis, Mechanical Vibrations, Kinematics and Dynamics, and Principles of Optimization. His research is centered on developing machine learning systems for machine fault diagnosis and prognosis, with a particular interest in intelligent fault diagnostics and prognostics. His expertise includes applications of support vector machines (SVMs) for machine condition monitoring and fault diagnosis, as well as integrating thermal imaging and vibration signal analysis for intelligent diagnostics. Additionally, he investigates machine health prognostics using survival probability models and SVM techniques. His work reflects a strong commitment to advancing predictive maintenance technologies and enhancing machine reliability through intelligent diagnostics and prognostics systems.

Department of Civil Engineering, Diponegoro University, Semarang, Indonesia
Biography: Sukamta is a senior lecturer in Civil Engineering at the Faculty of Engineering, Diponegoro University, Semarang, Indonesia. He earned his Ph.D. in Civil Engineering from Tokushima University, Japan, in 2008 and Master of Engineering in Civil Engineering from Gadjah Mada University, Indonesia, in 2001. He is widely recognized for his exceptional contributions to civil engineering research and practice. He has made significant advancements in structural and aerodynamics engineering. Notably, he contributed to the aerodynamic analysis of the Musi III Cable-Stayed Bridge (2013) in collaboration with PT. Wiratman Jakarta and the Aero-Gas Dynamics and Vibration Laboratory under the Ministry of Public Works. His innovative work includes a patented method for anchoring reinforced concrete beams using Fiber-Reinforced Polymer (FRP) sheets, titled “Method of Anchoring (Anchor) with Recesses in the External Strengthening of Reinforced Concrete Beams Using Fiber-Reinforced Polymer Sheets.”. His also committed to community outreach and engineering applications. He has been involved in capacity-building initiatives, such as assisting with the design and construction of retaining walls in Jembrak Village, Semarang in 2017. In recent years, he has actively participated in international research collaborations, contributing to advancing civil engineering knowledge and practices globally.

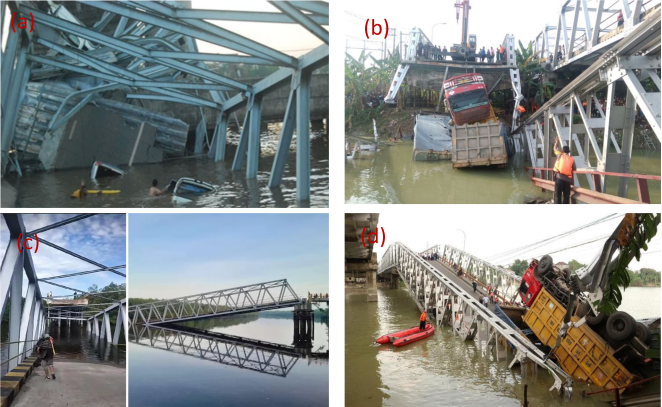
Figure 1.
The steel bridge collapsed in Indonesia; (a) Kutai Kertanegara (2011), (b). Babad Widang, Lamongan (2018). (c). Parawang, Riau (2023); Aceh, (d). Pematang Panggang, Palembang (2019).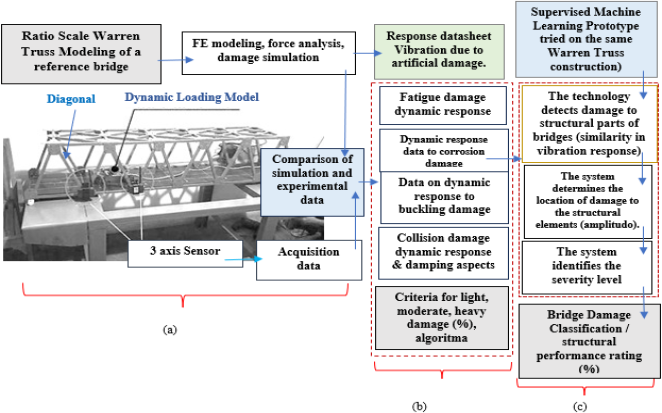
Figure 2. (a). Modeling and Datasheets (b). Validation, Fusion, and Algorithms (c) Supervised Machine Learning (SML), [16].
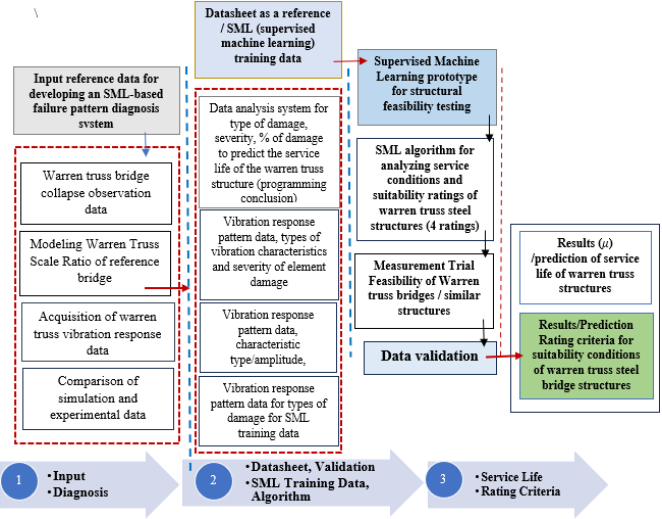
Figure 3.
Stages of developing SML machine learning diagnostics, according to analysis capabilities; (1). Observation data, sensor modeling, and data acquisition, (2). Validation, Fusion & algorithms, (3) validation, prediction of remaining service. [The author].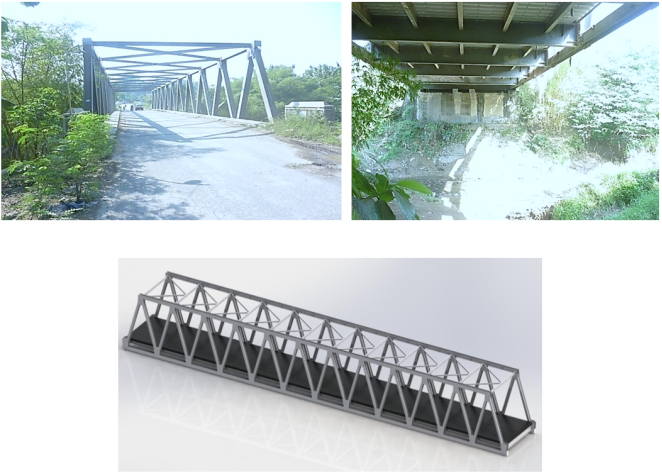
Figure 4.
Depicted a model of the Sendang Mulyo Bridge in Semarang, Indonesia.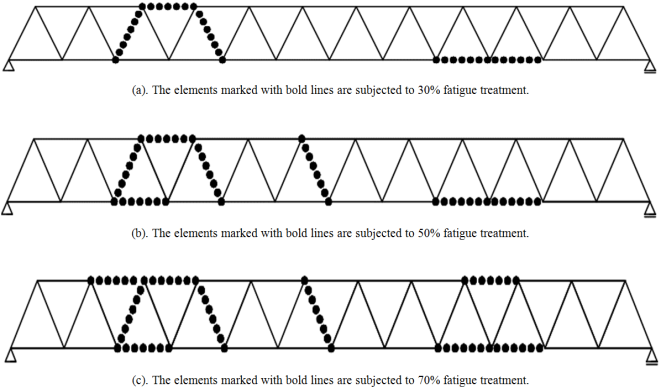
Figure 5.
The treatment of fatigue on elements under varying static loads induced by vehicles.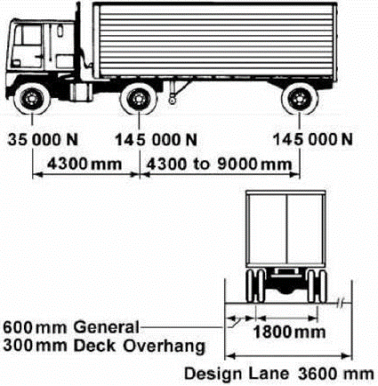
Figure 6.
Reference truck load for static vehicle load analysis.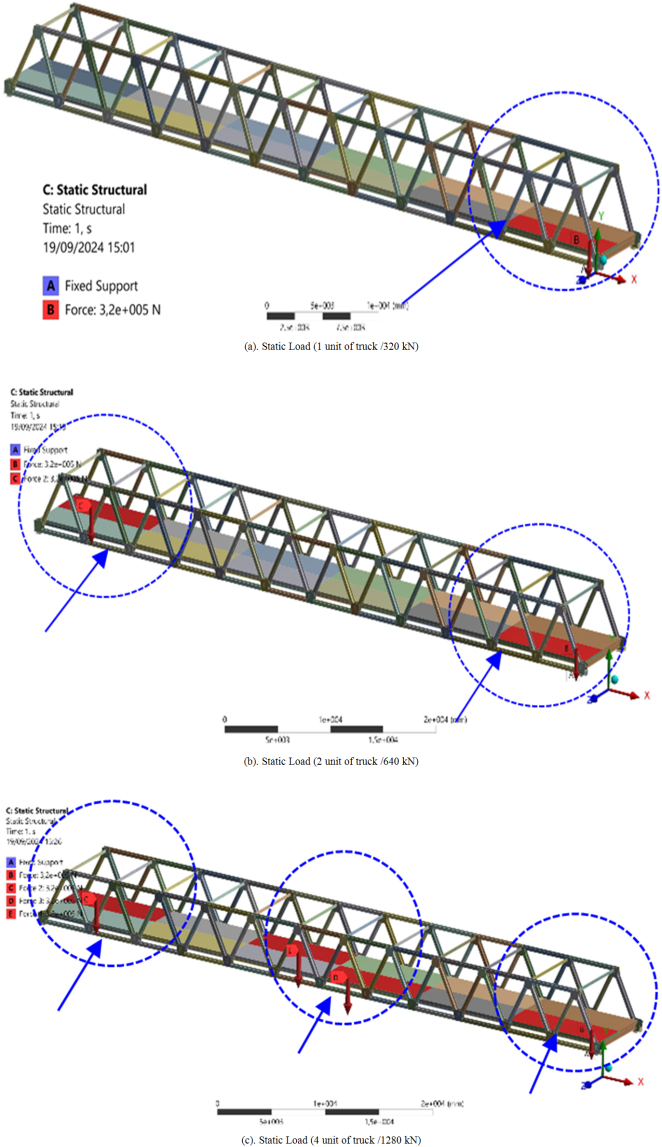
Figure 7.
The static load distribution of a truck, with variations in the number of units, (1 unit, 2 units, and 4 units) and their positions (indicated by red markers).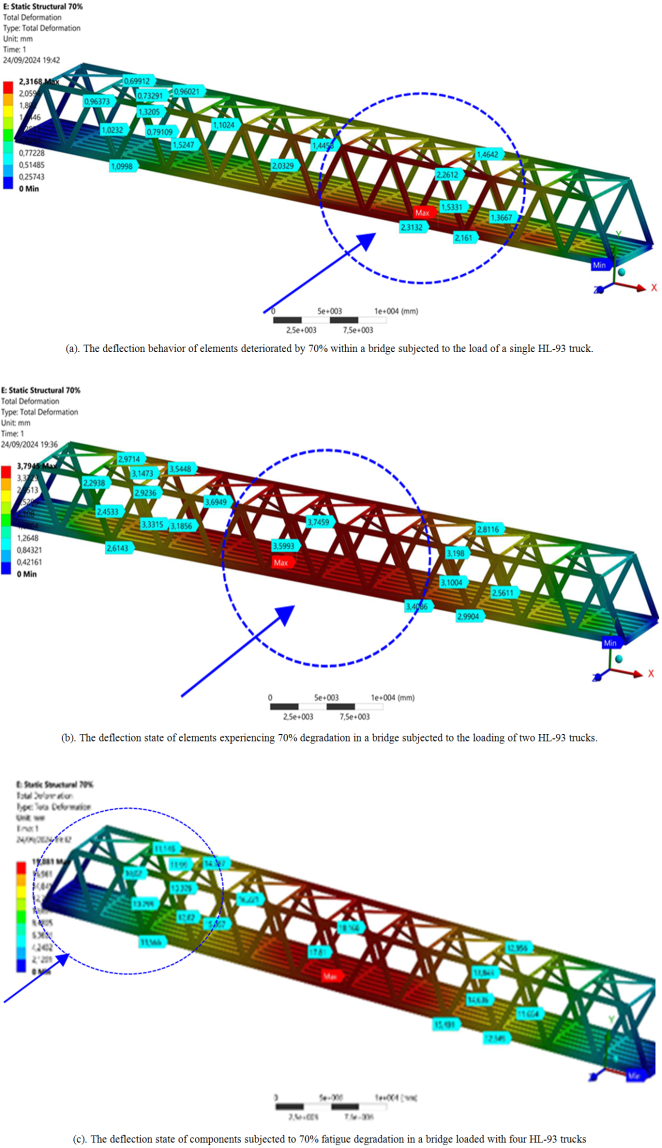
Figure 8.
The deflection under static load, condition of elements degraded by 70%.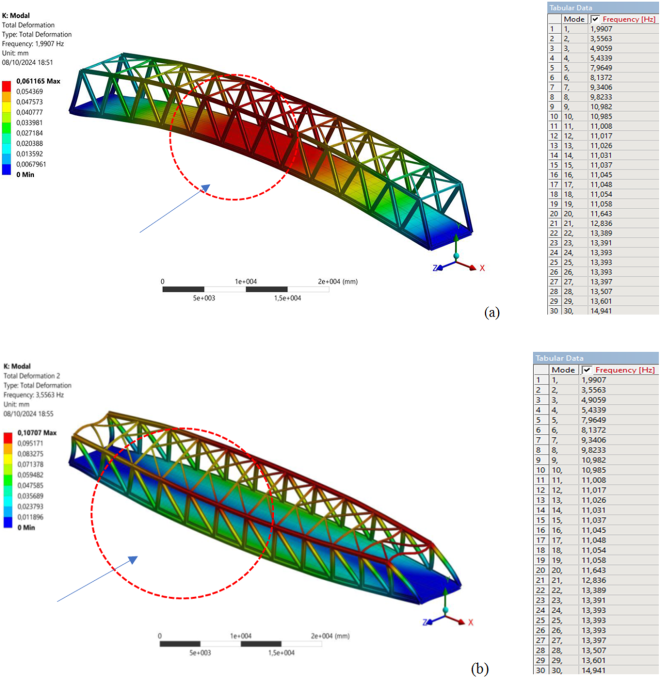
Figure 9.
ANSYS Simulation Results: Natural Frequency Variation Due to 70% Element Degradation.
Figure 10.
Frequency and Amplitude for: (a) Load from a single truck (320 kN), (b) Load from two trucks (640 kN), and (c) Dynamic load under (2.560 kN), and critical deflection of 62.457 mm.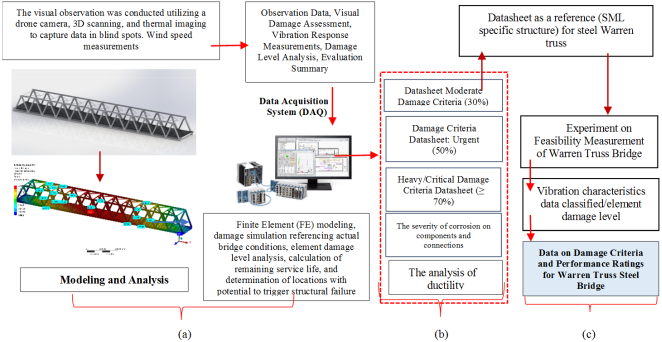
Figure 11.
The smart diagnostic system is illustrated in (a), where visual inspection and modeling are performed. In (b), training data are compiled, validated, (c), supervised machine learning (SML) [The Author].Information

