Abstract
Oil spills in the Niger Delta pose a severe environmental threat, yet existing detection methods remain slow, manual and unsuitable for large-scale continuous monitoring. While existing studies have applied individual YOLOv8 variants to oil spill detection, no prior study has systematically benchmarked YOLOv8n, YOLOv8s and YOLOv8m under identical conditions framed around Niger Delta deployment constraints. This study benchmarks three YOLOv8 variants nano, small and medium trained and evaluated under identical conditions. The dataset used is a publicly available Oil Spill Detection dataset from Roboflow Universe, comprising 2,567 images across four classes: object, rainbow, sheen and truecolor. The models were evaluated on a held-out test set of 72 images using mAP@50, mAP@50-95, Precision, Recall and Inference Speed. It was found that YOLOv8m achieved the highest accuracy at 81.95% mAP@50, while YOLOv8n achieved the fastest inference at 6.2ms with 68.66% mAP@50, and YOLOv8s offered no clear advantage over nano. YOLOv8n is recommended for resource-constrained deployment given its speed advantage, while YOLOv8m is recommended where computational resources allow, given its superior accuracy. These findings show that deep learning based detection is a viable and practical approach for automated environmental monitoring in the Niger Delta region, offering a better pathway toward localized, scalable oil spill surveillance in a region that has lacked such tools, helping guide faster cleanup response.
Keywords
YOLOv8, Oil Spill Detection, Object Detection, Environmental Monitoring, Niger Delta
1. Introduction
Oil spillage has been and continues to be one of the most damaging and devastating environmental disasters, damaging crops, contaminating water sources, disrupting marine ecosystems and harming coastal communities. The traditional methods of monitoring and detecting spillage, which are majorly by manual inspection and satellite image analysis by human experts, are slow and not suitable for large-scale continuous monitoring
.
As a result of decades of pipeline vandalism, equipment failure and illegal bunkering, spills have become more frequent, causing billions in annual losses and widespread environmental destruction
. Even with the Niger Delta being one of the most oil-polluted regions on earth
, existing automated systems were not designed with the Niger Delta environment in mind, which raises a need for a localized, affordable and automated detection approach.
Deep learning has posed a solution to this problem, with recent advancements in deep learning making object detection highly accurate
. Computer vision models can analyze images significantly faster than a human expert and can also be deployed on drone footage and satellite imagery for real-time monitoring. YOLO models are particularly suited for this because they are fast, accurate and lightweight enough for real-world deployment
.
Most oil spill detection studies use a single model without benchmarking alternatives, with no study having systematically compared YOLOv8 variants specifically for oil spill detection, rarely addressing the trade-offs between accuracy and computational efficiency, with none of them being framed to accommodate Niger Delta deployment constraints.
This study sets out to benchmark three YOLOv8 variants namely nano, small and medium, which will be trained on a publicly available annotated dataset from Roboflow Universe
and evaluated using the standard metrics mAP@50, Precision, Recall and inference speed, with the end goal being to identify the optimal model which balances both accuracy and efficiency, framed specifically for Niger Delta environmental monitoring applications.
The paper is structured as follows: Section 2 presents the literature review, Section 3 presents the methodology, Section 4 presents the results and discussion, and finally section 5 the conclusion.
2. Related Work
With early detection relying on visual observation, aerial surveillance and satellite imagery, which are all limited by weather conditions, cloud cover and the cost of operations, and with manual interpretation of satellite imagery being too time-consuming and requiring expert knowledge, the push towards more automated detection systems was the natural solution
.
Early automated systems used image processing techniques such as thresholding and segmentation, and SAR (Synthetic Aperture Radar) imagery became widely adopted for oil spill detection
. However, the performance of these classical methods was inconsistent across different environmental conditions and they struggled with look-alike phenomena, where areas that resembled oil spills but were not were flagged as positive detections
| [8] | Genovez, P. et al. "Oil Spill Detection from Synthetic Aperture Radar Earth Observations: A Meta-Analysis and Comprehensive Review." GIScience and Remote Sensing. 2021; 58(7): 1–27. https://doi.org/10.1080/15481603.2021.1952542 |
[8]
.
Significant improvement to oil spill detection over classical methods was brought by Convolutional Neural Networks (CNNs), with studies showing that CNNs could detect oil spills with higher accuracy and less manual intervention
. Models like U-Net were applied to SAR imagery for pixel-level segmentation of spill regions, and it was observed that deep learning models generalized better across varying conditions than traditional methods
| [10] | Krestenitis, M., Orfanidis, G., Ioannidis, K., Avgerinakis, K., Vrochidis, S., Kompatsiaris, I. "Oil Spill Identification from Satellite Images Using Deep Neural Networks." Remote Sensing. 2019; 11(15): 1762. https://doi.org/10.3390/rs11151762 |
[10]
.
YOLO models introduced real-time object detection capabilities, with many studies applying YOLO variants to environmental monitoring tasks
| [11] | Ahmed, A. et al. "Real-Time Intelligent Garbage Monitoring and Efficient Collection Using YOLOv8 and YOLOv5 Deep Learning Models for Environmental Sustainability." Scientific Reports. 2025; 15.
https://doi.org/10.1038/s41598-025-99885-x |
[11]
. While YOLOv5 and earlier variants showed strong results in related detection tasks, YOLOv8 introduced architectural improvements making it faster and more accurate than its predecessors
| [12] | Casas, E., Ramos, L., Bendek, E., Rivas-Echeverría, F. "YOLOv5 vs. YOLOv8: Performance Benchmarking in Wildfire and Smoke Detection Scenarios." Journal of Image and Graphics. 2024; 12(2): 127–136.
https://doi.org/10.18178/joig.12.2.127-136 |
[12]
. More recent studies have begun applying YOLOv8 directly to oil spill detection: Xu et al. combined YOLOv8 with SA-PSO for marine radar oil spill detection
| [13] | Xu, J., Huang, Y., Dong, H., Chu, L., Yang, Y., Li, Z., Qian, S., Cheng, M., Li, B., Liu, P., Wu, J. "Marine Radar Oil Spill Detection Method Based on YOLOv8 and SA_PSO." J. Mar. Sci. Eng. 2024; 12(6): 1005.
https://doi.org/10.3390/jmse12061005 |
[13]
, Cai et al. used a single-image generative adversarial network alongside YOLOv8 to address small-sample oil spill detection
| [14] | Cai, Y., Chen, L., Zhuang, X., Zhang, B. "Automated marine oil spill detection algorithm based on single-image generative adversarial network and YOLO-v8 under small samples." Mar. Pollut. Bull. 2024; 203: 116475.
https://doi.org/10.1016/j.marpolbul.2024.116475 |
[14]
, and Bui et al. applied deep learning with tailored data augmentation for oil spill detection and classification
| [15] | Bui, N. A., Oh, Y., Lee, I. "Oil spill detection and classification through deep learning and tailored data augmentation." Int. J. Appl. Earth Obs. Geoinf. 2024; 129: 103845.
https://doi.org/10.1016/j.jag.2024.103845 |
[15]
. However, none of these studies benchmark multiple YOLOv8 variants against each other, nor do they address resource-constrained deployment trade-offs the specific gap this study addresses.
3. Materials and Methods
This study adopts an experimental research design with the three YOLOv8 variants trained and evaluated under identical conditions, ensuring a fair and unbiased comparison across all models. The entire pipeline is executed on Google Colab using a T4 GPU.
The dataset used in this study is the Oil Spill Detection dataset sourced from Roboflow Universe, consisting of 2,567 images after augmentation, from an original 909 pre-augmentation raw images, across four classes: Object, Rainbow, Sheen and Truecolor. The dataset was pre-split by Roboflow into train, validation and test sets, with images preprocessed and resized to 640×640 pixels and data augmentation automatically applied during export. It is noted that the dataset contained mixed detection and segmentation annotations; only bounding box annotations were used in this study, with segment annotations automatically removed by the Ultralytics framework. It is acknowledged that the validation set comprised only 8 images, which is noted as a dataset limitation.
For the model benchmarking, three YOLOv8 variants were selected: firstly, YOLOv8n (nano) with 3.2M parameters, chosen for being the fastest and most lightweight; secondly, YOLOv8s (small) with 11.2M parameters, chosen for its balance of speed and accuracy; and finally, YOLOv8m (medium) with 25.9M parameters, chosen for its higher detection accuracy. All models were initialized with pertained COCO weights, collectively covering the full spectrum from lightweight to moderately complex architectures.
YOLOv8l and YOLOv8x were deliberately excluded from this benchmark. Both are substantially larger architectures (43.7M and 68.2M parameters respectively) designed for server-grade GPU deployment, which is inconsistent with the resource-constrained edge and drone-based deployment context this study is framed around for the Niger Delta. Including them would have shifted the comparison away from the practical question this study asks which variant is deployable on low-cost, low-power hardware in the field toward a purely academic accuracy ceiling that is not operationally relevant to the target use case. YOLOv8n, YOLOv8s and YOLOv8m were selected instead because they collectively span the lightweight-to-moderate range most compatible with realistic field deployment budgets in the region.
All three models were trained under identical hyper parameters to ensure a fair comparison, including 100 epochs, an image size of 640×640, a batch size of 16, the AdamW optimizer automatically selected by the Ultralytics YOLOv8 library with a learning rate of 0.00125 and momentum of 0.9, and early stopping with a patience of 20 epochs.
To assess computational cost alongside detection performance, GPU memory usage and total training time were recorded for each variant on the Google Colab T4 GPU. YOLOv8n required approximately 2.0 GB of peak GPU memory and completed training in 58.2 minutes (82 epochs, triggering early stopping); YOLOv8s required approximately 3.8 GB and 47.0 minutes (57 epochs, also triggering early stopping); and YOLOv8m required approximately 6.4 GB and 141.0 minutes (98 epochs, running nearly the full training budget without early stopping). This confirms that computational cost scales with model complexity not only in inference speed but in both memory footprint and training duration with YOLOv8m requiring roughly 3.2 times more GPU memory and 2.4 times longer training time than YOLOv8n. This is a relevant consideration for researchers or practitioners in the region with limited access to high-memory GPUs or sustained cloud compute sessions.
All models were evaluated on the same held-out test set using the following metrics: mAP@50, that is the mean Average Precision at 50% IoU threshold; mAP@50-95 that is the mean Average Precision across IoU thresholds 50 to 95; Precision that is the proportion of correct positive detections; Recall, the proportion of actual positives accurately detected and Inference Speed, the detection time per image in milliseconds, included to assess real-world deployment suitability.
The results of all three models were compiled into a single comparison table, with the best model identified based on the highest mAP@50 combined with acceptable inference speed. Qualitative analysis of prediction visualizations was also included, with the discussion framed around Niger Delta deployment suitability.
4. Results and Discussion
The three variants were evaluated on the same held-out test set of 72 images, with the test set containing 177 instances across four classes: object, rainbow, sheen and truecolor. The results were then compiled into a single comparison table for direct benchmarking. It was observed that YOLOv8m achieved the highest overall accuracy, while YOLOv8n achieved the best inference speed.
Table 1. Presents the Performance Comparison of Yolov8 Variants on the Oil Spill Detection Test Set.
Model | Parameters | mAP@50 (%) | mAP@50-95 (%) | Precision (%) | Recall (%) | Inference Speed |
YOLOv8n (Nano) | 3.2M | 68.66 | 54.39 | 54.21 | 87.78 | 6.2ms |
YOLOv8s (Small) | 11.2M | 71.68 | 52.58 | 67.87 | 85.45 | 11.8ms |
YOLOv8m (Medium) | 25.9M | 81.95 | 63.51 | 79.92 | 83.65 | 23.1ms |
Table 1 presents the overall performance comparison across all three variants. It is observed that YOLOv8m leads on mAP@50 (81.95%), mAP@50-95 (63.51%) and Precision (79.92%), while YOLOv8n achieves the highest Recall (87.78%) and fastest inference speed (6.2ms). The accuracy gap between the nano and medium variants was 13.29 percentage points on mAP@50, with medium running at 23.1ms compared to nano's 6.2ms, making medium 3.7 times slower than nano.Given the modest size of the held-out test set (72 images, 177 instances), and the pronounced class imbalance discussed above, confidence intervals were not computed for the reported metrics in this study. Performance differences reported here particularly the 13.29 percentage point mAP@50 gap between YOLOv8n and YOLOv8m should therefore be interpreted as indicative rather than statistically confirmed, and this is noted as a limitation. Future work with a larger, class-balanced test set would allow bootstrap or cross-validation based confidence intervals to more rigorously establish whether the observed accuracy differences between variants are statistically significant.
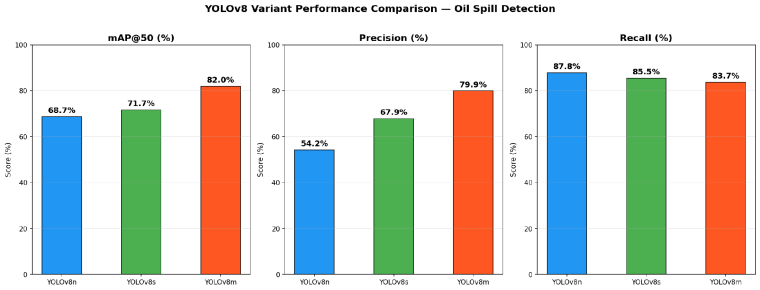
Figure 1 further illustrates these differences across mAP@50, Precision and Recall for all three variants.
Figure 1. Presents the Performance comparison of YOLOv8n, YOLOv8s and YOLOv8m across mAP@50, Precision and Recall metrics.
In the per-class analysis presented in
Table 2, truecolor is the dominant class with 125 instances and the best detection across all models, with medium leading at mAP@50 of 0.867. Sheen was moderately well detected, with medium again leading the other variants at mAP@50 of 0.764. All models struggled with the rainbow class, though medium led at 0.653 mAP@50. It is important to note that the object class was the rarest, with only one instance in the test set. Both nano and small scored 0.497 mAP@50 on this class, while medium significantly outperformed them at 0.995, which further explains medium's overall advantage. A detection challenge worth noting is that truecolor showed the lowest recall across all models despite being the best detected class by mAP@50.
It is important to note that the Object class was the rarest in the test set, with only a single instance present. This severe imbalance means the Object class mAP@50 scores, 0.497 for both YOLOv8n and YOLOv8s, and 0.995 for YOLOv8m are not statistically reliable indicators of true per-class performance, since a single test instance produces a binary-like outcome (either detected well or not) rather than a distribution that reflects general model behavior. YOLOv8m's near-perfect score on this class should therefore be interpreted with caution rather than as evidence of a genuine detection advantage, and its contribution to the reported "Overall" mAP@50 figures should be read with this limitation in mind. This imbalance originates upstream in the dataset itself, where the Object class was underrepresented relative to Truecolor, Sheen and Rainbow across the full pipeline not only in the test set but also, as noted, entirely absent from the validation set. Future work using a class-balanced dataset, or at minimum a larger held-out sample per class, would be necessary to draw reliable conclusions about model performance on rare spill-related object categories.
Table 2. presents the Per-Class Performance Comparison across Yolov8 Variants (Map@50).
Class | YOLOv8n mAP@50 | YOLOv8s mAP@50 | YOLOv8m mAP@50 |
Object | 0.497 | 0.497 | 0.995 |
Rainbow | 0.605 | 0.725 | 0.653 |
Sheen | 0.759 | 0.748 | 0.764 |
Truecolor | 0.884 | 0.897 | 0.867 |
Overall | 0.687 | 0.717 | 0.82 |
The core finding of this study is that as model complexity increases, accuracy improves but at a significant computational cost. YOLOv8n with 3.2M parameters achieved an inference speed of 6.2ms at 68.66% mAP@50, proving it a strong efficiency candidate. YOLOv8m with 25.9M parameters achieved 81.95% mAP@50 at 23.1ms, making it the strong accuracy candidate. YOLOv8s however offers no clear advantage, with 11.2M parameters yet the lowest mAP@50-95 score of 52.58% and only middle-ground speed. For deployment in the Niger Delta where edge hardware and drones are resource-constrained, nano's speed is of great advantage, while for stationary monitoring stations where compute is available, medium is the better choice.
During training, validation metrics appeared inflated compared to the test set results. Only two classes, sheen and truecolor appeared in the validation set, while all four classes appeared in the test set. The object class was entirely absent from validation, which explains why nano and small performed poorly on it at test time. The small validation set of only 8 images also reduces the reliability of early stopping decisions. These limitations should be acknowledged, but they do not invalidate the test set findings.
Niger Delta deployment conditions demand solutions that work on low-cost hardware such as drones, edge devices and remote monitoring stations. YOLOv8n is recommended for resource-constrained deployment given its real-time capability at 6.2ms and lightweight nature at 3.2M parameters. YOLOv8m is recommended where accuracy is paramount and compute is available, owing to its high detection rate across all classes. Both models demonstrated strong truecolor detection, which is the most common real-world spill signature. The underperformance of all models on the rainbow class highlights the need for larger and more diverse datasets in future work. Overall, this benchmarking provides a practical evidence base for selecting detection models suited to Niger Delta environmental monitoring. To better understand the specific failure modes behind the reported metrics, this section examines the classes and conditions where all three variants underperformed. The Rainbow class was the most consistently challenging across all variants (mAP50 of 0.605, 0.725 and 0.653 for nano, small and medium respectively), likely because rainbow sheen patterns on water are visually subtle and easily confused with lighting reflections or the Sheen class itself, particularly under variable illumination in the source imagery. This visual overlap between Rainbow and Sheen is consistent with the confusion pattern typically seen in oil-on-water detection tasks, where thin oil films produce iridescent color bands that shift with viewing angle and lighting, making them harder to separate from adjacent sheen regions than the more visually distinct Truecolor and Object classes.
The Object class presents a different failure mode entirely, not a genuine detection weakness, but a data scarcity problem. With only one instance in the test set and no representation at all in the validation set, the wide swing between nano/small's 0.497 mAP50 and medium's 0.995 mAP50 reflects the fragility of a single-instance evaluation rather than a meaningful architectural advantage for the medium variant. This is corroborated by the training-time validation curves, where object-class performance could not be tracked at all during training due to its absence from the validation split, meaning early stopping decisions for all three models were made without any signal on this class's learning progress.
A further failure pattern worth noting is the recall/precision trade-off observed for Truecolor: despite being the best-detected class by mAP50 across all models, it showed the lowest recall, suggesting that while the model is highly precise when it does detect Truecolor instances, it is more prone to missing them entirely (false negatives) compared to other classes. This may reflect greater visual variability within the Truecolor class itself (since it is the most common and likely most visually diverse spill signature), making consistent detection harder even though correct detections are reliable when they occur.
Taken together, these failure patterns point to two distinct improvement priorities for future work: (1) improving Rainbow/Sheen separability, likely through additional training examples that specifically capture the visual boundary between these two classes, and (2) addressing the structural data scarcity affecting the Object class, which no amount of architectural tuning can resolve without a better-balanced dataset.
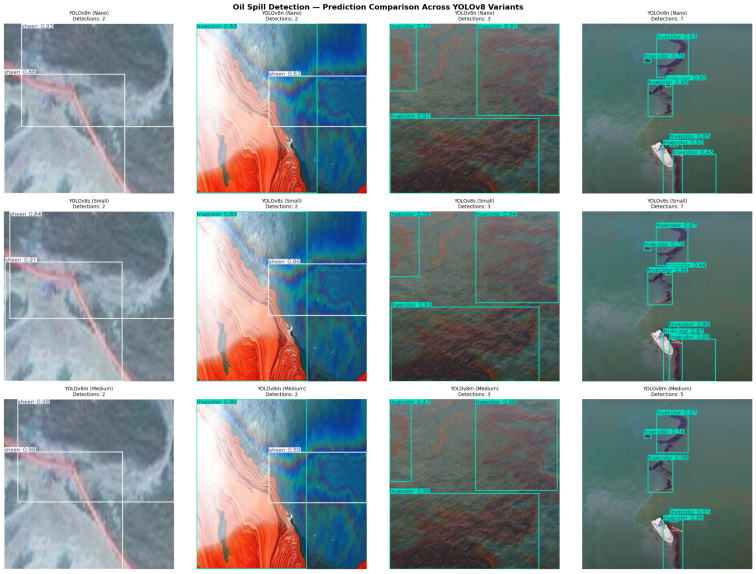
Figure 2 presents qualitative prediction visualizations of all three variants on sample test images from the dataset.
Figure 2. Presents the Qualitative prediction visualizations of YOLOv8n, YOLOv8s and YOLOv8m on sample test images from the Oil Spill Detection dataset.
5. Conclusion
This study set out to benchmark three YOLOv8 variants for oil spill detection in the Niger Delta region, addressing a gap where no prior study had systematically compared these variants specifically for this task. The models were trained and evaluated under identical conditions on a publicly available dataset and assessed using mAP@50, mAP@50-95, Precision, Recall and Inference Speed.
YOLOv8m achieved the highest accuracy at 81.95% mAP@50 and 63.51% mAP@50-95, while YOLOv8n achieved the fastest inference at 6.2ms with competitive accuracy at 68.66% mAP@50. YOLOv8s did not justify its parameter cost, offering no clear advantage over nano on any metric. The truecolor class was the most reliably detected class, with the rainbow class being the most challenging across all models.
No single model is universally optimal, the best choice depends on the deployment context. YOLOv8n is recommended for resource-constrained Niger Delta deployment, while YOLOv8m is recommended where computational resources and accuracy demands allow. These findings demonstrate that deep learning based automated detection is a viable and practical approach for environmental monitoring in the Niger Delta region, which has historically lacked localized automated solutions.
The validation set of only 8 images is a dataset limitation that affects training reliability. Object and rainbow were underrepresented in the dataset, limiting generalization on those classes. Future work should endeavour to incorporate larger Niger Delta specific datasets with better class balance, and extending the benchmark to include YOLOv8l and YOLOv8x would provide a more complete picture. The full pipeline was built on publicly available tools like Roboflow, Ultralytics YOLOv8 and Google Colab, making it fully reproducible by other researchers.
Abbreviations
YOLO | You Only Look Once |
mAP | Mean Average Precision |
IoU | Intersection over Union |
SAR | Synthetic Aperture Radar |
CNN | Convolutional Neural Network |
GPU | Graphics Processing Unit |
COCO | Common Objects in Context |
Acknowledgments
I acknowledge the support provided by Federal University of Technology Owerri (FUTO), through the Information Communication Technology (ICT) research center.
Author Contributions
Nnanna Ekedebe: Conceptualization, Data Curation, Formal Analysis, Investigation, Methodology, Project Administration, Resources, Software, Supervision, Validation, Visualization, Writing – original draft, Writing – review & editing
Conflicts of Interest
The author declares no conflicts of interest.
References
| [1] |
Fingas, M., Brown, C. "Review of Oil Spill Remote Sensing." Sensors. 2018; 18(1): 91.
https://doi.org/10.3390/s18010091
|
| [2] |
Institute for Security Studies (ISS Africa). "Endless Oil Spills Blacken Ogoniland's Prospects." March 2022. Available:
https://issafrica.org/iss-today/endless-oil-spills-blacken-ogonilands-prospects
|
| [3] |
United Nations Environment Programme (UNEP). "Environmental Assessment of Ogoniland." Nairobi, Kenya, 2011. Available:
https://www.unep.org/resources/report/environmental-assessment-ogoniland
|
| [4] |
Li, J. et al. "AI and Remote Sensing for Marine Oil Spill Detection." Remote Sensing. 2025; 17(22): 3681.
https://doi.org/10.3390/rs17223681
|
| [5] |
Jocher, G., Chaurasia, A., Qiu, J. "Ultralytics YOLOv8." 2023. Available:
https://github.com/ultralytics/ultralytics
|
| [6] |
mon. "Oil Spill Detection Dataset." Roboflow Universe, Roboflow, 2024. Available:
https://universe.roboflow.com/mon-ehjb6/oil-spill-detection-gajxc
|
| [7] |
Brekke, C., Solberg, A. H. S. "Oil Spill Detection by Satellite Remote Sensing." Remote Sensing of Environment. 2005; 95(1): 1–13.
https://doi.org/10.1016/j.rse.2004.11.015
|
| [8] |
Genovez, P. et al. "Oil Spill Detection from Synthetic Aperture Radar Earth Observations: A Meta-Analysis and Comprehensive Review." GIScience and Remote Sensing. 2021; 58(7): 1–27.
https://doi.org/10.1080/15481603.2021.1952542
|
| [9] |
Shaban, M. et al. "A Deep-Learning Framework for the Detection of Oil Spills from SAR Data." Sensors. 2021; 21(7): 2351.
https://doi.org/10.3390/s21072351
|
| [10] |
Krestenitis, M., Orfanidis, G., Ioannidis, K., Avgerinakis, K., Vrochidis, S., Kompatsiaris, I. "Oil Spill Identification from Satellite Images Using Deep Neural Networks." Remote Sensing. 2019; 11(15): 1762.
https://doi.org/10.3390/rs11151762
|
| [11] |
Ahmed, A. et al. "Real-Time Intelligent Garbage Monitoring and Efficient Collection Using YOLOv8 and YOLOv5 Deep Learning Models for Environmental Sustainability." Scientific Reports. 2025; 15.
https://doi.org/10.1038/s41598-025-99885-x
|
| [12] |
Casas, E., Ramos, L., Bendek, E., Rivas-Echeverría, F. "YOLOv5 vs. YOLOv8: Performance Benchmarking in Wildfire and Smoke Detection Scenarios." Journal of Image and Graphics. 2024; 12(2): 127–136.
https://doi.org/10.18178/joig.12.2.127-136
|
| [13] |
Xu, J., Huang, Y., Dong, H., Chu, L., Yang, Y., Li, Z., Qian, S., Cheng, M., Li, B., Liu, P., Wu, J. "Marine Radar Oil Spill Detection Method Based on YOLOv8 and SA_PSO." J. Mar. Sci. Eng. 2024; 12(6): 1005.
https://doi.org/10.3390/jmse12061005
|
| [14] |
Cai, Y., Chen, L., Zhuang, X., Zhang, B. "Automated marine oil spill detection algorithm based on single-image generative adversarial network and YOLO-v8 under small samples." Mar. Pollut. Bull. 2024; 203: 116475.
https://doi.org/10.1016/j.marpolbul.2024.116475
|
| [15] |
Bui, N. A., Oh, Y., Lee, I. "Oil spill detection and classification through deep learning and tailored data augmentation." Int. J. Appl. Earth Obs. Geoinf. 2024; 129: 103845.
https://doi.org/10.1016/j.jag.2024.103845
|
Cite This Article
-
APA Style
Ekedebe, N. (2026). Towards Automated Environmental Monitoring Using YOLOv8 Variants. International Journal of Environmental Monitoring and Analysis, 14(5), 160-166. https://doi.org/10.11648/j.ijema.20261405.11
 Copy
|
Copy
|
 Download
ACS Style
Ekedebe, N. Towards Automated Environmental Monitoring Using YOLOv8 Variants. Int. J. Environ. Monit. Anal. 2026, 14(5), 160-166. doi: 10.11648/j.ijema.20261405.11
Copy
|
Download
AMA Style
Ekedebe N. Towards Automated Environmental Monitoring Using YOLOv8 Variants. Int J Environ Monit Anal. 2026;14(5):160-166. doi: 10.11648/j.ijema.20261405.11
Copy
|
Download
-
@article{10.11648/j.ijema.20261405.11,
  author = {Nnanna Ekedebe},
  title = {Towards Automated Environmental Monitoring Using YOLOv8 Variants},
  journal = {International Journal of Environmental Monitoring and Analysis},
  volume = {14},
  number = {5},
  pages = {160-166},
  doi = {10.11648/j.ijema.20261405.11},
  url = {https://doi.org/10.11648/j.ijema.20261405.11},
  eprint = {https://article.sciencepublishinggroup.com/pdf/10.11648.j.ijema.20261405.11},
  abstract = {Oil spills in the Niger Delta pose a severe environmental threat, yet existing detection methods remain slow, manual and unsuitable for large-scale continuous monitoring. While existing studies have applied individual YOLOv8 variants to oil spill detection, no prior study has systematically benchmarked YOLOv8n, YOLOv8s and YOLOv8m under identical conditions framed around Niger Delta deployment constraints. This study benchmarks three YOLOv8 variants nano, small and medium trained and evaluated under identical conditions. The dataset used is a publicly available Oil Spill Detection dataset from Roboflow Universe, comprising 2,567 images across four classes: object, rainbow, sheen and truecolor. The models were evaluated on a held-out test set of 72 images using mAP@50, mAP@50-95, Precision, Recall and Inference Speed. It was found that YOLOv8m achieved the highest accuracy at 81.95% mAP@50, while YOLOv8n achieved the fastest inference at 6.2ms with 68.66% mAP@50, and YOLOv8s offered no clear advantage over nano. YOLOv8n is recommended for resource-constrained deployment given its speed advantage, while YOLOv8m is recommended where computational resources allow, given its superior accuracy. These findings show that deep learning based detection is a viable and practical approach for automated environmental monitoring in the Niger Delta region, offering a better pathway toward localized, scalable oil spill surveillance in a region that has lacked such tools, helping guide faster cleanup response.},
 year = {2026}
}
Copy
|
Download
-
TY  - JOUR
T1  - Towards Automated Environmental Monitoring Using YOLOv8 Variants
AU  - Nnanna Ekedebe
Y1  - 2026/09/18
PY  - 2026
N1  - https://doi.org/10.11648/j.ijema.20261405.11
DO  - 10.11648/j.ijema.20261405.11
T2  - International Journal of Environmental Monitoring and Analysis
JF  - International Journal of Environmental Monitoring and Analysis
JO  - International Journal of Environmental Monitoring and Analysis
SP  - 160
EP  - 166
PB  - Science Publishing Group
SN  - 2328-7667
UR  - https://doi.org/10.11648/j.ijema.20261405.11
AB  - Oil spills in the Niger Delta pose a severe environmental threat, yet existing detection methods remain slow, manual and unsuitable for large-scale continuous monitoring. While existing studies have applied individual YOLOv8 variants to oil spill detection, no prior study has systematically benchmarked YOLOv8n, YOLOv8s and YOLOv8m under identical conditions framed around Niger Delta deployment constraints. This study benchmarks three YOLOv8 variants nano, small and medium trained and evaluated under identical conditions. The dataset used is a publicly available Oil Spill Detection dataset from Roboflow Universe, comprising 2,567 images across four classes: object, rainbow, sheen and truecolor. The models were evaluated on a held-out test set of 72 images using mAP@50, mAP@50-95, Precision, Recall and Inference Speed. It was found that YOLOv8m achieved the highest accuracy at 81.95% mAP@50, while YOLOv8n achieved the fastest inference at 6.2ms with 68.66% mAP@50, and YOLOv8s offered no clear advantage over nano. YOLOv8n is recommended for resource-constrained deployment given its speed advantage, while YOLOv8m is recommended where computational resources allow, given its superior accuracy. These findings show that deep learning based detection is a viable and practical approach for automated environmental monitoring in the Niger Delta region, offering a better pathway toward localized, scalable oil spill surveillance in a region that has lacked such tools, helping guide faster cleanup response.
VL  - 14
IS  - 5
ER  -
Copy
|
Download





 Share This Article
 Twitter
 Linked In
 Facebook