Ensuring access to water and sanitation for all on the one hand, and ensuring sustainable and equitable management of water resources on the other hand, is one of the objectives for sustainable development. In the department of Bongouanou, most of the population's drinking water is supplied by groundwater contained in granite and schist basement aquifers This study delineates potential groundwater recharge zones in the Bongouanou department through an integrated geospatial and multi-criteria decision-making (MCDM) approach. The methodology combines remote sensing and GIS-based multi-criteria analysis with hydrochemical validation. Satellite imagery, base maps, and hydrochemical data were used to generate thematic layers representing the main factors controlling groundwater recharge, including slope, drainage density, lithology, fracture density, soil type, rainfall, and land use/land cover. These layers were weighted and overlaid to produce a groundwater recharge potential map. The results show that high recharge potential zones cover approximately 45% of the study area, while medium and low-to-moderate potential zones account for 33% and 21%, respectively. The reliability of the generated recharge potential map was validated using chloride concentration data. The development of a large-scale hydrogeological map of potential recharge zones for the fractured aquifers of Bongouanou, based on the integration of multiple datasets and methods, highlights the value of combining diverse sources of information.
| Published in | International Journal of Environmental Monitoring and Analysis (Volume 14, Issue 1) |
| DOI | 10.11648/j.ijema.20261401.14 |
| Page(s) | 31-43 |
| Creative Commons |
This is an Open Access article, distributed under the terms of the Creative Commons Attribution 4.0 International License (http://creativecommons.org/licenses/by/4.0/), which permits unrestricted use, distribution and reproduction in any medium or format, provided the original work is properly cited. |
| Copyright |
Copyright © The Author(s), 2026. Published by Science Publishing Group |
Map, Recharge Zones, Fracturing Density, Aquifer
Factors | Hydrogeological properties influencing recharge potential |
|---|---|
Lithology | Involved in the recharge process of fractured aquifers, it determines the compactness and state of alteration of the rock, and provides important information on the infiltration capacity of geological formations. |
Fractures | Gives an indication of the degree of fracturing in the rock. Fracture density mapping is therefore very useful in identifying potential recharge zones in fractured basement environments. |
Drainage | In hydrogeology, it is well known that the denser the drainage network, the greater the runoff and therefore the lower the recharge. |
Landcover | Vegetation cover improves recharge by confining water in the soil, preventing evaporation. |
Floor type/ Floor thickness | Water infiltration through deep underground layers depends on soil type and thickness. When clay content is high, soils are better at retaining surface water than at infiltrating it. If these soils are rich in sandy elements, the percolation time is controlled by their thickness. |
Slopes | Slopes are inversely proportional to aquifer recharge potential. Steep slopes accelerate water runoff. |
Factors | Hydrogeological properties | ||||
|---|---|---|---|---|---|
Lithology | Lateritic Armor Fluvial vases and sands | Very good Good | 10 8 | 3,5 | 35 28 |
Swampy Metasiltite and meta-arenite Medium | Moderate | 6 | 21 | ||
Granitoids | Bad | 2 | 7 | ||
landcover | Water retention | Very good | 10 | 2,5 | 25 |
Degraded forest | Good | 8 | 20 | ||
Culture and Fallow Land | Good | 8 | 20 | ||
Savannah | Moderate | 6 | 15 | ||
Bare soil/habitat | Bad | 2 | 5 | ||
Types of soils | Ferralitic cuirasses | Very good | 10 | 2,5 | 25 |
Hydromorphic soil | Good | 8 | 20 | ||
Reworked soils | Good | 8 | 20 | ||
Indian Suns | Bad | 2 | 5 | ||
Drainage | Very strong | Very good | 10 | 2 | 20 |
High | Good | 8 | 16 | ||
Average | Moderate | 5 | 10 | ||
Weak | Poor | 3 | 6 | ||
Very weak | Bad | 1 | 2 | ||
Fracturing | Very strong | Very good | 10 | 2 | 20 |
High | Good | 8 | 16 | ||
Average | Moderate | 5 | 10 | ||
Weak | Poor | 3 | 6 | ||
Very weak | Bad | 1 | 2 | ||
Inclination | Very strong | Very good | 2 | 1,5 | 3 |
High | Good | 4 | 6 | ||
Average | Moderate | 6 | 9 | ||
Weak | Poor | 8 | 12 | ||
Very weak | Bad | 10 | 15 | ||
ENVI | Environment for Visualizing Images |
ROI | Region of Interest |
NIR | Near-Infrared |
SWIR | Shortwave Infrared |
OLI | Operational Land Imager |
MCDM | Multi-criteria Decision-making |
PCA | Principal Component Analysis |
| [1] | Okoundé, K. J. E. Ringo, F. A. Kélomé, C. N. Ouassa, P. Adjoa, M. H. A. Vissin, W. (2022). Evaluation of the Physico-Chemical Quality and Potability of Groundwater Consumption in Department of Collines at Benin. Journal of Geoscience and Environment Protection, 10, 29-48. |
| [2] | Şimşek, C. Demirkesen, A. C. Baba, A. Kumanlıoğlu, A. Durukan, S. Aksoy, N. Demirkıran, Z. Hasözbek, A. Murathan, A. Tayfur, G. (2020). Estimation groundwater total recharge and discharge using GIS-integrated water level fluctuation method: a case study from the Alaşehir alluvial aquifer Western Anatolia, Turkey. Arabian Journal of Geosciences 13: 143. |
| [3] | Dalin, C. Taniguchi, M. Green, T. R. (2019). Unsustainable groundwater use for global food production and related international trade. Global Sustainability 2, e12, 1–11. |
| [4] | Farchouni, E. A. Hadri, A. Fakır, Y. Ouarani, M. Azaroual, M. Kchikach, A. 2025. Mapping groundwater recharge potential zones in a semi-arid, anthropogenically modified mountainous basin. Scientific African Volume 30, e03025, |
| [5] | FAO (2024). Food and Agriculture Organization of the United Nations: Global Water and Agriculture Information System (AQUASTAT). |
| [6] | De Graaf, I. E. M. Gleeson, T. van-Beek, L. P. H. (2019). Nature; London Vol. 574, |
| [7] | Fatemeh, K. Sida, L. de Graaf, I. (2025). Global groundwater sustainability: a critical review of strategies and future pathways. Hydrology, Volume 657, 133060. |
| [8] | Ajjur, S. B. & Baalousha, H. M. (2021). A review on implementing managed aquifer recharge in the Midle East and North Africa region: methods, progress and challenges. Water International, 46(4), 578 604. |
| [9] | Schleiff, M. J. Aitken, I. Alam, M. A. et al (2021) Community health workers at the dawn of a new era: 6. Recruitment, training and continuing education. Health research policy and systems 19, Article n 113. |
| [10] | Assemian, A. E. Kouame, K. F. Djagoua, E. V. Affian, K. Jourda, J. P. R. Miessan, A. Lasm, T. Biemi, J. (2013) Study of the impact of climate variability on water resources in a humid tropical environment: Case of the Bongouanou department (Eastern Côte d'Ivoire). Water Sciences Review. Vol. 26, No 3. Pp 247-261. |
| [11] | Xiujuan, L. Sugai, G. Wenli, L. Guifu, Q. Zhiyuan, T. (2022). Temporal and spatial evolution of the lakes on the Bashang plateau over nearly 30 years. Journal of Water Resource and Protection, Vol. 14 No. 10, |
| [12] | Haghiabi, A. H. JMohammadzadeh-Habili, J. Parsaie, A. (2018). Development of an evaluation method for velocity distribution over cylindrical weirs using doublet. S0955-5986(17)30314-X. |
| [13] | Bakker, M. Bartholomeus, R. P. Ferre, T. P. A. (2013). "Groundwater recharge: processes and quantification" Preface. Hydrol Earth Syst Sc, 17(7): 2653-2655. |
| [14] | INS. Socio-demographic and economic data for localities, final results by locality, N’zi Comoe region. General Population and Housing Census (RGPH). 2021, INS. |
| [15] | Brou, R. K. Adiaffi, B. Loukou, G. H. K. Kacou, P. Kra, C. K. Ayezou, F. N. K. (2025). Spatiotemporal Analysis of Land Use Changes in the Bongouanou Department (1989-2018). American Journal of Environmental Protection, Volume 14, Issue 6, |
| [16] | Shaban, A. (2003). Study of the hydrogeology of western Lebanon: Use of remote sensing. PhD thesis, Bordeaux 1 University, 202 pp. |
| [17] | Hobbs, W. H. (1904). Lineaments of the Atlantic Border Region. Geological Society. American Bulletin, 15, 483-506. |
| [18] | Hsin-Fu, Y. Cheng-Haw, L. Kuo-Chin, H. Po-Sun C. (2009). GIS for assessment of groundwater recharge potential zone. Environ Geol (2009) 58: 185-195. |
| [19] | Sekouba, O. Gnangui, C. A. Akpa, L. Y. Mahaman, B. S. Kouame, K. F. Therrien, R. (2017). Identification of potential recharge zones for fractured aquifers in the N'zo watershed (Western Ivory Coast): contribution of GIS and remote sensing. European Scientific Journal, edition Vol. 13, No. 3, p 194-197. |
| [20] | Cocker, F. Vodounou, J. B. and Yabi, J. (2020). Mapping the groundwater potential of the lower Oueme valley, southern Benin (West Africa). La Houille Blanche 2020, 2, p 74-85 |
| [21] | Yonas, G. H. Tesfa, G. A. (2021). Geospatial and multi-criteria decision approach of groundwater potential zone identification in Cuma sub-basin, Southern Ethiopia, Journal Heliyon p 3, 8. |
| [22] | Ake, G. E. Kouame, K. J. Koffi, A. B. and Jourda, J. P. (2018). Mapping potential recharge zones for the Bonoua aquifer (southeastern Côte d'Ivoire). Journal of Water Science, 31(2), 129-144. |
| [23] | Adel, Z. Ali, M. Mohamed, H. M. Amira, M. Lahcen, Z. Taupin, J. D, Chekirbane, A. Chenini, I. and Tarhouni, J. (2020). Using analytical hierarchy Process and multi-Influencing factors to map groundwater recharge zones in a semi-arid mediterranean coastal aquifer. Water 2020, p 12. |
| [24] | Makonyo, M. Msabi, M. M. (2021). Identification of groundwater potential recharge zones using GIS based multicriteria decision analysis: a case study of semi-arid midlands Manyara fractured aquifer, North Eastern Tanzania. Remote Sensing Applications: society and Environments, p 32. |
| [25] | Saaty, T. (1990). How to Make a Decision: The Analytic Hierarchy Process. E. J. O. R. p 48-1, 9-26. |
| [26] | Koudou, A. Adiaffi, B. Assoma, T. V. Sombo, A. P. Amani, E. M. E & Biemi, J (2013). Design of a decision support tool for groundwater prospecting in the basement zone of southeastern Ivory Coast Geo-Eco-Trop, 37, (2): 211-226. |
| [27] | Haman, D. J. B. Ewodo, M. G. Ombolo, A. Fantong, F. W. Messi, G. (2022). Geospatial and multicriteria decision approach in the identification of potential groundwater recharge zones: case of the Mayo Bocki watershed in Northern Cameroon. Review of the Academy of Sciences of Cameroon Vol. 18 No. 1. |
| [28] | Jofack, S. V. (2016). Mapping groundwater potentialities in the highlands of West Cameroon: Contribution of remote sensing, GIS and neural networks. PhD thesis, Universite Felix Houphouet Boigny, p 116. |
| [29] | Adiaffi B. (2008). Contribution of isotopic geochemistry, hydrochemistry, and remote sensing to the understanding of aquifers in the basement-sedimentary basin contact zone of southeastern Côte d'Ivoire. Unique PhD thesis at Université Paris-Sud, Faculty of Sciences, Orsay, France, 189 p. |
| [30] | Assoma, T. V. Adiaffi, B. and Koudou, A. (2012). Contribution of Remote Sensing, Multicriteria Analysis and GIS for Mapping Recharge Areas of the Coastal Aquifers in Southeast Ivory Coast. American Journal of Scientific Research, 80: 112-125. |
| [31] | Chantry, G. Favreau, G. Travi, Y. (2003). Estimation of groundwater recharge rates in semi-arid zones using the chloride balance method (CBM). Final report submitted in partial fulfillment of the requirements for the Diploma of Advanced Studies in Integrated Water Resources Management. P 14-16. |
| [32] | Assemian, A. E. Kouame, D. A. Mobio, A. B. H. Kouamelan, A. N. Koudou, A. Kouadio, B. H. Dibi H. Therrien R. Razack M. (2014). Application of remote sensing and multicriteria analysis methods to the spatial study of groundwater potentials of a basement aquifer in a humid tropical region of West Africa: the case of Bongouanou department, eastern Ivory Coast. Photo-interpretation european journal of allie remonte sensing. 2014, No 3. pp 121-136. |
| [33] | Scanlon, B. R. Healy, and P. Cook (2002), Choosing appropriate techniques for quantifying. |
| [34] | Lu, T. Luo, P. Wang, J. Lu, Y. Huo, A. Liu, L. (2025) Soil salinity accumulation and groundwater degradation due to overexploitation over a recent 40-year period in the Yaoba oasis, China. Research on soils and soil cultivation, Volume 248, 106398, |
| [35] | Huang, X. Yao, R. Zhang, Y. Li, X. Yu, Z. Guo, H. (2025). Data-driven prediction modeling of groundwater quality using integrated machine learning in Pinggu Basin, China. Journal of Hydrology: Regional Studies, Volume 62, 102812, |
| [36] | Bekele, S. M. Geremew, G. B. Ayele, E. G. (2024). Estimation of Annual and Seasonal Groundwater Recharge byUsing Wetspass-M and Chloride Mass-Balance Methods, UpperBilate Catchment, Rifty Valley Basin, Ethiopia. Advances in Civil Engineering Volume, 31, |
APA Style
Adiaffi, B., Konan, B. R., Kacou, P., Loukou, G. H. K., Ayezou, F. K. N., et al. (2026). Mapping and Assessment of Groundwater Recharge Zones in the Bongouanou Aquifer (Moronou Region). International Journal of Environmental Monitoring and Analysis, 14(1), 31-43. https://doi.org/10.11648/j.ijema.20261401.14
ACS Style
Adiaffi, B.; Konan, B. R.; Kacou, P.; Loukou, G. H. K.; Ayezou, F. K. N., et al. Mapping and Assessment of Groundwater Recharge Zones in the Bongouanou Aquifer (Moronou Region). Int. J. Environ. Monit. Anal. 2026, 14(1), 31-43. doi: 10.11648/j.ijema.20261401.14
@article{10.11648/j.ijema.20261401.14,
  author = {Bernard Adiaffi and Brou Richmond Konan and Prisca Kacou and Gbele Hermann Kouame Loukou and Florent Koffi N'da Ayezou and Christophe Kobenan Kra},
  title = {Mapping and Assessment of Groundwater Recharge Zones in the Bongouanou Aquifer (Moronou Region)},
  journal = {International Journal of Environmental Monitoring and Analysis},
  volume = {14},
  number = {1},
  pages = {31-43},
  doi = {10.11648/j.ijema.20261401.14},
  url = {https://doi.org/10.11648/j.ijema.20261401.14},
  eprint = {https://article.sciencepublishinggroup.com/pdf/10.11648.j.ijema.20261401.14},
  abstract = {Ensuring access to water and sanitation for all on the one hand, and ensuring sustainable and equitable management of water resources on the other hand, is one of the objectives for sustainable development. In the department of Bongouanou, most of the population's drinking water is supplied by groundwater contained in granite and schist basement aquifers This study delineates potential groundwater recharge zones in the Bongouanou department through an integrated geospatial and multi-criteria decision-making (MCDM) approach. The methodology combines remote sensing and GIS-based multi-criteria analysis with hydrochemical validation. Satellite imagery, base maps, and hydrochemical data were used to generate thematic layers representing the main factors controlling groundwater recharge, including slope, drainage density, lithology, fracture density, soil type, rainfall, and land use/land cover. These layers were weighted and overlaid to produce a groundwater recharge potential map. The results show that high recharge potential zones cover approximately 45% of the study area, while medium and low-to-moderate potential zones account for 33% and 21%, respectively. The reliability of the generated recharge potential map was validated using chloride concentration data. The development of a large-scale hydrogeological map of potential recharge zones for the fractured aquifers of Bongouanou, based on the integration of multiple datasets and methods, highlights the value of combining diverse sources of information.},
 year = {2026}
}
TY  - JOUR
T1  - Mapping and Assessment of Groundwater Recharge Zones in the Bongouanou Aquifer (Moronou Region)
AU  - Bernard Adiaffi
AU  - Brou Richmond Konan
AU  - Prisca Kacou
AU  - Gbele Hermann Kouame Loukou
AU  - Florent Koffi N'da Ayezou
AU  - Christophe Kobenan Kra
Y1  - 2026/02/04
PY  - 2026
N1  - https://doi.org/10.11648/j.ijema.20261401.14
DO  - 10.11648/j.ijema.20261401.14
T2  - International Journal of Environmental Monitoring and Analysis
JF  - International Journal of Environmental Monitoring and Analysis
JO  - International Journal of Environmental Monitoring and Analysis
SP  - 31
EP  - 43
PB  - Science Publishing Group
SN  - 2328-7667
UR  - https://doi.org/10.11648/j.ijema.20261401.14
AB  - Ensuring access to water and sanitation for all on the one hand, and ensuring sustainable and equitable management of water resources on the other hand, is one of the objectives for sustainable development. In the department of Bongouanou, most of the population's drinking water is supplied by groundwater contained in granite and schist basement aquifers This study delineates potential groundwater recharge zones in the Bongouanou department through an integrated geospatial and multi-criteria decision-making (MCDM) approach. The methodology combines remote sensing and GIS-based multi-criteria analysis with hydrochemical validation. Satellite imagery, base maps, and hydrochemical data were used to generate thematic layers representing the main factors controlling groundwater recharge, including slope, drainage density, lithology, fracture density, soil type, rainfall, and land use/land cover. These layers were weighted and overlaid to produce a groundwater recharge potential map. The results show that high recharge potential zones cover approximately 45% of the study area, while medium and low-to-moderate potential zones account for 33% and 21%, respectively. The reliability of the generated recharge potential map was validated using chloride concentration data. The development of a large-scale hydrogeological map of potential recharge zones for the fractured aquifers of Bongouanou, based on the integration of multiple datasets and methods, highlights the value of combining diverse sources of information.
VL  - 14
IS  - 1
ER  -
Laboratory of Soil, Water and Geomaterials Sciences, Felix Houphouët-Boigny University, Abidjan, Côte d’Ivoire
Biography: Bernard Adiaffi, Doctor at Laboratory of Soil Sciences Water and Geomaterial of Felix Houphouët Boigny d’Abidjan-Cocody University (UFHB). He works in groundwater field, likes isotopic for water datation. He is currently participating in the DREEMES-CI project (Dynamics of Recharge and Threats to the Quantity and Quality of Groundwater Resources in the Coastal Sedimentary Basin of Southern Ivory Coast in a Context of Climate Change and Increased Demographic Pressure). He is author of several publications.
Geological and Mining Sciences Training and Research Department, Man Polytechnic University, Man, Côte d’Ivoire;Laboratory of Soil, Water and Geomaterials Sciences, Felix Houphouët-Boigny University, Abidjan, Côte d’Ivoire
Biography: Brou Richmond Konan is a Researcher at the Polytechnic University of Man (COTE d’IVOIRE). He is an environmental hydrogeologist defending his Doctorate thesis in October 2023 on a transdisciplinary term including the carcinogenic effects of Polycyclic Aromatic Hydrocarbons (PAHs) collected in air-rainwater-groundwater on population health. His scientific work has been supported by institutions such as the Strategic Support Program for Scientific Research and the Fund for Science (PASRES), Technology and Innovation. He has participated in some projects including PASMU with LASMES team led by Professor Veronique YOBOUE and recently, he is participating in the DREEMES-CI project with Professor Christelle MARLIN and Bernard ADIAFFI. He is the author of certain publications including source of PAHs in rainwater and effect on population health. Since July 2023, Dr Brou has been the recipient of the MOPGA (Make Our Planet Great) Scholarship where he collaborates with Professor Laure MALLERET from the University of AIX-MARSEILLE to study PAHs contained in dust.

Laboratory of Soil, Water and Geomaterials Sciences, Felix Houphouët-Boigny University, Abidjan, Côte d’Ivoire
Biography: Prisca Kacou, She holds a Master's degree in Hydrogeology from Felix Houphouët Boigny and a Professional Degree in Marketing Management and Communication. She has worked on water quality and land use in the Bongouanou region. Today, she is Brand and Corporate Social Responsibility at Guaranty Trust Bank in Côte d'Ivoire, where she is responsible for organizing social responsibility activities.

Geological and Mining Sciences Training and Research Department, Man Polytechnic University, Man, Côte d’Ivoire
Biography: Gbele Hermann Kouame Loukou is a Lecturer-Researcher at the Polytechnic University of Man (Côte d’Ivoire). He holds a PhD in Earth Sciences, with a specialization in Applied Geophysics, obtained in 2024 from Felix Houphouët-Boigny University (Côte d’Ivoire). His research focuses on basement aquifer characterization, geophysical exploration for groundwater resources, hydrodynamic modeling, and the sustainable management of water resources. His scientific work has been supported by institutions such as the Strategic Support Program for Scientific Research and the Fund for Science, Technology and Innovation. He has presented his research findings at the National Office for Drinking Water and has actively participated in the Geoscience Days, national scientific conferences, and several capacity-building workshops. He is the author of several indexed scientific publications and conference papers. Alongside his research activities, he supervises Master’s students and contributes to scientific projects with socio-economic impact in the fields of hydrogeology, mining, and quarry resources.

Laboratory of Soil, Water and Geomaterials Sciences, Felix Houphouët-Boigny University, Abidjan, Côte d’Ivoire
Biography: Florent Koffi N'da Ayezou is an Ivorian researcher and doctoral student in hydrogeochemistry at Felix Houphouët-Boigny University in Cocody (Côte d’Ivoire), within the doctoral program in Science, Technology, and Sustainable Agriculture (FD-STAD), attached to the Earth Sciences research team Earth Sciences. His research focuses on assessing the sources and health risks associated with metallic and organic pollutants, particularly polycyclic aromatic hydrocarbons (PAHs), in the groundwater of the Continental Terminal in southern Côte d'Ivoire. He is currently participating in the DREEMES-CI project (Dynamics of Recharge and Threats to the Quantity and Quality of Groundwater Resources in the Coastal Sedimentary Basin of Southern Ivory Coast in a Context of Climate Change and Increased Demographic Pressure), led by Professor Christelle MARLIN (Paris-Saclay University) and Dr. Bernard ADIAFFI (Felix Houphouët-Boigny University).

Laboratory of Soil, Water and Geomaterials Sciences, Felix Houphouët-Boigny University, Abidjan, Côte d’Ivoire
Biography: Christophe Kobenan Kra is a PhD candidate at the Doctoral School of Science, Technology and Sustainable Agriculture (ED-STAD) of Felix Houphouët-Boigny University, Cocody-Abidjan, Côte d’Ivoire. He is an environmental hydrogeologist whose transdisciplinary doctoral research focuses on assessing the health impacts of Volatile Organic Compounds (VOCs) and Trace Metal Elements (TMEs) in surface waters on exposed populations. He has been an active participant in the DREEMES-CI project, under the supervision of Professor Christelle Marlin, which investigates the dynamics and quality of water resources in tropical environments. He is the author of a recent scientific publication on the chemical characterization of surface waters, and co-author of a study on the mapping of fracture aquifer recharge zones, reflecting his strong commitment to the sustainable management and protection of water resources.

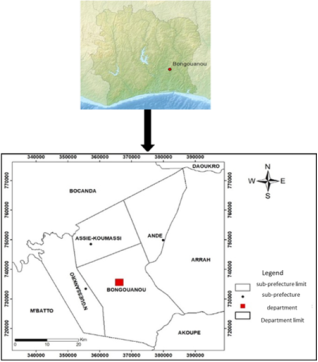
Figure 1. Geographical location of Bongouanou department.
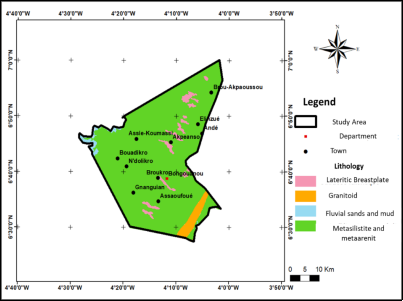
Figure 2. Geological map of Bongouanou department.
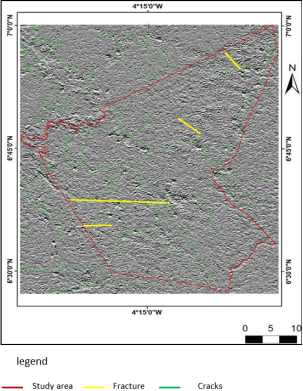
Figure 3. Filtered image with lineament extraction.
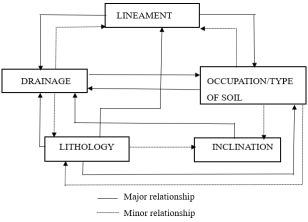
Figure 4. Diagram of interactions between factors [19].
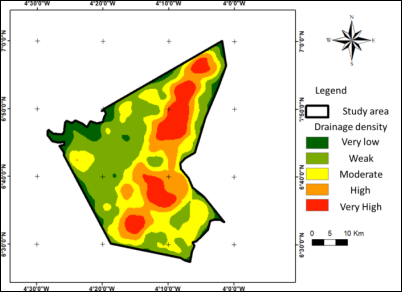
Figure 5. Drainage density map.
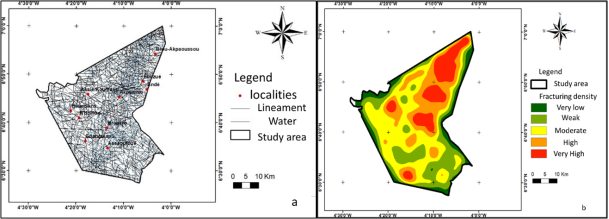
Figure 6. Fracturing density map.
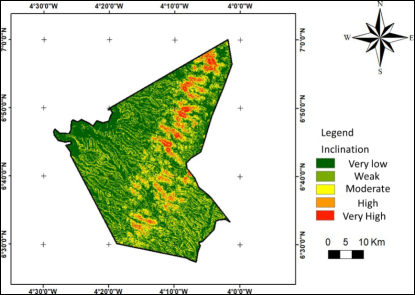
Figure 7. Inclinaion map.
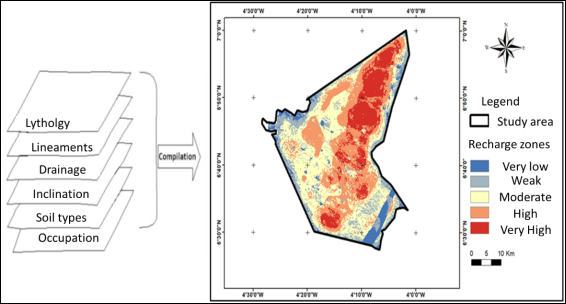
Figure 8. Summary map of potential recharge zones in Bongouanou department.
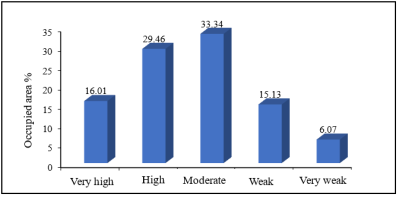
Figure 9. Percentage of potential recharge zone classes.
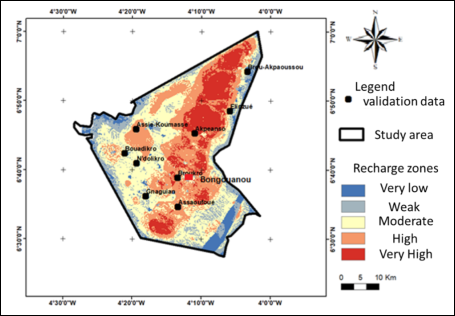
Figure 10. Validation map.
Information

