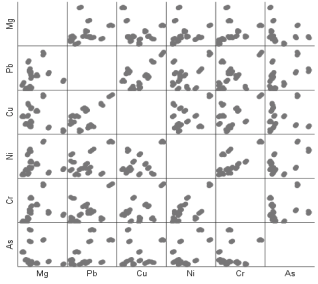
Water resources occupy a vital position regarding the source of human hope for longevity and significant shortfalls on the strive towards sustainable development globally. Host communities to quarry companies without a water treatment plant are greatly affected by use of untreated water. This research highlights statistical evaluation and quality analysis of water resources around a quarry site in FCT Nigeria. The study engaged biological assay, physiological and chemical analysis to quantify contamination levels in the water resources and obtained data were subjected statistically using Pearson’s Correlation, descriptive statistics, Levene’s test for homogeneity and one–way analysis. The physiochemical analysis revealed the water resources to have high turbidity value in 58.3% of sampled population while nitrate concentration and electrical conductivity value were very low. The bioassay revealed presence of coliform bacteria in 100% of sampled population while thermotolerance count discovered disease-causing-pathogens in 41.7% of sampled population. Chemical analysis revealed that Pb, Cr, Ni and As were 91.7%, 83.3% 100% and 100% above recommended permissible limits for sampled population. These results suggests that water resources in this study is unsafe and holds a health-treat with regards to the contaminations inherent in them. Statistical evaluation revealed average positive linear relationship between heavy metal concentration suggesting close relationship of contamination source. Observed strong positive linear relationship between lead and copper, nickel and chromium as well as nickel and arsenic in the scatterplot depicts same source of contamination.
| Published in | International Journal of Environmental Chemistry (Volume 8, Issue 1) |
| DOI | 10.11648/j.ijec.20240801.13 |
| Page(s) | 18-29 |
| Creative Commons |
This is an Open Access article, distributed under the terms of the Creative Commons Attribution 4.0 International License (http://creativecommons.org/licenses/by/4.0/), which permits unrestricted use, distribution and reproduction in any medium or format, provided the original work is properly cited. |
| Copyright |
Copyright © The Author(s), 2024. Published by Science Publishing Group |
Water Resource, Heavy Metal, Potable Water, Coliform Group, Contamination, NSDWQ
Sample source | Nitrate (mg/L) | Turbidity (NTU) | pH | EC (µS/cm) | Mg (mg/L) | Pb (mg/L) | Cu (mg/L) | Ni (mg/L) | Cr (mg/L) | As (mg/L) |
|---|---|---|---|---|---|---|---|---|---|---|
MCB | 20.13 | 1.79 | 6.70 | 8.71 | 0.158 | 0.006 | 0.173 | 0.117 | 0.011 | 0.164 |
AHD | 25.21 | 3.00 | 7.20 | 8.92 | 0.222 | 0.215 | 0.151 | 0.151 | 0.206 | 0.625 |
KQW | 19.21 | 5.32 | 6.90 | 7.21 | 0.510 | 0.480 | 0.699 | 0.546 | 0.685 | 0.663 |
KQR | 18.31 | 4.71 | 6.80 | 8.23 | 0.221 | 0.271 | 0.130 | 0.446 | 0.199 | 0.917 |
KTB | 20.23 | 5.03 | 6.70 | 9.32 | 0.080 | 0.098 | 0.308 | 0.052 | 0.010 | 0.362 |
KWW | 30.11 | 8.83 | 6.90 | 6.92 | 0.959 | 0.108 | 0.082 | 0.130 | 0.121 | 0.052 |
KBS | 24.25 | 6.21 | 7.30 | 7.21 | 0.628 | 0.204 | 0.109 | 0.077 | 0.198 | 0.121 |
KSP | 21.11 | 5.88 | 7.50 | 8.88 | 0.258 | 0.031 | 0.216 | 0.244 | 0.426 | 0.082 |
KTS | 31.12 | 4.71 | 6.90 | 9.21 | 0.159 | 0.013 | 0.315 | 0.355 | 0.095 | 0.142 |
KTW | 18.93 | 5.03 | 6.70 | 9.31 | 0.391 | 0.178 | 0.403 | 0.209 | 0.307 | 0.078 |
QSS | 17.21 | 5.35 | 6.80 | 10.01 | 0.173 | 0.351 | 0.527 | 0.061 | 0.086 | 0.101 |
QJS | 25.14 | 2.37 | 6.90 | 8.75 | 0.238 | 0.186 | 0.449 | 0.147 | 0.277 | 0.113 |
Sample source | Total Microbial Count (CFU/ml) | Total Coliforms Count (CFU/ml) | Total Thermotolerance Count (CFU/ml) |
|---|---|---|---|
MCB | 63.0 | 04 | 00 |
AHD | 58.0 | 05 | 01 |
KQW | 77.0 | 08 | 00 |
KQR | 62.0 | 06 | 00 |
KTB | 82.0 | 06 | 00 |
KWW | 92.0 | 02 | 00 |
KBS | 98.0 | 03 | 00 |
KSP | 76.0 | 04 | 00 |
KTS | 44.0 | 11 | 03 |
KTW | 78.0 | 09 | 02 |
QSS | 93.0 | 07 | 02 |
QJS | 87.0 | 07 | 01 |
NSDWQ limit | -- | 10 | 0 |
N | Minimum | Maximum | Mean | Std. Deviation | |
|---|---|---|---|---|---|
Magnesium (mg/L) | 36 | 0.04 | 0.98 | 0.3292 | 0.25133 |
Lead (mg/L) | 36 | 0.01 | 0.48 | 0.1756 | 0.13423 |
Copper (mg/L) | 36 | 0.04 | 0.70 | 0.2985 | 0.18323 |
Nickel (mg/L) | 36 | 0.05 | 0.57 | 0.2157 | 0.15142 |
Chromium (mg/L) | 36 | 0.01 | 0.69 | 0.2145 | 0.18414 |
Arsenic (mg/L) | 36 | 0.04 | 0.94 | 0.2894 | 0.28390 |
Valid N (listwise) | 36 |
Mg (mg/L) | Pb (mg/L) | Cu (mg/L) | Ni (mg/L) | Cr (mg/L) | As (mg/L) | ||
|---|---|---|---|---|---|---|---|
Mg (mg/L) | Pearson Correlation | 1 | 0.212 | -0.229 | 0.038 | 0.263 | -0.181 |
Sig. (2-tailed) | 0.214 | 0.179 | 0.824 | 0.122 | 0.290 | ||
N | 36 | 36 | 36 | 36 | 36 | 36 | |
Pb (mg/L) | Pearson Correlation | 0.212 | 1 | 0.572** | 0.363* | 0.501** | 0.481** |
Sig. (2-tailed) | 0.214 | 0.000 | 0.029 | 0.002 | 0.003 | ||
N | 36 | 36 | 36 | 36 | 36 | 36 | |
Cu (mg/L) | Pearson Correlation | -0.229 | 0.572** | 1 | 0.344* | 0.488** | 0.028 |
Sig. (2-tailed) | 0.179 | 0.000 | 0.040 | 0.003 | 0.871 | ||
N | 36 | 36 | 36 | 36 | 36 | 36 | |
Ni (mg/L) | Pearson Correlation | 0.038 | 0.363* | 0.344* | 1 | 0.648** | 0.577** |
Sig. (2-tailed) | 0.824 | 0.029 | 0.040 | 0.000 | 0.000 | ||
N | 36 | 36 | 36 | 36 | 36 | 36 | |
Cr (mg/L) | Pearson Correlation | 0.263 | 0.501** | 0.488** | 0.648** | 1 | 0.239 |
Sig. (2-tailed) | 0.122 | 0.002 | 0.003 | 0.000 | 0.160 | ||
N | 36 | 36 | 36 | 36 | 36 | 36 | |
As (mg/L) | Pearson Correlation | -0.181 | 0.481** | 0.028 | 0.577** | 0.239 | 1 |
Sig. (2-tailed) | 0.290 | 0.003 | 0.871 | 0.000 | 0.160 | ||
N | 36 | 36 | 36 | 36 | 36 | 36 | |
**. Correlation is significant at the 0.01 level (2-tailed). | |||||||
*. Correlation is significant at the 0.05 level (2-tailed). | |||||||
Levene Statistic | df1 | df2 | Sig. | ||
|---|---|---|---|---|---|
Mg (mg/L) | Based on Mean | 0.347 | 11 | 24 | 0.964 |
Based on Median | 0.319 | 11 | 24 | 0.974 | |
Based on Median and with adjusted df | 0.319 | 11 | 23.120 | 0.974 | |
Based on trimmed mean | 0.349 | 11 | 24 | 0.964 | |
Pb (mg/L) | Based on Mean | 0.245 | 11 | 24 | 0.991 |
Based on Median | 0.265 | 11 | 24 | 0.987 | |
Based on Median and with adjusted df | 0.265 | 11 | 24.000 | 0.987 | |
Based on trimmed mean | 0.251 | 11 | 24 | 0.990 | |
Cu (mg/L) | Based on Mean | 0.273 | 11 | 24 | 0.986 |
Based on Median | 0.205 | 11 | 24 | 0.996 | |
Based on Median and with adjusted df | 0.205 | 11 | 24.000 | 0.996 | |
Based on trimmed mean | 0.272 | 11 | 24 | 0.986 | |
Ni (mg/L) | Based on Mean | 0.200 | 11 | 24 | 0.996 |
Based on Median | 0.083 | 11 | 24 | 1.000 | |
Based on Median and with adjusted df | 0.083 | 11 | 24.000 | 1.000 | |
Based on trimmed mean | 0.187 | 11 | 24 | 0.997 | |
Cr (mg/L) | Based on Mean | 0.220 | 11 | 24 | 0.994 |
Based on Median | 0.253 | 11 | 24 | 0.989 | |
Based on Median and with adjusted df | 0.253 | 11 | 23.881 | 0.989 | |
Based on trimmed mean | 0.225 | 11 | 24 | 0.993 | |
As (mg/L) | Based on Mean | 0.200 | 11 | 24 | 0.996 |
Based on Median | 0.083 | 11 | 24 | 1.000 | |
Based on Median and with adjusted df | 0.083 | 11 | 24.000 | 1.000 | |
Based on trimmed mean | 0.187 | 11 | 24 | 0.997 | |
Sum of Squares | df | Mean Square | F | Sig. | ||
|---|---|---|---|---|---|---|
Mg (mg/L) | Between Groups | 2.204 | 11 | 0.200 | 700.309 | 0.000 |
Within Groups | 0.007 | 24 | 0.000 | |||
Total | 2.211 | 35 | ||||
Pb (mg/L) | Between Groups | 0.625 | 11 | 0.057 | 232.349 | 0.000 |
Within Groups | 0.006 | 24 | 0.000 | |||
Total | 0.631 | 35 | ||||
Cu (mg/L) | Between Groups | 1.170 | 11 | 0.106 | 531.963 | 0.000 |
Within Groups | 0.005 | 24 | 0.000 | |||
Total | 1.175 | 35 | ||||
NI (mg/L) | Between Groups | 0.799 | 11 | 0.073 | 466.785 | 0.000 |
Within Groups | 0.004 | 24 | 0.000 | |||
Total | 0.802 | 35 | ||||
Cr (mg/L) | Between Groups | 1.181 | 11 | 0.107 | 424.643 | 0.000 |
Within Groups | 0.006 | 24 | 0.000 | |||
Total | 1.187 | 35 | ||||
As (mg/L) | Between Groups | 2.817 | 11 | 0.256 | 1646.454 | 0.000 |
Within Groups | 0.004 | 24 | 0.000 | |||
Total | 2.821 | 35 | ||||
Control Variables | Mg (mg/L) | Pb (mg/L) | Cu (mg/L) | Ni (mg/L) | Cr (mg/L) | As (mg/L) | |
|---|---|---|---|---|---|---|---|
Mg (mg/L) | Correlation | 1.000 | 0.212 | -0.240 | 0.037 | 0.263 | -0.237 |
Significance (2-tailed) | . | 0.221 | 0.165 | 0.833 | 0.127 | 0.171 | |
df | 0 | 33 | 33 | 33 | 33 | 33 | |
Pb (mg/L) | Correlation | 0.212 | 1.000 | 0.617 | 0.367 | 0.501 | 0.590 |
Significance (2-tailed) | 0.221 | . | 0.000 | 0.030 | 0.002 | 0.000 | |
df | 33 | 0 | 33 | 33 | 33 | 33 | |
Cu (mg/L) | Correlation | -0.240 | 0.617 | 1.000 | 0.456 | 0.522 | 0.320 |
Significance (2-tailed) | 0.165 | 0.000 | . | 0.006 | 0.001 | 0.061 | |
df | 33 | 33 | 0 | 33 | 33 | 33 | |
Ni (mg/L) | Correlation | 0.037 | 0.367 | 0.456 | 1.000 | 0.662 | 0.577 |
Significance (2-tailed) | 0.833 | 0.030 | 0.006 | . | 0.000 | 0.000 | |
df | 33 | 33 | 33 | 0 | 33 | 33 | |
Cr (mg/L) | Correlation | 0.263 | 0.501 | 0.522 | 0.662 | 1.000 | 0.297 |
Significance (2-tailed) | 0.127 | 0.002 | 0.001 | 0.000 | . | 0.083 | |
df | 33 | 33 | 33 | 33 | 0 | 33 | |
As (mg/L) | Correlation | -0.237 | 0.590 | 0.320 | 0.577 | 0.297 | 1.000 |
Significance (2-tailed) | 0.171 | 0.000 | 0.061 | 0.000 | 0.083 | . | |
df | 33 | 33 | 33 | 33 | 33 | 0 | |
MCB | Borehole Tap-Water Near Kaidi Quarry Mosque (0.5km Away) |
AHD | Army Post Service Housing Development Quarters Karshi (1.6km Away) |
KQW | Quarry Company Main Water Point Kaidi (0km Away) |
KQR | Quarry Company Residential Area Water Point Kaidi (0.5km Away) |
KTB | Borehole Tap-Water Within Karshi Town (2km Away) |
KWW | Well-Water Near Market Within Karshi Town (2km Away) |
KBS | Stream Water Point A Karshi Town (0.2km Away) |
KSP | Stream Water Point B Karshi Town (2km Away) |
KTS | Stream Water C Karshi Town (2km Away, Opposite Direction) |
KTW | Karshi Town Well-Water (1.5km Away) |
QSS | Stream Water Near Service Station, Quarry Junction (1km Away) |
QJS | Stream Water Near Service Station, Quarry Junction (1.6km Away) |
| [1] | Samuel, A.; Brizuela, J.; Chang, K.-C.; Lin, C.-T. (2022) Design and Investigation of an Effective Solar Still Applicable to Remote Islands. Water, 14, 703. |
| [2] | Yirdaw Meride and Bamlaku Ayenew (2016) Drinking water quality assessment and its effects on residents’ health in Wondo genet campus, Ethiopia. Environmental Systems Research, 5: 1 |
| [3] | Isiaka Adio Hassan (2022) Metals Distribution in the Water bodies around Quarry Sites in Ogun State, Nigeria. Ethiopian Journal of Environmental Studies & Management 15(4): 511–531, |
| [4] | Sukri A. S., Saripuddin M., Karama R., Talanipa N. R., Kadir A. and Aswad N. H. (2023) Utilization Management to Ensure Clean Water Sources in Coastal Areas, Journal of Human, Earth, and Future. 4(1), 23–35 |
| [5] | Ogbonnaya J. E. and Phil-Eze P. O. (2020) Challenges of Quarrying Activities for Sustainable Quality Water Resources in Abakaliki and Environs. Journal of Geography Meteorology and Environment. 3(1): 61-83. |
| [6] | Mahmood A. R., Alheety M. A., Asker M. M. M., Tareq A. Z. and Karadag A. (2003) Saccharine based carbonyl multi-walled carbon nanotubes: novel modification, characterization and its ability for removing Cd(II) and Cu(II) from soil and environmental water samples. Journal of Physics: Conf. Series 1294(2019) 052003 |
| [7] | Frank Aneke and Joy Adu (2023) Adsorption of Heavy Metals from Contaminated Water using Leachate Modular Tower. Civil Engineering Journal. 9(6), 1522–1541 |
| [8] | Nguyen T. G. and Huynh N. T. H. (2023) Characterization of groundwater quality and human health risk assessment. Civil Engineering Journal. 9(3), 618–628 |
| [9] | Oni O., Alewo I. A., Chindo I., Hassan F. and Oguike R. S. (2020) Water Quality Assesement Using the Wagtech Palintest Kit a Case Study of Some Selected Communities in Darazo Local Government Area, Bauchi State, Nigeria. Journal of Applied Chemistry 13(10): 04-13 |
| [10] | End of leaded fuel use; a milestone for multilateralism. Press release, 2021 |
| [11] | Nickel in Drinking-Water Background document for the WHO GDWQ, May 2021. |
| [12] | Odera Chukwumaijem Okafor and Chima Njoku (2021) Water Quality as Affected by Quarry Activities in Ebonyi State, Nigeria. Research Square |
| [13] | Maria-Nefeli Georgaki and Marianna Charalambous (2023) Toxic chromium in water and the effects on the human body: a systematic review. Journal of Water and Health, 21(2): 207 |
| [14] | Akanang H., Oguike R., Emmanuel J., Onimisi S. and Buba T. (2020) Bioaccumulation of heavy metals using ectomycorrhizal fungi as sequestering agent for vegetables grown in wastewater-irrigated farms. Science Forum (Journal of Pure and Applied Sciences) 20: 166–173. |
| [15] | Jiang L., He P., Chen J., Liu Y., Liu D., Qin G. and Tan N. (2016) Magnesium Levels in Drinking Water and Coronary Heart Disease Mortality Risk: A Meta-Analysis. Nutrients, 8: 5 |
| [16] | Division of Environmental and Community Health, magnesium in drinking water: questions and answers for consumers, Environmental and Occupational Health Program, Massachusetts, updated 13 August, 2018. |
| [17] | World Health Organization (WHO) (2018). Guidelines for Drinking Water Quality. 3rd Edition. World Health Organization, Geneva, Switzerland. |
| [18] | Bandmann, O., Weiss, K. H. and Kaler, S. G (2015) Wilson’s disease and other neurological copper disorders. Lancet Neurol., 14(1): 103-113. |
| [19] | Nigerian Industrial Standard, Nigerian Standard for Drinking Water Quality, Report of Technical Committee August, 2015. |
| [20] | Alheety M. A., Raoof A., Al-Jibori S. A., Karadag A., Khaleel A. I., Akbas H. and Uzun O. (2019) Eco-friendly C60-SESMP-Fe3O4 inorganic nanocomposite as high-performance adsorbent for magnetic removal of arsenic from crude oil and water samples. Material and Chemistry and Physics 231: 292–300 |
| [21] | Sievert C. (2020) Interactive Web-based Data visualization with R, plotly and shiny. Chapman and Hall/CRC |
| [22] | Kononenko I. and Kukar M. (2007) Machine learning and Data mining. Machine learning and Data mining. |
APA Style
Oguike, R. S., Oni, O., Adam, H. Y. (2024). Statistical Evaluation and Quality Analysis of Water Resources Around Quarry Site in Abuja Suburban Nigeria. International Journal of Environmental Chemistry, 8(1), 18-29. https://doi.org/10.11648/j.ijec.20240801.13
ACS Style
Oguike, R. S.; Oni, O.; Adam, H. Y. Statistical Evaluation and Quality Analysis of Water Resources Around Quarry Site in Abuja Suburban Nigeria. Int. J. Environ. Chem. 2024, 8(1), 18-29. doi: 10.11648/j.ijec.20240801.13
AMA Style
Oguike RS, Oni O, Adam HY. Statistical Evaluation and Quality Analysis of Water Resources Around Quarry Site in Abuja Suburban Nigeria. Int J Environ Chem. 2024;8(1):18-29. doi: 10.11648/j.ijec.20240801.13
@article{10.11648/j.ijec.20240801.13,
  author = {Raphael Shadai Oguike and Omolara Oni and Hamza Yusuf Adam},
  title = {Statistical Evaluation and Quality Analysis of Water Resources Around Quarry Site in Abuja Suburban Nigeria
},
  journal = {International Journal of Environmental Chemistry},
  volume = {8},
  number = {1},
  pages = {18-29},
  doi = {10.11648/j.ijec.20240801.13},
  url = {https://doi.org/10.11648/j.ijec.20240801.13},
  eprint = {https://article.sciencepublishinggroup.com/pdf/10.11648.j.ijec.20240801.13},
  abstract = {Water resources occupy a vital position regarding the source of human hope for longevity and significant shortfalls on the strive towards sustainable development globally. Host communities to quarry companies without a water treatment plant are greatly affected by use of untreated water. This research highlights statistical evaluation and quality analysis of water resources around a quarry site in FCT Nigeria. The study engaged biological assay, physiological and chemical analysis to quantify contamination levels in the water resources and obtained data were subjected statistically using Pearson’s Correlation, descriptive statistics, Levene’s test for homogeneity and one–way analysis. The physiochemical analysis revealed the water resources to have high turbidity value in 58.3% of sampled population while nitrate concentration and electrical conductivity value were very low. The bioassay revealed presence of coliform bacteria in 100% of sampled population while thermotolerance count discovered disease-causing-pathogens in 41.7% of sampled population. Chemical analysis revealed that Pb, Cr, Ni and As were 91.7%, 83.3% 100% and 100% above recommended permissible limits for sampled population. These results suggests that water resources in this study is unsafe and holds a health-treat with regards to the contaminations inherent in them. Statistical evaluation revealed average positive linear relationship between heavy metal concentration suggesting close relationship of contamination source. Observed strong positive linear relationship between lead and copper, nickel and chromium as well as nickel and arsenic in the scatterplot depicts same source of contamination.
},
 year = {2024}
}
TY  - JOUR
T1  - Statistical Evaluation and Quality Analysis of Water Resources Around Quarry Site in Abuja Suburban Nigeria

AU  - Raphael Shadai Oguike
AU  - Omolara Oni
AU  - Hamza Yusuf Adam
Y1  - 2024/06/29
PY  - 2024
N1  - https://doi.org/10.11648/j.ijec.20240801.13
DO  - 10.11648/j.ijec.20240801.13
T2  - International Journal of Environmental Chemistry
JF  - International Journal of Environmental Chemistry
JO  - International Journal of Environmental Chemistry
SP  - 18
EP  - 29
PB  - Science Publishing Group
SN  - 2640-1460
UR  - https://doi.org/10.11648/j.ijec.20240801.13
AB  - Water resources occupy a vital position regarding the source of human hope for longevity and significant shortfalls on the strive towards sustainable development globally. Host communities to quarry companies without a water treatment plant are greatly affected by use of untreated water. This research highlights statistical evaluation and quality analysis of water resources around a quarry site in FCT Nigeria. The study engaged biological assay, physiological and chemical analysis to quantify contamination levels in the water resources and obtained data were subjected statistically using Pearson’s Correlation, descriptive statistics, Levene’s test for homogeneity and one–way analysis. The physiochemical analysis revealed the water resources to have high turbidity value in 58.3% of sampled population while nitrate concentration and electrical conductivity value were very low. The bioassay revealed presence of coliform bacteria in 100% of sampled population while thermotolerance count discovered disease-causing-pathogens in 41.7% of sampled population. Chemical analysis revealed that Pb, Cr, Ni and As were 91.7%, 83.3% 100% and 100% above recommended permissible limits for sampled population. These results suggests that water resources in this study is unsafe and holds a health-treat with regards to the contaminations inherent in them. Statistical evaluation revealed average positive linear relationship between heavy metal concentration suggesting close relationship of contamination source. Observed strong positive linear relationship between lead and copper, nickel and chromium as well as nickel and arsenic in the scatterplot depicts same source of contamination.

VL  - 8
IS  - 1
ER  -
Chemistry Department, Abubakar Tafawa Balewa University Bauchi, Bauchi, Nigeria
Chemistry Department, Abubakar Tafawa Balewa University Bauchi, Bauchi, Nigeria
Statistics Department, Abubakar Tafawa Balewa University Bauchi, Bauchi, Nigeria
Information