Abstract
A plenty of research investigations have demonstrated the pivotal role that the consumer price index (CPI) plays in the comprehensive assessment and understanding of inflationary trends within an economy. For prediction of consumer price index, researchers have used a variety of empirical methodologies and sophisticated statistical techniques, each of which come up with inherent challenges regarding their generalizability. To solve issues with generalizability, researchers developed artificial intelligence and machine learning. In this work, the sophisticated machine learning models such as decision tree (DT), random forest (RF), and gradient boosting (GB)s have integrated together to develop super learner machine learning to enhance the predictive capabilities concerning the consumer price index robustly. To ensure the optimization of these models, rigorous methodologies such as K-fold cross-validation and an extensive grid search for hyperparameter tuning are meticulously applied to refine the model's performance. The efficiency and predictive performance of the proposed super learner model are then critically compared with those of other base models, thereby establishing a benchmark for assessing improvements in predictive accuracy. Remarkably, the suggested super learner model demonstrated superior prediction capabilities, achieving highest coefficient of determination (R2) of 98.3%, with the lowest mean absolute error of 2.89%, a mean absolute percentage error of 2.60%, and a root mean square error of 3.46%. Moreover, the interpretability of the model's predictions is significantly explained through the application of Shapley additive explanations. This method explains the essential factors that influence the consumer price index in the context of Ethiopia. The super learner model that has been developed possesses the versatility and accuracy necessary for application across various economic sectors, enabling researchers and practitioners to predict dependent variables with both precision and efficiency, thus facilitating informed decision-making in financial planning.
Keywords
Consumer Price Index, Super Learner, Decision Tree, Random Forest, Gradient Boosting
1. Introduction
The Consumer Price Index (CPI) functions as an essential economic metric, embodying fluctuations in consumer expenditure patterns on various goods and services while simultaneously providing a quantifiable assessment of inflationary or deflationary trends within an economy
. The trends exhibited by the CPI, which may indicate either an escalation in prices, commonly referred to as inflation, or a reduction in prices, known as deflation, exert significant influence on broader economic stability and the prospects for growth within the economic landscape. If unchecked, sustained increases in the CPI can catalyze hyperinflation, a phenomenon that can lead to severe economic instability, whereas deflation, frequently instigated by a decrease in consumer demand, may trigger economic downturns and exacerbate unemployment rates
.
In light of these implications, policymakers must utilize the CPI as a foundational benchmark upon which to adjust fiscal policies, recalibrate welfare initiatives, and make judicious decisions regarding social security and wage policies, with the overarching goal of fostering stability within the economic framework
| [3] | Budiastuti, S., Prastowo, N., & Hapsari, D. (2017). Forecasting the inflation rate in Indonesia using neural networks and genetic algorithms. Procedia Computer Science, 124, 292-299.
https://doi.org/10.1016/j.procs.2017.12.159 |
[3]
. Considering the increasingly volatile nature of the global economy, the importance of precise CPI forecasting has escalated dramatically, particularly in the context of designing fiscal policies and investment strategies that are responsive to the myriad inflationary pressures that may arise, as indicated by the research of
.
In terms of traditional methodologies employed for CPI prediction, one can identify time series approaches such as the Autoregressive Integrated Moving Average (ARIMA) alongside machine learning models, including Artificial Neural Networks (ANN) and Support Vector Machines (SVM). Comparative studies examining these various methodologies have illuminated that ANN exhibits a capacity to produce lower prediction errors relative to ARIMA, as established by
while both ANN and SVM have demonstrated their efficacy in forecasting CPI trends within countries including, but not limited to, Indonesia and China, as documented by
. Nonetheless, it is important to recognize that these predictive techniques frequently face significant constraints regarding their generalizability, often encountering challenges when attempting to adapt to novel datasets, thus presenting a formidable obstacle to achieving precise CPI forecasting across diverse economic contexts.
The recent advancements in the fields of artificial intelligence (AI) and machine learning (ML) have engendered the emergence of more intricate data-driven models capable of revealing complex interrelationships among economic variables without the necessity of adhering to rigid statistical assumptions
| [7] | Alemayehu, H., Ziyad, F., Wogaso, D. et al. Extreme gradient boosting for prediction of surface roughness of mild steel AISI 1018 under dry and air-assisted machining. Int J Adv Manuf Technol 140, 3337–3354 (2025).
https://doi.org/10.1007/s00170-025-16352-7 |
| [8] | Ziyad F, Aman S, Alemayehu H, Hailu A. Optimizing SI Engine Performance and Emissions with Gasoline-Ethanol and Gasoline-Methanol Blends. Clean Energy and Sustainability 2026, 4, 10003. https://doi.org/10.70322/ces.2026.10003 |
[7, 8]
. This newfound flexibility has significantly bolstered the popularity of ML applications in the realm of economic forecasting, encompassing a wide range of areas from credit scoring to the analysis of stock market trends, as articulated by
| [9] | Hassani, H., Silva, E., Antonakakis, N., Filis, G., & Gupta, R. (2013). Forecasting inflation with singular spectrum analysis. Journal of Forecasting, 32(4), 333-345.
https://doi.org/10.1002/for.1255 |
[9]
. Ensemble learning techniques, which include methodologies such as random forests, gradient boosting, and stacking, amalgamate the predictions derived from multiple models, thereby enhancing the accuracy of forecasts while simultaneously mitigating model bias and variance
| [10] | Kander, A., Malanima, P., & Warde, P. (2011). Power to the people: Energy in Europe over the last five centuries. Princeton University Press. |
[10]
. By synthesizing predictions from a diverse array of base models, ensemble methodologies are adept at capturing intricate, nonlinear relationships that are frequently overlooked when employing single-model strategies. In addition, stacking ensemble techniques introduce a meta-model designed to integrate and synthesize the outputs of the base models, thereby further augmenting the overall prediction accuracy
| [11] | Mangalathu, S., Hallowell, M. R., & Dey, D. (2020). Interpretable machine learning models for predicting economic indicators. Expert Systems with Applications, 160, 113694. https://doi.org/10.1016/j.eswa.2020.113694 |
[11]
. Despite their proven effectiveness in a variety of forecasting domains, it is noteworthy that ensemble learning methods have not been fully leveraged in the specific context of CPI forecasting.
This scholarly investigation presents an innovative ensemble-based framework, referred to as the "super learner" model, which has been meticulously designed to enhance the precision of Consumer Price Index (CPI) forecasting within the specific context of Ethiopia. This model strategically amalgamates various predictive techniques, namely decision trees (DT), random forests (RF), and gradient boosting (GB) methodologies, all of which have been rigorously optimized through the application of cross-validation processes. Unlike a multitude of prior research efforts that have approached machine learning (ML) models as inscrutable “black boxes,” this particular study adopts the Shapley additive explanations (SHAP) approach, thereby facilitating the interpretability of the predictions generated. By utilizing SHAP, the study provides valuable insights into how individual features contribute to the CPI predictions, thus offering a framework that can significantly assist policymakers in deciphering the underlying dynamics that drive inflationary or deflationary trends
| [12] | Mukhamediev, R., Voloshin, V., & Ruchkina, T. (2022). Application of machine learning in economic time series forecasting: Methodological developments and case studies. Computational Economics, 60, 1023-1042.
https://doi.org/10.1007/s10614-022-10299-2 |
[12]
. The integration of SHAP with sophisticated machine learning techniques within this framework is specifically aimed at addressing the existing deficiencies found in current CPI prediction models, ultimately providing a transparent and effective instrument for conducting economic analyses relevant to Ethiopia.
Forecasts of the Consumer Price Index serve as critical tools that empower governments to proactively identify and anticipate potential inflationary or deflationary pressures, thereby enabling them to make informed adjustments to their spending, taxation, and social welfare policies in response to these economic indicators. For instance, in situations where CPI predictions signal the onset of inflation, policymakers may opt to curtail government expenditure or implement tax increases, with the explicit aim of decreasing aggregate demand and thereby circumventing excessive price increases. Conversely, in scenarios where deflation is projected, government interventions may include strategies such as heightened spending or tax reductions, which are designed to invigorate economic activity and stimulate consumer demand
| [13] | Papadopoulos, M. (2023). The role of explainable AI in fiscal policy and economic modeling. Journal of Artificial Intelligence Research, 78, 345-372.
https://doi.org/10.1613/jair.4556 |
| [14] | Riofrío, J., Moya, M., & Romero, C. (2020). Using artificial intelligence in the prediction of consumer price index in volatile markets. Applied Economics, 52(16), 1732-1741.
https://doi.org/10.1080/00036846.2019.1678721 |
[13, 14]
. The accuracy of CPI forecasts plays a pivotal role in facilitating timely adjustments to fiscal policies that promote economic stability, thereby allowing for proactive budgeting for welfare programs and responsive social security policies that aim to mitigate the risks associated with inflation
| [15] | Schnepf, E., & Richardson, C. (2009). Economic indicators and their importance in policy planning. Journal of Economic Policy, 29(1), 23-41. https://doi.org/10.1002/ejep.1049 |
| [16] | Settlements, B. (2009). Key economic indicators and global financial stability: A review. Bank for International Settlements, 48(3), 34-58. |
[15, 16]
.
Ensemble learning methodologies present a substantial enhancement in the accuracy of economic forecasting by effectively integrating predictions derived from multiple algorithms, which collectively serve to minimize the errors typically associated with singular models. These advanced techniques are particularly advantageous when applied to complex economic datasets that exhibit high levels of interdependency and volatility, characteristics that are emblematic of CPI data. Models such as random forests and gradient boosting capitalize on the aggregation of insights from numerous decision trees, thereby enabling a more comprehensive understanding of nonlinear trends and a reduction in predictive errors
| [17] | Sutton, C. D. (2005). 11 - Classification and Regression Trees, Bagging, and Boosting. In C. R. Rao, E. J. Wegman, & J. L. B. T.-H. of S. Solka (Eds.), Data Mining and Data Visualization (Vol. 24, pp. 303-329). Elsevier.
https://doi.org/10.1016/S0169-7161(04)24011-1 |
[17]
. The inherent accuracy and robustness of ensemble learning approaches are particularly beneficial in the context of CPI forecasting, where the necessity for precise predictions is paramount for sound fiscal policymaking and effective economic planning
| [18] | Volkova, V., Polyakova, N., & Vovk, M. (2019). Ensemble machine learning techniques in economic applications: Comparative analysis. Journal of Financial Economics, 25(2), 147-162. https://doi.org/10.1002/jfec.1108 |
[18]
.
The Shapley Additive Explanations (SHAP) framework significantly enhances the interpretability of machine learning models by methodically deconstructing predictions into their feature contributions, thereby providing a clearer understanding of the model's decision-making process. In the realm of CPI forecasting, the application of SHAP can illuminate the influence of various factors, including but not limited to energy costs, consumer demand levels, and import prices, on the predictions related to inflation. This level of interpretability is of utmost importance for policymakers, as it equips them with the necessary insights to comprehend the fundamental drivers of CPI trends and subsequently make more informed and effective policy decisions
| [19] | Wakjira, T. G., Ibrahim, M., Ebead, U., & Alam, M. S. (2022). Explainable machine learning model and reliability analysis for flexural capacity prediction of RC beams strengthened in flexure with FRCM. Engineering Structures, 255, 113903. |
[19]
. The transparency afforded by SHAP ensures that the predictions generated by machine learning models are in alignment with broader economic policy objectives, thereby fostering greater trust and confidence in the forecasting models driven by artificial intelligence
| [20] | Yadav, M. P., Sharif, T., Ashok, S., Dhingra, D., & Abedin, M. Z. (2023). Investigating volatility spillover of energy commodities in the context of the Chinese and European stock markets. Research in International Business and Finance, 65, 101948. https://doi.org/10.1016/j.ribaf.2023.101948 |
[20]
.
The Novel Contributions of the Study includes:
1) development of an AI-driven ML model to predict CPI using a super learner framework.
2) Application of advanced ML techniques (DT, RF, GB) within a robust ensemble model.
3) Innovation in ensemble learning by combining DT, RF, and GB models for CPI forecasting.
4) Use of SHAP for explaining the model’s predictions, enabling actionable insights for policymakers.
2. Materials and Methods
2.1. Research Scope
The super learner model's effectiveness in predicting Ethiopia's CPI was evaluated using historical economic data of Ethiopia from national and international sources, including the National Bank of Ethiopia, the Ministry of Finance, the World Bank, and the International Monetary Fund. This data-driven approach allowed for an accurate and comprehensive analysis of Ethiopia's economic factors affecting CPI from 1990 to 2023. This structured approach captures both the innovation and practical implications of the research, providing a clear framework for CPI prediction through the application of advanced machine learning and AI techniques.
2.2. Research Data
The collection of data utilized for this research study was meticulously gathered from a variety of reputable sources, which include the National Bank of Ethiopia (NBE), the Ministry of Finance, the Central Statistical Agency of Ethiopia, the World Bank, the International Monetary Fund, various academic research databases, as well as comprehensive surveys that were conducted by relevant institutions that possess specialized knowledge in the field.
2.3. Overview of Machine Learning Models
2.3.1. Super Learner Model
To synthesize a singular and considerably more robust predictive model, the innovative technique known as the super learner model strategically amalgamates multiple machine learning models, which are referred to as base learners, to enhance the overall performance of predictive analytics
| [21] | Weaver, R. (2010). Consumer Price Index (CPI) and its role in social welfare adjustments. Social Security Bulletin, 70(2), 1-13. https://doi.org/10.2139/ssrn.2067414 |
| [22] | Ziyad F, Alemayehu H, Wogaso D, Dadi F, Badri M. Multi-objective optimization of machining parameters of mild steel AISI 1018 under compressed air-assisted cooling by using genetic algorithm. Int J Interact Des Manuf [Internet]. 2024; Available from: https://doi.org/10.1007/s12008-024-02134-0 |
| [23] | Ziyad, F., Alemayehu, H., Wogaso, D. et al. Prediction of surface roughness of tempered steel AISI 1060 under effective cooling using super learner machine learning. Int J Adv Manuf Technol 136, 1421–1437 (2025).
https://doi.org/10.1007/s00170-024-14952-3 |
[21-23]
. The super learner model that has been proposed and is the focus of this research is visually represented in
Figure 1, providing a clear illustration of the methodology employed. The approach incorporates K-fold cross-validation, specifically with K set to 10, to meticulously determine the optimal combination of these base learners by assigning a unique weight to each base learner in the process.
Subsequently, a prediction matrix is utilized as the foundational input to effectively fit a meta-model that is tasked with the prediction of the values associated with the target variables in the study. Within the framework of this research, potential base models considered for the super learner algorithm include gradient boosting (GB), random forest (RF), and decision tree (DT), each of which offers distinct advantages in predictive capability. As depicted in
Figure 1, linear regression (LR) was employed as the meta-model for this study, serving as the overarching framework that integrates the outputs of the various base learners to produce a cohesive and accurate predictive result.
Figure 1. Super learner model.
2.3.2. Decision Tree
A supervised learning model known as a decision tree (DT) has leaves that are linked to labels and branches that represent the choices that resulted in those labels. The data instances are divided based on feature characteristics or feature value thresholds at a tree branching. Because determining the ideal tree is computationally challenging, DT algorithms are greedy and produce good results with locally optimal choices. To achieve this, DT learning begins with the root node and builds the tree in stages, selecting which data attribute (feature) to employ for each node's data subset splitting
. The effectiveness of decisions is evaluated using gain measures, which measure how much they increase the purity of labels in following leaf nodes and, consequently, the model's overall predictive performance. Although DT models were created to handle multi-class classification tasks with discrete-valued attributes, they may also be used to tackle regression challenges with minor adjustments. They are renowned for their high degree of explainability and interpretability.
2.3.3. Random Forest
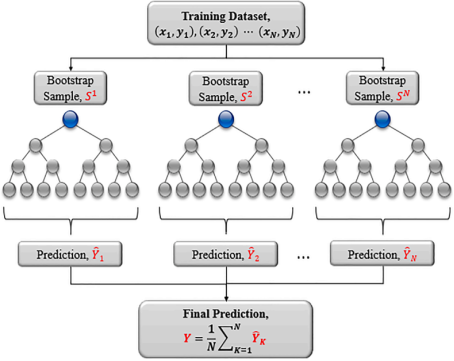
An ensemble machine learning technique called RF creates a large number of decision trees and then aggregates their output to produce a final prediction. To create stronger decision trees with superior prediction skills, each choice is based on the information gain or entropy principle for classification issues and the MSE for regression problems.
Figure 1 shows the depiction of RF. A randomly chosen subset of the i/p data and variables is used to train each tree in the RF. This enhances model generalization and lessens overfitting. RF does not have a single formula because it is an ensemble learning technique that generates forecasts by combining various decision trees. However, the fundamental idea is to build numerous decision trees by choosing a subset of attributes and samples at random, and then integrating their predictions to arrive at the final prediction
| [25] | Wulandari, D., Kurniawan, F., & Pratama, A. (2016). Comparison of ARIMA and artificial neural networks for inflation rate prediction. Procedia Computer Science, 72, 519-526. https://doi.org/10.1016/j.procs.2016.05.099 |
[25]
. See
Figure 2.
2.3.4. Gradient Boosting
A machine learning method called the gradient boosting algorithm combines several weak models to produce a more accurate prediction model. To determine the difference between the current forecast and the known target value, gradient boosting makes use of the residual notion. Following the calculation of the residual, the method maps the weak features to the residual and repeatedly pushes the model in the direction of the desired value
| [26] | Zhang, Y., & Li, X. (2012). Prediction of inflation rate in China using support vector machine and neural networks. International Journal of Business and Economics, 11(3), 215-225. Babenko, et al. (2021). Advances in Economic Modeling with Machine Learning Techniques. |
[26]
.
2.3.5. Hyperparameter Tuning
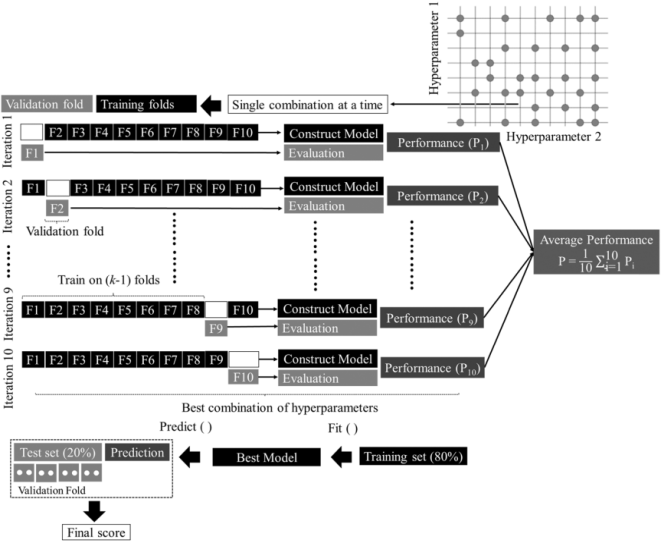
The choice of model parameters has a significant impact on the model's performance. Hyperparameter tuning or optimization, which is the process of looking for the best values of the hyperparameters, is used to choose the ideal hyperparameters. To effectively optimize the hyperparameters in this study, a grid search optimization technique is used. This optimization algorithm thoroughly looks for the best hyperparameter combinations, taking into account every possible combination of the user-defined hyperparameters, Furthermore, to solve the issue of overfitting, a trustworthy model must be validated using outside data that was not incorporated into the model's creation. K-fold cross-validation, a common method of identifying overfitting, is employed in this work to avoid overfitting, where K is the number of groups into which a given set of data is to be divided. This method randomly divides the data into K disjoint subsets with roughly the same amount of observations. The network is then fitted with the K-1 folds and verified using the remaining one-fold. As a result, every fold acts as a validation set. As illustrated in
Figure 3, the study used a widely utilized ten-fold (K = 10) cross-validation, which divides the data into ten groups
| [27] | Wakjira, T. G., Kutty, A. A., & Alam, M. S. (2024). A novel framework for developing environmentally sustainable and cost-effective ultra-high-performance concrete (UHPC) using advanced machine learning and multi-objective optimization techniques. Construction andBuildingMaterials, 416, 135114.
https://doi.org/10.1016/j.conbuildmat.2024.135114 |
| [28] | Ziyad, F., Alemayehu, H., Wogaso, D. et al. Advanced and explainable machine learning model for prediction of surface roughness of tempered steel AISI 1060. Sci Rep (2026).
https://doi.org/10.1038/s41598-026-52458-y |
[27, 28]
.
Figure 3. K-fold cross-validation.
3. Result and Discussion
3.1. Hyperparameter Optimization Results
Based on the optimization result of ML the DT maximum depth of the tree is 50. The RF number of the estimator is 100, the maximum depth of the tree is 40, the minimum sample leaf is 1, and minimum sample split is 1. For GB number of estimators is 100, the maximum depth of the tree is 10, learning rate is 0.1. For further see
Table 1 below.
Table 1. Optimized hyperparameters.
Model | Hyperparameter | Optimal value |
DT | Maximum depth of tree | 50 |
RF | Number of estimators | 100 |
Maximum depth of tree | 40 |
Minimum samples leaf | 1 |
Minimum samples split | 2 |
GB | Number of estimators | 100 |
Maximum depth of the tree | 10 |
Learning rate | 0.1 |
3.2. ML Performance
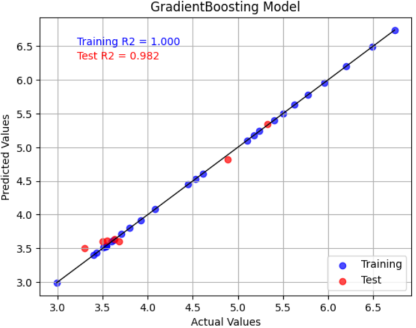
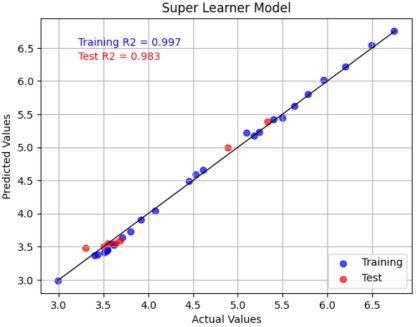
The performance of the ML model is quantified by using four different metrics in this study. Coefficient of determination (R
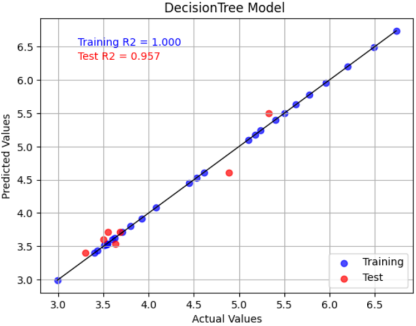
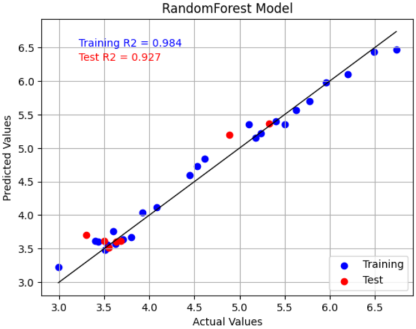
2), mean absolute error (MAE), root mean square error (RMSE), and mean absolute percentage error (MAPE) are main metrics. Based on
Figures 4, 5, 6, and
7 and
Table 2 below the R
2 of the super learner, GB, RF, and DT for the test data set is 98.3%, 98.2%, 92.7%, and 95.7% respectively. Based on the R
2 the super learner model outperformed all models followed by GB. The GB outperformed all the models except the super learner. The DT prediction performance is greater than that of RF, based on the R
2 of the test dataset RF model performs least as it suffers from cases of overfitting. The super learner > GB > DT> RF.
Figure 4. Scatter plot of DT.
Figure 5. Scatter plot of RF.
Figure 6. Scatter plot of GB.
Figure 7. Scatter plot of Super learner.
Table 2. Machine learning performance.
| Training | Test |
RMSE (%) | MAE (%) | MAPE (%) | R2 (%) | RMSE (%) | MAE (%) | MAPE (%) | R2 (%) |
DT | 0.00 | 0.00 | 0.00 | 100.0 | 15.20 | 13.29 | 3.20 | 95.7 |
RF | 13.65 | 10.70 | 2.50 | 98.4 | 19.70 | 13.91 | 3.64 | 92.7 |
GB | 0.00 | 0.00 | 0.00 | 100.0 | 10.71 | 9.40 | 2.48 | 98.2 |
Super Learner | 5.16 | 4.78 | 2.60 | 99.7 | 5.32 | 9.02 | 2.30 | 98.3 |
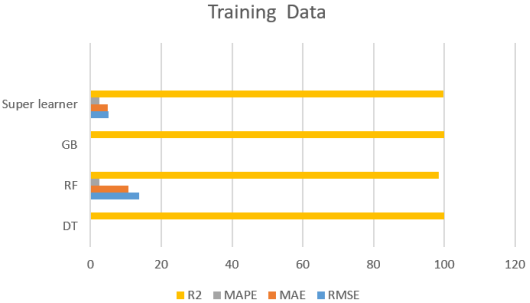
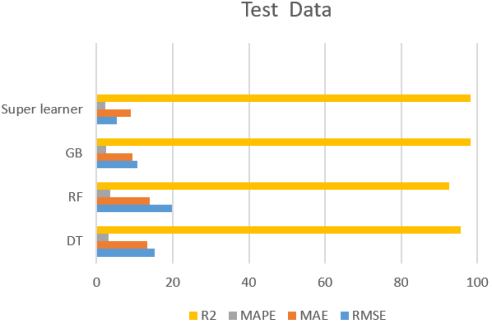
When comparing the performance of ML based on R
2 and RMSE, as shown in
Table 2 above and
Figures 8 and 9. The DT achieved R
2 of 100% for the training data set but for the test dataset by scoring R
2 of 95.7% it shows evidence of overfitting when predicting unseen data. Also, it has an RMSE of 0.00% on training data and 15.2% on the test dataset. The RF achieved an R
2 of 98.4% for the training dataset but for the test dataset, it achieved an R
2 of 92.7. When comparing with DT it has lesser R
2 for the training dataset and test dataset. This shows that DF higher generalization capability than RF. The RMSE of RF under the training dataset is 13.65% and 19.70% under the test dataset. The RF has a greater error than DT for both training and test datasets. The GB achieved R
2 100% which is equal to DT during training dataset prediction. Also, the GB achieved the highest R
2 of 98. 2% for the test data set. The prediction capability of GB is outperformed that of RF, and DT. This shows that GB has the highest prediction capability when predicting unseen data. Also, the RMSE of GB for the training dataset is 0.00% but for the test dataset, RMSE is 10.71%. GB has the least RMSE when compared to DT, and RF.
The super learner model was developed by combining DT, RF, and GB by using LR as a Meta model. The developed model achieved an R2 of 99.7% for the training dataset and 98.3% for the test dataset. It outperformed all models by scoring the highest R2 and lowest RMSE on the test dataset. The RMSE for the training dataset is 5.16% and for the test dataset it is 5.32%
Figure 8. Model performance on training data.
Figure 9. Model performance on test data.
3.3. Model Explainability Via the SHAP Approach
The unified SHAP technique is used in this study to explain the ML model's outputs and emphasize the key variables and how they interact to determine the consumer price index (CPI). This method assigns each factor its SHAP value, which is the average marginal contribution of all the factors. The most relevant factor is the one with the highest absolute SHAP value.
The degree of significance and the direction (positive or negative) of each factor's effect are indicated by the bar's length and color in
Figure 10. The external debt had the greatest impact, followed by general governmental expenditure and broad money supply as shown in
Figure 10. While general governmental expenditure demonstrated a negative effect, which contributed to the base value's decreases, broad money supply and external debt demonstrated positive influences, which raised the base value.
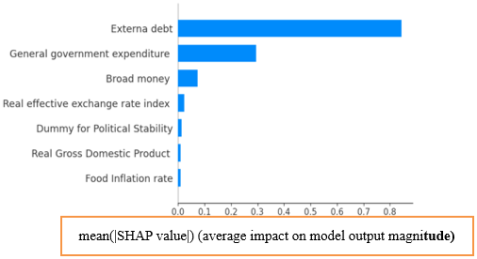
The average of each factor's absolute Shapley values throughout the whole dataset (in
Figure 11) is used to calculate the factors' global significance, and in
Figure 11, the factors are presented in decreasing order of importance. This graphic shows that the most important quality is external debt, which is general governmental expenditure. Broad money, on the other hand, is the least important characteristic.
Figure 10. Explanation of CPI. Explanation of CPI.
Figure 11. Global importance of independent factors.
4. Conclusion and Recommendations
4.1. Conclusion
There have been a lot of studies on predicting the CPI using traditional and artificial intelligence methodologies; however, there aren't many advanced and ensemble machine learning studies available. Using a variety of machine learning techniques, this study attempts to predict the CPI for the first time. To forecast the CPI, advanced and ensemble machine learning models such as DT, RF, and GB are integrated into a super learner after being evaluated and optimized. The use of a unified SHAP technique is investigated to rank the input features for CPI prediction and to explain the expected result. The following conclusions can be drawn from the study findings:
1) The boosted-based machine learning ensemble models that were developed show a high degree of accuracy in forecasting the CPI.
2) The gradient boosting and super learner models were the most accurate among the models that were examined; the DT and RF models came in second and third, respectively. The RF model performs the worst. Therefore, this study conclude that gradient boosting and super learner models were the most effective and reliable models for Consumer Price Index predicting in Ethiopia.
3) In terms of prediction, accuracy and generalizability, the super learner model outperformed all other models. This model is the most accurate one for the test dataset, with the lowest mean absolute error (9.02%), lowest mean absolute percentage error (2.30%), lowest root mean square error (5.32%), and greatest coefficient of determination (98.3%).
4) The SHAP results indicate that the external debt has the biggest effect on CPI, followed by general government expenditure, and broad money supply.
4.2. Recommendations
Based on the study findings, the following recommendations have been given to policymakers, government institutions and planning authorities of the country: Researchers should undertake further studies, and professionals such as scientists in these multidisciplinary fields (including economists, statisticians, and engineering specialists) should be involved.
1) Policymakers should use boosted machine learning models, particularly Gradient Boosting and Super Learning to get accurate prediction of Consumer Price Index and inflation trends.
2) The federal government and other regional agencies should integrate machine learning into their forecasting systems about national economic monitoring and policy decision making processes which will help them to improve their prediction accuracy and timely interventions.
3) The Gradient boosting and Super Learning Models achieved the best prediction performance of Consumer Price Index with lowest error rates and highest determination coefficient. Therefore, this study recommends that gradient boosting and super learner models were the most effective and reliable models for Consumer Price Index predicting in Ethiopia.
4) This study found that external debt has an impact on the Consumer Price Index. So, policymakers should be careful managing external borrowing and make sure that the borrowed money has been effectively used or injected into national economy and pay it back on time. This will help keep prices stable and minimize inflationary pressure.
5) Monetary authorities, particularly the National Bank of Ethiopia should closely regulate the money supply to keep prices stable and control inflation in the Ethiopian economy.
6) Researchers should use explainable artificial intelligence (XAI) techniques like SHAP to make machine learning models more transparent and easier to understand. This will help policymakers make decisions and use machine learning models in economic forecasting.
7) Future studies should include additional macroeconomic variables, like exchange rates, gas and oil prices, unemployment and political instability to make predictions more accurate and model generalizability.
Abbreviations
ABD | Adaptive Boosting |
ANN | Artificial Neural Network |
ANOVA | Analysis of Variance |
CPI | Consumer Price Index |
DT | Decision Tree |
GB | Gradient Boosting |
Author Contributions
Foad Mohammed: Conceptualization, Data curation, Methodology, Software, Writing – original draft
Abduselam Abdulahi Mohamed: Conceptualization, Data curation, Formal Analysis, Investigation, Methodology, Software, Validation, Visualization, Writing – original draft
Umar Aliyi: Conceptualization, Data curation, Methodology
Firi Ziyad: Conceptualization, Data curation, Methodology, Validation
Desalegn Wogaso: Investigation, Supervision
Habtamu Alemayehu: Conceptualization, Writing – review & editing
Getachew Semegn: Conceptualization, Writing – review & editing
Conflicts of Interest
The Authors declare no conflicts of interest.
References
| [1] |
Babenko, I., Larionova, A., Semenova, E., & Sosnovskikh, S. (2021). Advances in economic modeling with machine learning techniques. Economic Modelling, 95, 20-34.
https://doi.org/10.1016/j.econmod.2020.10.021
|
| [2] |
Breiman, L. (1996). Bagging predictors. Machine Learning, 24(2), 123-140.
https://doi.org/10.1007/BF00058655
|
| [3] |
Budiastuti, S., Prastowo, N., & Hapsari, D. (2017). Forecasting the inflation rate in Indonesia using neural networks and genetic algorithms. Procedia Computer Science, 124, 292-299.
https://doi.org/10.1016/j.procs.2017.12.159
|
| [4] |
Flood, I. (2008). A review of machine learning techniques for economic forecasting. Journal of Computational Economics, 32(4), 563-584.
https://doi.org/10.1007/s10614-008-9148-4
|
| [5] |
Ghoddusi, H., Creamer, G., & Rafizadeh, N. (2019). Machine learning in energy economics and finance: A review. Energy Economics, 81, 709-727.
https://doi.org/10.1016/j.eneco.2019.05.002
|
| [6] |
Gumbe, S., & Kaseke, N. (2011). Hyperinflation and deflation: The impacts on fiscal policy. African Journal of Economic and Management Studies, 2(2), 148-156.
https://doi.org/10.1108/20400701111165664
|
| [7] |
Alemayehu, H., Ziyad, F., Wogaso, D. et al. Extreme gradient boosting for prediction of surface roughness of mild steel AISI 1018 under dry and air-assisted machining. Int J Adv Manuf Technol 140, 3337–3354 (2025).
https://doi.org/10.1007/s00170-025-16352-7
|
| [8] |
Ziyad F, Aman S, Alemayehu H, Hailu A. Optimizing SI Engine Performance and Emissions with Gasoline-Ethanol and Gasoline-Methanol Blends. Clean Energy and Sustainability 2026, 4, 10003.
https://doi.org/10.70322/ces.2026.10003
|
| [9] |
Hassani, H., Silva, E., Antonakakis, N., Filis, G., & Gupta, R. (2013). Forecasting inflation with singular spectrum analysis. Journal of Forecasting, 32(4), 333-345.
https://doi.org/10.1002/for.1255
|
| [10] |
Kander, A., Malanima, P., & Warde, P. (2011). Power to the people: Energy in Europe over the last five centuries. Princeton University Press.
|
| [11] |
Mangalathu, S., Hallowell, M. R., & Dey, D. (2020). Interpretable machine learning models for predicting economic indicators. Expert Systems with Applications, 160, 113694.
https://doi.org/10.1016/j.eswa.2020.113694
|
| [12] |
Mukhamediev, R., Voloshin, V., & Ruchkina, T. (2022). Application of machine learning in economic time series forecasting: Methodological developments and case studies. Computational Economics, 60, 1023-1042.
https://doi.org/10.1007/s10614-022-10299-2
|
| [13] |
Papadopoulos, M. (2023). The role of explainable AI in fiscal policy and economic modeling. Journal of Artificial Intelligence Research, 78, 345-372.
https://doi.org/10.1613/jair.4556
|
| [14] |
Riofrío, J., Moya, M., & Romero, C. (2020). Using artificial intelligence in the prediction of consumer price index in volatile markets. Applied Economics, 52(16), 1732-1741.
https://doi.org/10.1080/00036846.2019.1678721
|
| [15] |
Schnepf, E., & Richardson, C. (2009). Economic indicators and their importance in policy planning. Journal of Economic Policy, 29(1), 23-41.
https://doi.org/10.1002/ejep.1049
|
| [16] |
Settlements, B. (2009). Key economic indicators and global financial stability: A review. Bank for International Settlements, 48(3), 34-58.
|
| [17] |
Sutton, C. D. (2005). 11 - Classification and Regression Trees, Bagging, and Boosting. In C. R. Rao, E. J. Wegman, & J. L. B. T.-H. of S. Solka (Eds.), Data Mining and Data Visualization (Vol. 24, pp. 303-329). Elsevier.
https://doi.org/10.1016/S0169-7161(04)24011-1
|
| [18] |
Volkova, V., Polyakova, N., & Vovk, M. (2019). Ensemble machine learning techniques in economic applications: Comparative analysis. Journal of Financial Economics, 25(2), 147-162.
https://doi.org/10.1002/jfec.1108
|
| [19] |
Wakjira, T. G., Ibrahim, M., Ebead, U., & Alam, M. S. (2022). Explainable machine learning model and reliability analysis for flexural capacity prediction of RC beams strengthened in flexure with FRCM. Engineering Structures, 255, 113903.
|
| [20] |
Yadav, M. P., Sharif, T., Ashok, S., Dhingra, D., & Abedin, M. Z. (2023). Investigating volatility spillover of energy commodities in the context of the Chinese and European stock markets. Research in International Business and Finance, 65, 101948.
https://doi.org/10.1016/j.ribaf.2023.101948
|
| [21] |
Weaver, R. (2010). Consumer Price Index (CPI) and its role in social welfare adjustments. Social Security Bulletin, 70(2), 1-13.
https://doi.org/10.2139/ssrn.2067414
|
| [22] |
Ziyad F, Alemayehu H, Wogaso D, Dadi F, Badri M. Multi-objective optimization of machining parameters of mild steel AISI 1018 under compressed air-assisted cooling by using genetic algorithm. Int J Interact Des Manuf [Internet]. 2024; Available from:
https://doi.org/10.1007/s12008-024-02134-0
|
| [23] |
Ziyad, F., Alemayehu, H., Wogaso, D. et al. Prediction of surface roughness of tempered steel AISI 1060 under effective cooling using super learner machine learning. Int J Adv Manuf Technol 136, 1421–1437 (2025).
https://doi.org/10.1007/s00170-024-14952-3
|
| [24] |
Wolpert, D. H. (1992). Stacked generalization. Neural Networks, 5(2), 241-259.
https://doi.org/10.1016/S0893-6080(05)80023-1
|
| [25] |
Wulandari, D., Kurniawan, F., & Pratama, A. (2016). Comparison of ARIMA and artificial neural networks for inflation rate prediction. Procedia Computer Science, 72, 519-526.
https://doi.org/10.1016/j.procs.2016.05.099
|
| [26] |
Zhang, Y., & Li, X. (2012). Prediction of inflation rate in China using support vector machine and neural networks. International Journal of Business and Economics, 11(3), 215-225. Babenko, et al. (2021). Advances in Economic Modeling with Machine Learning Techniques.
|
| [27] |
Wakjira, T. G., Kutty, A. A., & Alam, M. S. (2024). A novel framework for developing environmentally sustainable and cost-effective ultra-high-performance concrete (UHPC) using advanced machine learning and multi-objective optimization techniques. Construction andBuildingMaterials, 416, 135114.
https://doi.org/10.1016/j.conbuildmat.2024.135114
|
| [28] |
Ziyad, F., Alemayehu, H., Wogaso, D. et al. Advanced and explainable machine learning model for prediction of surface roughness of tempered steel AISI 1060. Sci Rep (2026).
https://doi.org/10.1038/s41598-026-52458-y
|
Cite This Article
-
APA Style
Mohammed, F., Mohamed, A. A., Aliyi, U., Ziyad, F., Wogaso, D., et al. (2026). An Investigation of Ensemble and Explainable Machine Learning Models for Consumer Price Index Prediction in Ethiopia: Evidence from 1990-2023. International Journal on Data Science and Technology, 12(3), 53-63. https://doi.org/10.11648/j.ijdst.20261203.11
 Copy
|
Copy
|
 Download
ACS Style
Mohammed, F.; Mohamed, A. A.; Aliyi, U.; Ziyad, F.; Wogaso, D., et al. An Investigation of Ensemble and Explainable Machine Learning Models for Consumer Price Index Prediction in Ethiopia: Evidence from 1990-2023. Int. J. Data Sci. Technol. 2026, 12(3), 53-63. doi: 10.11648/j.ijdst.20261203.11
Copy
|
Download
AMA Style
Mohammed F, Mohamed AA, Aliyi U, Ziyad F, Wogaso D, et al. An Investigation of Ensemble and Explainable Machine Learning Models for Consumer Price Index Prediction in Ethiopia: Evidence from 1990-2023. Int J Data Sci Technol. 2026;12(3):53-63. doi: 10.11648/j.ijdst.20261203.11
Copy
|
Download
-
@article{10.11648/j.ijdst.20261203.11,
  author = {Foad Mohammed and Abduselam Abdulahi Mohamed and Umar Aliyi and Firi Ziyad and Desalegn Wogaso and Habtamu Alemayehu and Getachew Semegn},
  title = {An Investigation of Ensemble and Explainable Machine Learning Models for Consumer Price Index Prediction in Ethiopia: Evidence from 1990-2023},
  journal = {International Journal on Data Science and Technology},
  volume = {12},
  number = {3},
  pages = {53-63},
  doi = {10.11648/j.ijdst.20261203.11},
  url = {https://doi.org/10.11648/j.ijdst.20261203.11},
  eprint = {https://article.sciencepublishinggroup.com/pdf/10.11648.j.ijdst.20261203.11},
  abstract = {A plenty of research investigations have demonstrated the pivotal role that the consumer price index (CPI) plays in the comprehensive assessment and understanding of inflationary trends within an economy. For prediction of consumer price index, researchers have used a variety of empirical methodologies and sophisticated statistical techniques, each of which come up with inherent challenges regarding their generalizability. To solve issues with generalizability, researchers developed artificial intelligence and machine learning. In this work, the sophisticated machine learning models such as decision tree (DT), random forest (RF), and gradient boosting (GB)s have integrated together to develop super learner machine learning to enhance the predictive capabilities concerning the consumer price index robustly. To ensure the optimization of these models, rigorous methodologies such as K-fold cross-validation and an extensive grid search for hyperparameter tuning are meticulously applied to refine the model's performance. The efficiency and predictive performance of the proposed super learner model are then critically compared with those of other base models, thereby establishing a benchmark for assessing improvements in predictive accuracy. Remarkably, the suggested super learner model demonstrated superior prediction capabilities, achieving highest coefficient of determination (R2) of 98.3%, with the lowest mean absolute error of 2.89%, a mean absolute percentage error of 2.60%, and a root mean square error of 3.46%. Moreover, the interpretability of the model's predictions is significantly explained through the application of Shapley additive explanations. This method explains the essential factors that influence the consumer price index in the context of Ethiopia. The super learner model that has been developed possesses the versatility and accuracy necessary for application across various economic sectors, enabling researchers and practitioners to predict dependent variables with both precision and efficiency, thus facilitating informed decision-making in financial planning.},
 year = {2026}
}
Copy
|
Download
-
TY  - JOUR
T1  - An Investigation of Ensemble and Explainable Machine Learning Models for Consumer Price Index Prediction in Ethiopia: Evidence from 1990-2023
AU  - Foad Mohammed
AU  - Abduselam Abdulahi Mohamed
AU  - Umar Aliyi
AU  - Firi Ziyad
AU  - Desalegn Wogaso
AU  - Habtamu Alemayehu
AU  - Getachew Semegn
Y1  - 2026/08/17
PY  - 2026
N1  - https://doi.org/10.11648/j.ijdst.20261203.11
DO  - 10.11648/j.ijdst.20261203.11
T2  - International Journal on Data Science and Technology
JF  - International Journal on Data Science and Technology
JO  - International Journal on Data Science and Technology
SP  - 53
EP  - 63
PB  - Science Publishing Group
SN  - 2472-2235
UR  - https://doi.org/10.11648/j.ijdst.20261203.11
AB  - A plenty of research investigations have demonstrated the pivotal role that the consumer price index (CPI) plays in the comprehensive assessment and understanding of inflationary trends within an economy. For prediction of consumer price index, researchers have used a variety of empirical methodologies and sophisticated statistical techniques, each of which come up with inherent challenges regarding their generalizability. To solve issues with generalizability, researchers developed artificial intelligence and machine learning. In this work, the sophisticated machine learning models such as decision tree (DT), random forest (RF), and gradient boosting (GB)s have integrated together to develop super learner machine learning to enhance the predictive capabilities concerning the consumer price index robustly. To ensure the optimization of these models, rigorous methodologies such as K-fold cross-validation and an extensive grid search for hyperparameter tuning are meticulously applied to refine the model's performance. The efficiency and predictive performance of the proposed super learner model are then critically compared with those of other base models, thereby establishing a benchmark for assessing improvements in predictive accuracy. Remarkably, the suggested super learner model demonstrated superior prediction capabilities, achieving highest coefficient of determination (R2) of 98.3%, with the lowest mean absolute error of 2.89%, a mean absolute percentage error of 2.60%, and a root mean square error of 3.46%. Moreover, the interpretability of the model's predictions is significantly explained through the application of Shapley additive explanations. This method explains the essential factors that influence the consumer price index in the context of Ethiopia. The super learner model that has been developed possesses the versatility and accuracy necessary for application across various economic sectors, enabling researchers and practitioners to predict dependent variables with both precision and efficiency, thus facilitating informed decision-making in financial planning.
VL  - 12
IS  - 3
ER  -
Copy
|
Download

 ,
Umar Aliyi,
Firi Ziyad*
,
Umar Aliyi,
Firi Ziyad*




 Share This Article
 Twitter
 Linked In
 Facebook