Research Article | | Peer-Reviewed

Multilayer Perceptron (MLP) and Convolutional Neural Network (CNN) for the Prediction of Quartz Grain Color from the Ivorian Onshore Basin

Received: 26 March 2026     Accepted: 7 May 2026     Published: 18 May 2026
Views:       Downloads:
Abstract

This study contributes to the digital transformation of geosciences by integrating artificial intelligence into sediment characterization, a field traditionally dominated by manual and visual techniques. Quartz grains collected from onshore drilling in the Ivorian basin were first subjected to granulometric analysis and then to morphoscopic study. The resulting photographs formed a novel database used to train two neural network models: the Multilayer Perceptron (MLP) and the Convolutional Neural Network (CNN). The main objective was to automatically predict quartz grain color, thereby reducing subjectivity and improving reproducibility in sedimentological analyses. Three categories were identified: translucent, oxidized, and transparent. These chromatic distinctions provide key insights into geological history, mineral composition, and depositional environments, allowing for more refined reconstructions of physico-chemical conditions during sediment transport and deposition. Performance evaluation confirmed the feasibility of applying AI to sediment analysis. While both models produced satisfactory results, the CNN consistently outperformed the MLP, demonstrating greater robustness and accuracy. This highlights the suitability of convolutional architectures for image-based geological tasks. By combining traditional petrographic methods with advanced computational techniques, this research demonstrates the potential of automated sediment characterization and underscores the relevance of digital approaches in modern sedimentology. It opens new perspectives for reproducibility and contributes to the ongoing digital transformation of geosciences.

Published in International Journal of Data Science and Analysis (Volume 12, Issue 1)
DOI 10.11648/j.ijdsa.20261201.11
Page(s) 1-9
Creative Commons

This is an Open Access article, distributed under the terms of the Creative Commons Attribution 4.0 International License (http://creativecommons.org/licenses/by/4.0/), which permits unrestricted use, distribution and reproduction in any medium or format, provided the original work is properly cited.

Copyright

Copyright © The Author(s), 2026. Published by Science Publishing Group

Keywords

Morphoscopy, Multilayer Perceptron, Convolutional Neural Network, Prediction of Quartz Grain Color, Ivorian Basin

1. Introduction
Quartz, an abundant mineral in sedimentary rocks, is fundamental to reconstructing depositional environments.. Its morphological characteristics and surface alterations allow us to trace sedimentary conditions, whether fluvial, marine, or aeolian.
In Côte d’Ivoire, numerous sedimentological studies, including morphoscopic and exoscopic analysis of quartz grains in understanding sedimentary dynamics. For instance, examined the Ébrié Lagoon system, using morphoscopic methods to characterize depositional environments. Similarly, demonstrated the relevance of quartz morphoscopy in the Sassandra estuary, distinguishing fluvial from marine inputs. Furthermore, analyzed Mio-Pliocene quartz grains in the Anyama region, contributing to the paleogeographic reconstruction of the Ivorian sedimentary basin.
Globally, quartz morphoscopy has long been recognized as a powerful tool for sedimentological studies. In Europe, pioneered the classification of quartz grains based on their morphology, while demonstrated how surface textures differentiate glacial from fluvial deposits. In North America, emphasized the role of quartz morphoscopy in distinguishing desert from coastal environments. In Asia, applied SEM to analyze quartz grains in fluvio-deltaic environments, while confirmed the universality of morphoscopic approaches in Japanese coastal and fluvial deposits. In the Middle East, highlighted the contribution of SEM-based morphoscopy in characterizing quartz grains from desert environments in Saudi Arabia.
Against this backdrop, artificial intelligence (AI) defined as the ability of computer systems to autonomously perform complex tasks through learning, reasoning, pattern recognition, and decision-making offers new opportunities for sedimentary geosciences. Already applied across multiple sectors, AI is increasingly used in geosciences to automate mineral recognition and classify depositional environments. The integration of artificial intelligence into morphoscopic analysis seeks to streamline this traditionally time consuming method by automatically predicting key parameters, such as quartz grain color. This convergence between sedimentary geology and digital innovation marks a significant advancement, opening new perspectives for sediment characterization and fostering geological research in Côte d’Ivoire and beyond.
2. Materials and Methods
The Ivorian sedimentary basin, formed during the opening of the Atlantic Ocean, extends from Sassandra in the west to Axim in Ghana in the east. It comprises both an emerged and submerged section. The onshore basin, a narrow coastal strip of Cretaceous–Tertiary age, covers approximately 8,000 km² (2.5% of the national territory), stretching 350 km in length and 40–50 km in width, bounded to the north by a shallow basement .
This terrestrial portion is divided into two domains: a northern zone, characterized by shallow basement overlain by Continental Terminal deposits (clays, clayey sands, ferruginized sandstones), and a southern zone, filled with Quaternary deposits (continental clayey sands, marine sandy ridges, lagoonal muds, and leached white sands). The two zones are separated by the Lagoon Fault, where several boreholes have been drilled.
The quartz grain fractions obtained from grain-size analyses of sandy sediments collected from boreholes drilled at Grand-Lahou, Dabou, Bingerville, Abidjan, Adiaké, and Aboisso constitute the primary data for this study. These locations are shown on the map in Figure 1.
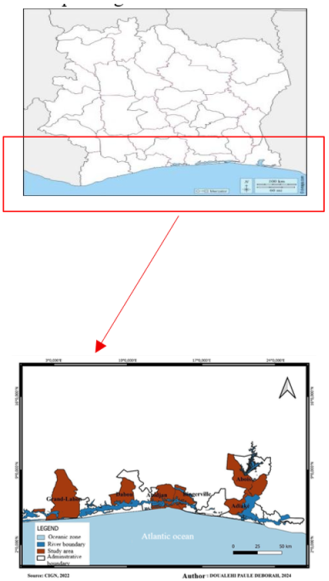
Figure 1. Origin of sand grains from boreholes.
The study focused on sands with diameters ranging from 300 to 250 µm , selected on the basis of granulometric analyses from previous investigations carried out in the onshore Ivorian basin. These earlier works examined sediments obtained from drilling in the aforementioned localities. To characterize the morphology and surface features of quartz grains shown in Figure 2, observations were conducted under a binocular microscope following the classification chart of Particular attention was given to the coloration of the grains. For this purpose, the grains were dispersed on a black background, and photographs were taken under lateral illumination to highlight subtle chromatic variations.
For the chromatic analysis, a dataset of 1,764 quartz grain images was compiled and categorized into three classes: oxidized, transparent, and translucent. This dataset served as the training base for two machine learning algorithms, namely the Multilayer Perceptron (MLP) and Convolutional Neural Network (CNN). To ensure consistency in algorithmic processing, all images were standardized in both size and format prior to analysis.
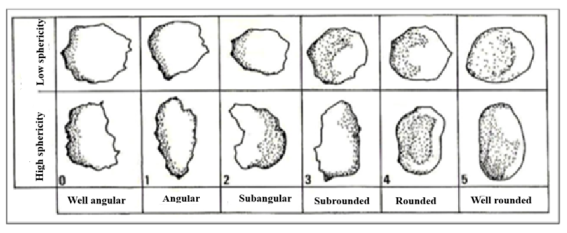
Figure 2. Roundness and sphericity estimate comparison chart.
2.1. Digital Processing Methods for Quartz Grains
The Python notebook employed for digital data processing was Jupyter, integrated within the Anaconda distribution. Initially, the required modules were imported into the Jupyter Notebook environment, and their installation was verified. When absent, the packages were installed using the command pip install. The libraries utilized in this study include: Scikit-learn, Pandas, Matplotlib, NumPy, TensorFlow, and Keras. eural Network Algorithms Utilized.
2.1.1. Multilayer Perceptron (MLP)
The multilayer perceptron, also known as a feedforward neural network, represents the basic architecture of a deep neural network. It consists of at least one hidden layer of nodes in addition to the input and output layers. Each node in the hidden layers functions as a neuron, applying a nonlinear activation function to enhance learning capabilities. Training samples are propagated forward through the network, while output errors are backpropagated to adjust the weights. Error minimization is achieved using the gradient descent method, which computes a loss function across all network weights .
2.1.2. Convolutional Neural Networks (CNN)
Convolutional Neural Networks (CNN) are a class of artificial neural networks specifically designed for the processing of structured data such as images, videos, and audio signals. These networks rely on convolutional operations that capture local patterns within the input data. Convolutional layers are typically followed by pooling layers, which reduce the dimensionality of the representation while preserving the most relevant information. The principal layers of CNN include:
1) convolutional layer (CONV): processes data within a receptive field to extract local features.
2) pooling layer (POOL): compresses information by reducing the size of intermediate feature maps, often through subsampling.
3) rectified Linear Unit (ReLU): applies a nonlinear activation function to introduce nonlinearity and improve learning capacity.
4) fully connected layer (FC): functions as a perceptron layer, integrating extracted features for classification or regression tasks.
5) loss layer (LOSS): computes the error between predicted and actual outputs, guiding optimization during training.
The implementation of the convolutional neural network (CNN) follows a structured sequence of layers. First, the input images are preprocessed and normalized to ensure consistency across the dataset. The convolutional layers extract local features from the receptive fields, while pooling layers reduce dimensionality and retain the most relevant information. Nonlinearity is introduced through ReLU activation functions, which enhance the learning capacity of the network. The fully connected layers integrate the extracted features to perform the final classification task. Finally, the loss layer computes the error between predicted and actual outputs, guiding the optimization process during training. Through this workflow, the CNN is able to learn discriminative patterns and apply them effectively to the classification problem addressed.
2.2. Data Processing
The deep learning process in Keras consists of eight steps: loading data, preprocessing data, defining the model, compiling the model, training the model, evaluating and predicting the model.
2.2.1. Loading Packages and Data
import tensorflow as tf
from tensorflow.keras.utils import image_dataset_from_directory
seed = 125
img_size = (125, 125)
train_data = image_dataset_from_directory(
directory,
labels="inferred",
label_mode="int",
color_mode="rgb",
batch_size=32,
shuffle=True,
seed=seed,
validation_split=0.3,
subset="training",
interpolation="bilinear",
image_size=img_size
)
test_data = image_dataset_from_directory(
directory,
labels="inferred",
label_mode="int",
color_mode="rgb",
batch_size=32,
shuffle=True,
seed=seed,
validation_split=0.3,
subset="validation",
interpolation="bilinear",
image_size=img_size
)
2.2.2. Data Preprocessing
All images were normalized to values between 0 and 1 to minimize the effect of high pixel intensities, and the labels were converted into categorical vectors to facilitate classification.
Import tensorflow as tf
from tensorflow.keras.utils import to_categorical
normalise = tf.keras.layers.Rescaling(1./255)
norm_train = train_data.map(lambda x, y: (normalise(x), y))
norm_test = test_data.map(lambda x, y: (normalise(x), y))
X_train, Y_train = next(iter(norm_train))
X_test, Y_test = next(iter(norm_test))
num_classes = len(train_data.class_names)
train_Y = to_categorical(Y_train.numpy(), num_classes)
test_Y = to_categorical(Y_test.numpy(), num_classes)
2.2.3. Model Construction
In Keras, sequential models are defined as a series of layers that are progressively added to the architecture. This approach allows for a straightforward construction of neural networks, where each layer transforms the input data before passing it to the next layer.
(i). Construction of the MLP Model
The Multilayer Perceptron (MLP) was implemented using Keras. The architecture consists of fully connected layers with ReLU activation functions and dropout regularization to reduce overfitting. The final output layer uses a softmax activation function, which is appropriate for multi-class classification problems.
from tensorflow.keras.models import Sequential
from tensorflow.keras.layers import Dense, Activation, Dropout
model = Sequential()
model.add(Dense(1024, input_shape=(125*125*3,)))
model.add(Activation("relu"))
model.add(Dropout(0.2))
model.add(Dense(512, activation="relu"))
model.add(Dropout(0.2))
model.add(Dense(120, activation="relu"))
model.add(Dropout(0.2))
model.add(Dense(num_classes, activation="softmax"))
(ii). Construction of the CNN Model
The Convolutional Neural Network (CNN) was implemented as follows. The architecture begins with convolutional and pooling layers to extract spatial features, followed by dropout regularization. The flattened feature maps are then passed through dense layers, with the final output layer using a softmax activation function for multi-class classification.
from tensorflow.keras.models import Sequential
from tensorflow.keras.layers import Conv2D, MaxPooling2D, Flatten, Dense, Dropout
model = Sequential()
model.add(Conv2D(32, (5,5), activation="relu", input_shape=(125,125,3)))
model.add(MaxPooling2D((2,2)))
model.add(Dropout(0.3))
model.add(Flatten())
model.add(Dense(128, activation="relu"))
model.add(Dense(num_classes, activation="softmax"))
2.2.4. Compilation and Training of the Model
Both models were compiled using the categorical crossentropy loss function and the Adadelta optimizer, with accuracy selected as the evaluation metric. Training was conducted with different epoch settings (50, 100, and 150) to assess performance stability and convergence. The best-performing configuration was retained for subsequent evaluation and prediction. Using categorical crossentropy ensures that the models are optimized for multi-class classification, while the Adadelta optimizer provides adaptive learning rate adjustments during training.
model.compile(
loss="categorical_crossentropy",
optimizer="adadelta",
metrics= ["accuracy"]
)
model.fit(
norm_train,
epochs=50,
batch_size=32,
validation_data=norm_test
)
2.2.5. Model Evaluation and Prediction
After training, the models were evaluated on both the training and validation/test datasets to assess their performance. The evaluation provided the loss and accuracy metrics, which quantify the model’s predictive capability and generalization. Predictions were then generated on the test set to analyze the classification outcomes. This step ensures that the trained models are not only optimized for the training data but also capable of producing reliable predictions on unseen data.
loss, accuracy = model.evaluate(norm_train)
print("Training Loss: ", loss)
print("Training Accuracy: ", accuracy)
loss, accuracy = model.evaluate(norm_test)
print("Validation/Test Loss: ", loss)
print("Validation/Test Accuracy: ", accuracy)
prediction = model.predict(norm_test)
2.2.6. Confusion Matrix
Precision= TPTP+FP(1)
The confusion matrix is an essential tool for evaluating the performance of a classification model. Two metrics, precision and recall, are fundamental. These two metrics are complementary and provide a more nuanced view of the model’s performance. Equation (1), which defines precision, measures the proportion of correctly predicted positive cases among all positive predictions made by the model. In other words, it indicates the reliability of positive predictions. Equation (2) presents recall, which measures the proportion of true positives correctly identified among all actual positive cases. It is a measure of the model’s ability to detect positive instances.
Recall= TPTP+FN(2)
3. Results
The colors of the quartz grains determined after analysis fall into three categories: oxidized (546 grains), translucent (613 grains), and transparent (605 grains), for a total of 1,764 quartz grains. Figure 3 shows the photos of the three color classes, and the histogram in Figure 4 presents the number of samples obtained for each color class.
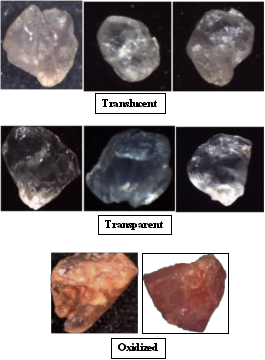
Figure 3. Different colors of quartz grains.
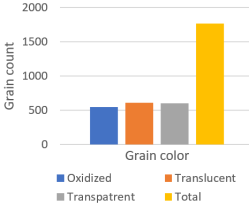
Figure 4. Histogram of quartz grain distribution by color.
3.1. Classification of Quartz Grain Colors Using the MLP Algorithm
In machine learning, accuracy and loss curves are commonly used to evaluate model performance.
The model accuracy graph (Figure 5a) presents two curves: the blue one (training accuracy) and the dashed red line (testing accuracy). The blue curve starts around 0.5 and rises quickly, stabilizing between 0.8 and 0.9, which indicates that the model learns effectively on the training data. The red dashed curve follows a similar upward trend but remains slightly lower, stabilizing around 0.8, showing that the model generalizes reasonably well to unseen data. The gap between the two curves suggests mild overfitting, though overall performance remains satisfactory. The fluctuations observed in both curves imply that further optimization such as adjusting the number of epochs, dropout rate, or optimizer choice—could improve stability. the model achieves a about 80% accuracy on the test set, demonstrating solid learning capacity with room for refinement.
The model loss graph (Figure 5b) shows that the model’s loss decreases rapidly during the initial epochs. The solid blue line (training loss) starts at a high value near 7, then drops below 1 within the first few iterations and stabilizes at a low level. The dashed red line (testing loss) follows a similar trend, fluctuating slightly around the same low range. This rapid convergence and the stability of both curves indicate strong learning performance and good generalization ability, with no significant signs of overfitting.
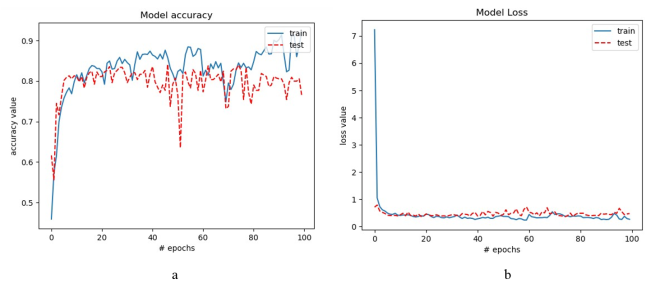
Figure 5. Accuracy curve (a) and loss curve (b) of colors (MLP).
The Multilayer Perceptron (MLP), applied to the classification of quartz grain colors, achieved an overall accuracy of 0.8166, corresponding to a performance of 81.66% (Table 1). However, no grain was predicted with 100% certainty, indicating the presence of residual confusions between classes. Oxidized grains were very well recognized, with a correct classification rate of 99.37% and only 0.63% misclassification. Among the few errors, a single grain (0.63%) was incorrectly classified as translucent, while none were confused with transparent grains. Translucent grains were correctly identified in 78.46% of cases. Conversely, 21.54% were misclassified, including 96 samples (20.91%) confused with transparent grains and one sample (0.63%) with oxidized grains. For transparent grains, the correct classification rate reached 59.66%, while 40.34% were misidentified. All errors were concentrated in confusion with translucent grains, and no transparent grain was assigned to the oxidized class.
Table 1. Confusion matrix of colors (MLP).

Color

Oxidized

Translucent

Transparent

Total

Recall

Oxidized

160

0

0

160

89.88%

Translucent

1

102

96

199

51.25%

Transparent

0

28

142

170

83.35%

Total

161

130

238

529

Precision

99.37%

78.46%

59.66%

3.2. Classification of Quartz Grain Colors Using the CNN Algorithm
The examination of the model accuracy (Figure 6a) graph highlights a well trained and efficient convolutional neural network (CNN). The blue curve (train) rises quickly, reaching an accuracy close to 90% before stabilizing. The red dotted curve (test) follows a similar trajectory and converges around 87–88%. The slight gap between the two curves indicates minimal overfitting, confirming that the model generalizes effectively to unseen data. The convergence observed after epoch 60 shows that the training has reached maturity: the network has successfully extracted the relevant features without excessive adjustment. Extending the training beyond this point would likely yield no significant improvement and could even increase overfitting. In summary, the stability and proximity of the curves demonstrate the robustness of the model, which achieves high accuracy while maintaining strong generalization capability.
The loss curve (Figure 6b) demonstrates highly stable learning, with both the blue curve (train) and the red curve (test) decreasing smoothly without abrupt oscillations. The crucial point is that the red curve never rises again, which confirms that the model does not suffer from severe overfitting. The flattening of both curves around epoch 100 indicates that the model has reached its peak efficiency, making further training unnecessary.
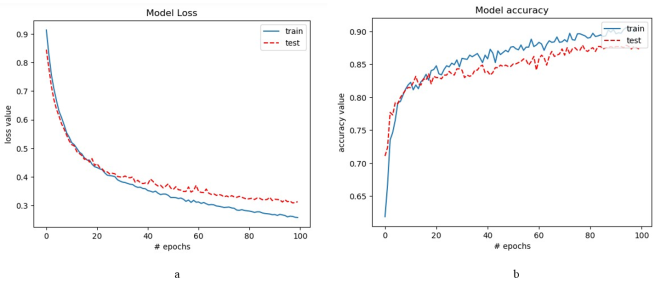
Figure 6. Accuracy curve (a) and loss curve (b) of colors (CNN).
The Convolutional Neural Network (CNN), applied to the recognition of quartz grain colors, achieved an accuracy of 0.8884, corresponding to a performance of 88.84%. This result represents a clear improvement compared to the Multilayer Perceptron. Oxidized grains were very well classified, with a correct classification rate of 99.37%. Only one grain (0.63%) was incorrectly classified as translucent, and none were confused with the transparent class. Translucent grains were correctly identified in 78.46% of cases, while 21.54% were misclassified. Among the misclassified translucent grains, 96 (representing 20.91% of the errors) were confused with transparent grains. For transparent grains, 59.66% were correctly classified and 43.34% were misidentified. Of these errors, 28 grains were classified as translucent. None were confused with oxidized grains (Table 2).
Table 2. Confusion matrix of colors (CNN).

Color

Oxidized

Translucent

Transparent

Total

Recall

Oxidized

159

1

0

160

99.37%

Translucent

1

149

49

199

74.87%

Transparent

0

37

133

170

78.23%

Total

160

187

182

529

Precision

99.37%

79.67%

73.07%

3.3. Comparison of the Performance of the Two Algorithms for Color Classification
It was observed that between the two neural networks, (MLP and CNN), used to predict the colors of quartz grains, the CNN proved to be the most effective, achieving an accuracy of 88.84% surpassing the MLP, which obtained 81.66% (Table 3). The detailed analysis shows excellent recognition of oxidized grains, with a classification rate close to 99.37% for both models. The main difficulties arise in distinguishing between translucent and transparent grains, where residual confusions persist. In conclusion, the CNN algorithm outperforms the MLP in terms of accuracy, stability, and generalization. While the MLP provides acceptable results, the CNN proves to be the more robust and efficient choice for quartz grain color classification.
Table 3. Performance of MLP and CNN for color classification.

ACCURACY

MLP

CNN

PERCENTAGE

81,66%

88,84%

4. Discussion
The automation of quartz grain color recognition using multilayer perceptron (MLP) and convolutional neural networks (CNN) has yielded significant performances, with accuracy rates of 81.66% and 88.84%, respectively. These findings confirm the relevance of deep learning approaches in sedimentology and are consistent with several recent studies.
In particular, demonstrated that the application of deep neural networks to mineral discrimination (quartz, biotite, and K-feldspar) achieves high performance, provided that a large number of epochs and extensive datasets are employed. Their work emphasizes that increasing the number of training iterations enhances the model’s ability to distinguish minerals with similar textures, while reducing the subjectivity inherent in traditional morphoscopic methods. Our results, which show a notable improvement in CNN performance at 100 epochs (88.84%), align closely with this observation.
Furthermore, showed that CNN-based models applied to digital sediment cores enable automated stratigraphic interpretation with accuracy comparable to expert geologists. Similarly, confirmed that increasing the number of epochs and diversifying datasets strengthens the robustness of machine learning models in petrographic analysis. Along the same lines, developed SandAI, a neural network trained on quartz sand grains, capable of reconstructing depositional histories, thereby demonstrating that artificial intelligence can advantageously replace traditional morphoscopy.
Our results, which highlight excellent classification of oxidized grains (nearly 99.37% accuracy), fit within this global trend. However, the persistent confusion between translucent and transparent grains reflects a challenge already noted by , who reported that closely related mineral textures often lead to misclassifications, even with well-trained CNN models. This underscores the importance of larger, more diverse, and better-labeled datasets, as emphasized by and , to improve model generalization.
Nevertheless, a high number of epochs may also result in overfitting, a phenomenon extensively documented by and Overfitting manifests as high accuracy on training data but reduced performance on test datasets. In our study, the confusion between translucent and transparent grains may partly be attributed to this issue. To mitigate such risks, strategies such as dropout (already implemented in our models), early stopping to halt training when validation performance plateaus, and artificial data augmentation (rotation, brightness variation, noise addition) are recommended.
This study therefore confirms that the integration of artificial intelligence into sedimentary geosciences represents a major advancement. The performance achieved by CNN demonstrates that convolutional architectures are particularly well-suited to recognizing chromatic features of quartz grains. In Côte d’Ivoire, this innovative approach paves the way for modernizing morphoscopic methods, reducing subjectivity, and enhancing reproducibility, while highlighting the necessity of balancing the number of epochs with strategies to prevent overfitting, as also demonstrated by .
5. Conclusion
At the end of this study, which is part of the geological innovation dynamic aiming to promote digital tools in sediment characterization, the following points can be highlighted:
1) the classification of quartz grain colors using Multilayer Perceptron (MLP) and Convolutional Neural Network (CNN) models proved effective.
2) the evaluation of neural network model performance yielded excellent results. Grain colors were identified with performance rates exceeding 80%.
3) •the CNN algorithm outperforms the MLP in terms of accuracy, stability, and generalization. The CNN proves to be the more robust and efficient choice for quartz grain color classification.
Abbreviations

STRM

Faculty of Earth Sciences and Mineral Resources

ESPE

Higher School of Petroleum and Energy

NPHB

Félix Houphouët-Boigny National Polytechnic Institute

AI

Artificial Intelligence

MLP

Multilayer Perceptron

CNN

Convolutional Neural Network

CONV

Convolutional Layer

POOL

Pooling Layer

LOSS

Loss Layer

TP

True Positive — True Positive Predictions

FP

False Positive —False Positive Predictions

FN

False Negative — False Negative Predictions

Author Contributions
Akoua Clarisse Kra: Writing – original draft, Writing – review & editing
Assie Francois Kouao: Supervision
Fori Yao Paul Assale: Project administration
Conflicts of Interest
The authors declare that they have no known competing financial interests or personal relationships that could have appeared to influence the work reported in this paper.
References
[1] Togba, A. P., Aka, C. A., Yao, K. C., Monde, S., N’Guessan, Y. A. Management of an aquatic system using a morphoscopic and exoscopic approach: The case of the Ébrié Lagoon system (Coast of Côte d’Ivoire). Open Access Library Journal. 2025, 12(1), pp. 1-9.
[2] N’dri, G. R. K., Ndoufou, G. H. C., Ahoure, N. D., Monde, S. Sedimentary characterization of the Sassandra River estuary (Southwest Côte d’Ivoire): Morphoscopy and exoscopy of quartz grains. Afrique Science. 2023, 22(6), pp. 1–12.
[3] Kra, A. C., N’goran, J. P. Y., Assalé, F. Y. P., Aka, K. Characterization of transport dynamics of Mio-Pliocene quartz grains in the Anyama region (Côte d’Ivoire): Morphoscopy and exoscopy. American Journal of Innovative Research and Applied Sciences. 2020, 11(1) pp. 27–36.
[4] Cailleux, A. Morphoscopy of quartz grains: classification of sand grains by roundness and surface characteristics. Paris, University Documentation Center. 1942, p 280.
[5] Krinsley, D. H., Doornkamp J. C. Atlas of quartz sand surface textures. Cambridge university press. 1973, p 91.
[6] Pettijohn, F. J. Sedimentary Rocks., CBS Publ, New Delhi. 1984, 3rd edition, p 628.
[7] Li, W., Wang, L., Wu, M. New quartz and zircon Si isotopic reference materials for precise and accurate SIMS isotopic microanalysis. Atomic Spectroscopy. 2021, 43(2), pp. 99–106.
[8] Yoshikawa, S., Xiao, J., Kumai, H., An, Z. Quartz from selected horizons of loess-paleosol sequences on the Chinese Loess Plateau and the Osaka Group of Central Japan. Quaternary Research. 1993, 32(4), pp. 209–217.
[9] Al-Saleh, A. M., Al-Harbi, H. M. Mineralogical and geochemical characteristics of gold-hosted alteration zones in desert environments, Saudi Arabia. Arabian Journal of Geosciences. 2021, 14(8).
[10] Sombo, B. C. Structural and seismic-stratigraphic evolution of the offshore sedimentary basin of Côte d’Ivoire. Ph.D. Thesis, University of Abidjan, 2002, p 304.
[11] Saaidi, E. Treatise on Sedimentology, Petrography, Sedimentary Environments. Afrique Orient Editions, 1991, p 393.
[12] Pettijohn, F. Sedimentary Rocks. Harper Brothers. In: Sedimentology. With 177 Figures and 17 tables. Translation by Thomas Reimer. CHAMLEY, H. Springer-Verlag Berlin Heidelberg. 1949, p 285.
[13] LeCun, Y., Bengio, Y., Hinton, G. Deep learning. Nature. 2015, 521(7553), pp. 436–444.
[14] Lou, W., Zhang, D. Applications of deep learning in mineral discrimination: A case study of quartz, biotite and K-feldspar from granite. Journal of Earth Science. 2025, 36(1), pp. 29–45.
[15] Di Martino, P., Rossi, G., Bianchi, L. Deep learning applied to sediment core analysis: automated stratigraphic interpretation from digital imagery. Scientific Reports. 2023, 13(11245), pp. 1-12.
[16] Azzam, R., Blaise, T., & Brigaud, B. Machine learning approaches for automated petrographic image analysis: supervised and unsupervised workflows. Sedimentologika. 2024, 2(1), pp. 45–62.
[17] Lapôtre, M., Chen, Y., Stanford SandAI Team. SandAI: reconstructing depositional histories from quartz grain imagery using neural networks. Stanford Sedimentology Reports. 2024, 12(3), pp. 77–95.
[18] Külekçi, G., Hacıefendioğlu, K., Başağa, H. Deep learning-based quartz identification in thin sections: overcoming petrographic subjectivity. Earth Science Informatics. 2025, 18(2), pp. 233–249.
[19] Goodfellow, I., Bengio, Y., Courville, A. Deep Learning. MIT Press. 2016, p 800.
Cite This Article
  • APA Style

    Kra, A. C., Kouao, A. F., Assale, F. Y. P. (2026). Multilayer Perceptron (MLP) and Convolutional Neural Network (CNN) for the Prediction of Quartz Grain Color from the Ivorian Onshore Basin. International Journal of Data Science and Analysis, 12(1), 1-9. https://doi.org/10.11648/j.ijdsa.20261201.11

    Copy | Download

    ACS Style

    Kra, A. C.; Kouao, A. F.; Assale, F. Y. P. Multilayer Perceptron (MLP) and Convolutional Neural Network (CNN) for the Prediction of Quartz Grain Color from the Ivorian Onshore Basin. Int. J. Data Sci. Anal. 2026, 12(1), 1-9. doi: 10.11648/j.ijdsa.20261201.11

    Copy | Download

    AMA Style

    Kra AC, Kouao AF, Assale FYP. Multilayer Perceptron (MLP) and Convolutional Neural Network (CNN) for the Prediction of Quartz Grain Color from the Ivorian Onshore Basin. Int J Data Sci Anal. 2026;12(1):1-9. doi: 10.11648/j.ijdsa.20261201.11

    Copy | Download

  • @article{10.11648/j.ijdsa.20261201.11,
      author = {Akoua Clarisse Kra and Assie Francois Kouao and Fori Yao Paul Assale},
      title = {Multilayer Perceptron (MLP) and Convolutional Neural Network (CNN) for the Prediction of Quartz Grain Color from the Ivorian Onshore Basin},
      journal = {International Journal of Data Science and Analysis},
      volume = {12},
      number = {1},
      pages = {1-9},
      doi = {10.11648/j.ijdsa.20261201.11},
      url = {https://doi.org/10.11648/j.ijdsa.20261201.11},
      eprint = {https://article.sciencepublishinggroup.com/pdf/10.11648.j.ijdsa.20261201.11},
      abstract = {This study contributes to the digital transformation of geosciences by integrating artificial intelligence into sediment characterization, a field traditionally dominated by manual and visual techniques. Quartz grains collected from onshore drilling in the Ivorian basin were first subjected to granulometric analysis and then to morphoscopic study. The resulting photographs formed a novel database used to train two neural network models: the Multilayer Perceptron (MLP) and the Convolutional Neural Network (CNN). The main objective was to automatically predict quartz grain color, thereby reducing subjectivity and improving reproducibility in sedimentological analyses. Three categories were identified: translucent, oxidized, and transparent. These chromatic distinctions provide key insights into geological history, mineral composition, and depositional environments, allowing for more refined reconstructions of physico-chemical conditions during sediment transport and deposition. Performance evaluation confirmed the feasibility of applying AI to sediment analysis. While both models produced satisfactory results, the CNN consistently outperformed the MLP, demonstrating greater robustness and accuracy. This highlights the suitability of convolutional architectures for image-based geological tasks. By combining traditional petrographic methods with advanced computational techniques, this research demonstrates the potential of automated sediment characterization and underscores the relevance of digital approaches in modern sedimentology. It opens new perspectives for reproducibility and contributes to the ongoing digital transformation of geosciences.},
     year = {2026}
    }
    

    Copy | Download

  • TY  - JOUR
    T1  - Multilayer Perceptron (MLP) and Convolutional Neural Network (CNN) for the Prediction of Quartz Grain Color from the Ivorian Onshore Basin
    AU  - Akoua Clarisse Kra
    AU  - Assie Francois Kouao
    AU  - Fori Yao Paul Assale
    Y1  - 2026/05/18
    PY  - 2026
    N1  - https://doi.org/10.11648/j.ijdsa.20261201.11
    DO  - 10.11648/j.ijdsa.20261201.11
    T2  - International Journal of Data Science and Analysis
    JF  - International Journal of Data Science and Analysis
    JO  - International Journal of Data Science and Analysis
    SP  - 1
    EP  - 9
    PB  - Science Publishing Group
    SN  - 2575-1891
    UR  - https://doi.org/10.11648/j.ijdsa.20261201.11
    AB  - This study contributes to the digital transformation of geosciences by integrating artificial intelligence into sediment characterization, a field traditionally dominated by manual and visual techniques. Quartz grains collected from onshore drilling in the Ivorian basin were first subjected to granulometric analysis and then to morphoscopic study. The resulting photographs formed a novel database used to train two neural network models: the Multilayer Perceptron (MLP) and the Convolutional Neural Network (CNN). The main objective was to automatically predict quartz grain color, thereby reducing subjectivity and improving reproducibility in sedimentological analyses. Three categories were identified: translucent, oxidized, and transparent. These chromatic distinctions provide key insights into geological history, mineral composition, and depositional environments, allowing for more refined reconstructions of physico-chemical conditions during sediment transport and deposition. Performance evaluation confirmed the feasibility of applying AI to sediment analysis. While both models produced satisfactory results, the CNN consistently outperformed the MLP, demonstrating greater robustness and accuracy. This highlights the suitability of convolutional architectures for image-based geological tasks. By combining traditional petrographic methods with advanced computational techniques, this research demonstrates the potential of automated sediment characterization and underscores the relevance of digital approaches in modern sedimentology. It opens new perspectives for reproducibility and contributes to the ongoing digital transformation of geosciences.
    VL  - 12
    IS  - 1
    ER  - 

    Copy | Download

Author Information
  • Departement of Geosciences, University Felix Houphouet-Boigny, Abidjan, Cote d’Ivoire

  • Departement of Geosciences, University Felix Houphouet-Boigny, Abidjan, Cote d’Ivoire

  • Higher School of Petroleum and Energy (ESPE), Institut National Polytechnique Felix Houphouet-Boigny, Yamoussoukro, Cote d’Ivoire

  • Abstract
  • Keywords
  • Document Sections

    1. 1. Introduction
    2. 2. Materials and Methods
    3. 3. Results
    4. 4. Discussion
    5. 5. Conclusion
    Show Full Outline
  • Abbreviations
  • Author Contributions
  • Conflicts of Interest
  • References
  • Cite This Article
  • Author Information