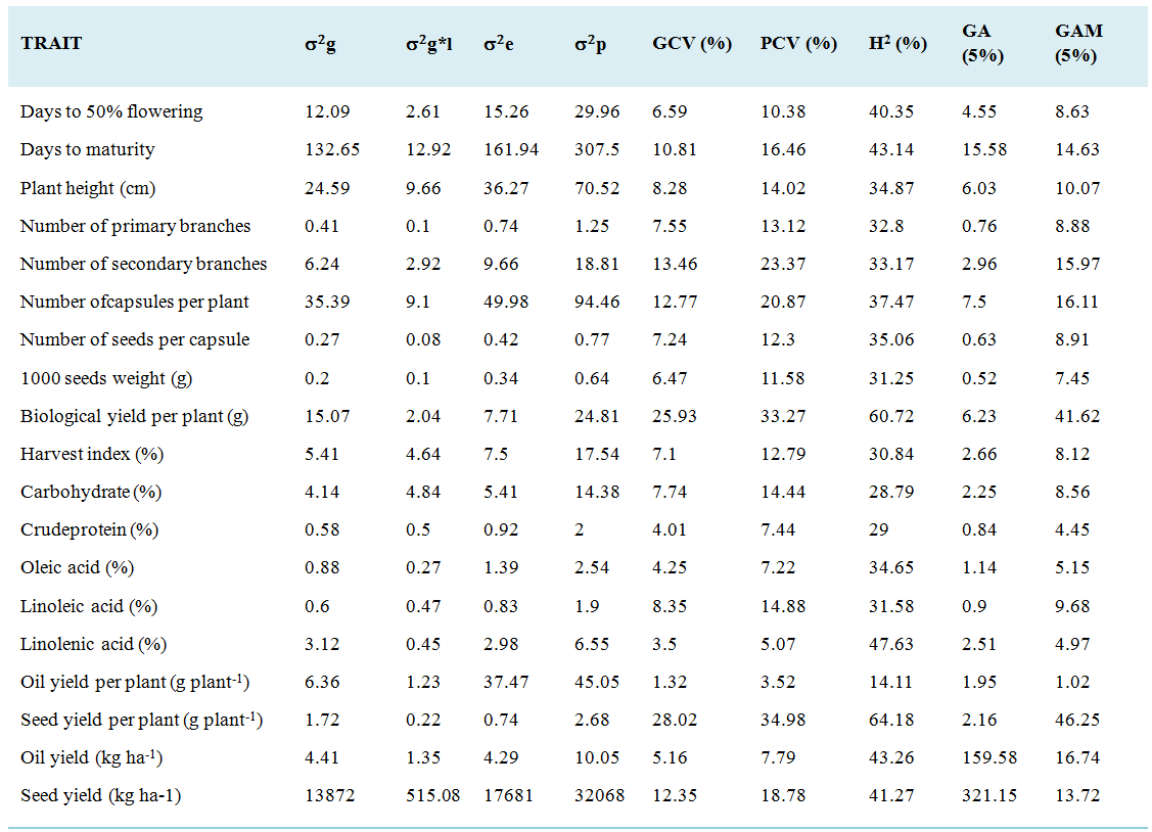
Comprehensive information on genetic variability and selection parameters is very crucial to design breeding strategies. However, very limited information is available in Ethiopian linseed germplasm. Therefore, the present study was conducted to estimate genetic variability, broad sense heritability and genetic advance; and determine selection for 19 quantitative traits using 126 genotypes (120 Ethiopian linseed accessions and six released varieties). The analysis of variance showed highly significant (P < 0.01) differences for all of the traits demonstrating the presence of high genetic diversity among the studied linseed genotypes. Higher differences between PCV and GCV estimates were observed for seed yield per plant and biological yield per plant, signifying the importance of environmental factors influence. High heritability coupled with high genetic advance was observed for seed yield per plant and biological yield per plant, indicating that this high heritability is due to additive gene effects and therefore, selection can be effective for the improvement of linseed for these traits. In addition, moderate heritability coupled with moderate genetic advance was recorded for oil yield per hectare, number of capsules, number of secondary branches, days to maturity, seed yield per hectare and plant height. These results indicated the existence of intermediate expression in these traits for both additive and dominance gene effect. In the present study, high heritability coupled with high GAM was observed for seed yield per plant and biological yield per plant, indicating greater contribution of additive gene action for the expression of these traits; and therefore, improvement can be achieved through selection in these traits.
| Published in | International Journal of Biomedical Science and Engineering (Volume 12, Issue 2) |
| DOI | 10.11648/j.ijbse.20241202.11 |
| Page(s) | 19-33 |
| Creative Commons |
This is an Open Access article, distributed under the terms of the Creative Commons Attribution 4.0 International License (http://creativecommons.org/licenses/by/4.0/), which permits unrestricted use, distribution and reproduction in any medium or format, provided the original work is properly cited. |
| Copyright |
Copyright © The Author(s), 2024. Published by Science Publishing Group |
Additive Effect, Coefficient of Variation, Genetic Advance
Weather variable | ||||||
|---|---|---|---|---|---|---|
Minimum temperature (°C) | Maximum temperature (°C) | Precipitation (mm) | ||||
Month | Holeta | Kulumsa | Holeta | Kulumsa | Holeta | Kulumsa |
January | 8 | 8.2 | 24 | 22.8 | 15.9 | 19 |
February | 9 | 9.2 | 25 | 23.7 | 41.6 | 67 |
March | 11 | 10.9 | 26 | 24.6 | 73.3 | 86 |
April | 12 | 12 | 25 | 24.8 | 91.9 | 120 |
May | 12 | 12.1 | 25 | 24.4 | 89.4 | 82 |
June | 11 | 11.2 | 24 | 23.2 | 106.3 | 90 |
July | 12 | 11.2 | 22 | 21.2 | 211 | 122 |
August | 12 | 11 | 22 | 21 | 203.9 | 135 |
September | 11 | 10.7 | 22 | 21.4 | 132.3 | 107 |
October | 9 | 10.6 | 23 | 23 | 36.7 | 38 |
November | 7 | 9 | 23 | 22.6 | 8 | 11 |
December | 7 | 7.5 | 23 | 23 | 6 | 9 |
Mean | 10.08 | 10.30 | 23.67 | 22.98 | 84.69 | 73.83 |
Parameter | Character | |||||||||
|---|---|---|---|---|---|---|---|---|---|---|
DF | DM | PH | PB | SB | NC | NSC | TSW | BYP | HI | |
Mean | 52.73 | 106.53 | 59.91 | 8.51 | 18.56 | 46.58 | 7.11 | 6.91 | 14.97 | 32.76 |
Std | 5.6 | 18.09 | 8.54 | 1.13 | 4.46 | 9.85 | 0.89 | 0.79 | 3.94 | 4.02 |
Min | 41 | 87.65 | 43.73 | 6.04 | 10.78 | 23.15 | 5.73 | 4.97 | 7.89 | 22.63 |
Max | 66.26 | 151.2 | 76.51 | 11.2 | 25.87 | 69.68 | 9.48 | 8.15 | 28.67 | 44.92 |
CV% | 10.63 | 16.98 | 14.26 | 13.31 | 24.02 | 21.14 | 12.53 | 11.49 | 26.32 | 12.28 |
Parameter | Character | ||||||||
|---|---|---|---|---|---|---|---|---|---|
CRB | PRT | OA | LN | LNN | OYP | SYP | OYD | SYD | |
Mean | 26.27 | 19 | 22.07 | 9.26 | 50.52 | 190.69 | 4.68 | 953.47 | 2341.47 |
Std | 3.56 | 1.38 | 1.6 | 1.33 | 2.64 | 36.7 | 0.78 | 183.5 | 391.06 |
Min | 12.57 | 16.07 | 16.67 | 7.61 | 43.78 | 119.06 | 3.11 | 595.3 | 1555 |
Max | 33.03 | 24.82 | 25.71 | 14.7 | 58.03 | 313.64 | 6.43 | 1568.2 | 3215 |
CV% | 13.56 | 7.26 | 7.25 | 14.39 | 5.22 | 19.25 | 16.71 | 19.25 | 16.7 |
Adm. Reg | Parameter | DF | DM | PH | PB | SB | NC | NSC | TSW | BYP | HI |
|---|---|---|---|---|---|---|---|---|---|---|---|
TIGRAY | mean | 53.29 | 111.5 | 57.21 | 8.04 | 18.77 | 41.91 | 6.78 | 6.53 | 13.82 | 33.6 |
(30 accessions) | Std | 6.52 | 20.93 | 9.15 | 1.12 | 4.4 | 10.24 | 0.8 | 0.85 | 4.16 | 4.77 |
CV% | 12.24 | 18.77 | 15.99 | 13.99 | 23.45 | 24.44 | 11.73 | 13.05 | 30.06 | 14.19 | |
Range | 25.26 | 63.55 | 32.78 | 5.06 | 14.83 | 36.95 | 3.65 | 2.86 | 20.78 | 22.29 | |
AMHARA | MEAN | 52.88 | 105.71 | 60.15 | 8.53 | 18.73 | 47.42 | 7.19 | 6.99 | 15.15 | 32.41 |
(46 accessions) | Std | 5.37 | 17.08 | 8.31 | 1.08 | 4.46 | 9.21 | 0.9 | 0.72 | 3.69 | 3.71 |
CV% | 10.15 | 16.16 | 13.82 | 12.67 | 23.79 | 19.41 | 12.46 | 10.35 | 24.34 | 11.45 | |
Range | 23.08 | 61.63 | 31.45 | 4.96 | 14.94 | 44.36 | 3.69 | 3.07 | 18.28 | 21.06 | |
OROMIA | MEAN | 50.75 | 101.68 | 63.07 | 9.09 | 19.02 | 50.25 | 7.41 | 7.22 | 16.29 | 32.62 |
(39 accessions) | Std | 5.2 | 16.88 | 8.56 | 1.21 | 4.46 | 9.23 | 1 | 0.78 | 4.58 | 4.48 |
CV% | 10.24 | 16.6 | 13.57 | 13.32 | 23.45 | 18.37 | 13.45 | 10.8 | 28.1 | 13.73 | |
Range | 20.89 | 54.97 | 28.71 | 3.94 | 13.71 | 39.9 | 3.15 | 2.69 | 17.56 | 19.35 | |
SNNP | MEAN | 53.54 | 101.56 | 61.42 | 8.48 | 15.29 | 51.06 | 7.16 | 7.11 | 14.33 | 33.25 |
(5 accessions) | Std | 0.17 | 6.99 | 0.43 | 0.4 | 0.62 | 7.07 | 0.11 | 0.13 | 0.95 | 1.53 |
CV% | 0.32 | 6.89 | 0.7 | 4.67 | 4.02 | 13.85 | 1.58 | 1.79 | 6.66 | 4.59 | |
Range | 0.24 | 9.89 | 0.61 | 0.56 | 0.87 | 10 | 0.16 | 0.18 | 1.35 | 2.16 | |
COMM. VAR | MEAN | 55.61 | 110.74 | 58.26 | 8.47 | 14.97 | 45.24 | 6.81 | 6.83 | 13.86 | 32.74 |
(6 varieties) | Std | 4.51 | 18.61 | 6.27 | 0.69 | 4.61 | 11.55 | 0.52 | 0.89 | 1.83 | 1.31 |
CV% | 8.12 | 16.8 | 10.77 | 8.17 | 30.78 | 25.54 | 7.62 | 13.03 | 13.18 | 3.99 | |
Range | 11.67 | 49.49 | 16.36 | 1.86 | 12.75 | 31.56 | 1.46 | 2.28 | 5.5 | 3.51 |
Adm. Reg | Parameter | CRB | PRT | OA | LN | LNN | OYP | SYP | OYD | SYD |
|---|---|---|---|---|---|---|---|---|---|---|
TIGRAY | Mean | 26.46 | 19.04 | 22.27 | 9.53 | 50.55 | 175.9 | 4.37 | 879.5 | 2186.33 |
(30 accessions) | Std | 3.15 | 1.09 | 1.34 | 1.74 | 2.61 | 33.99 | 0.82 | 170 | 410.4 |
CV% | 11.9 | 5.72 | 6.01 | 18.21 | 5.16 | 19.32 | 18.77 | 19.32 | 18.77 | |
Range | 15.86 | 4.91 | 4.78 | 7.07 | 11.8 | 132.58 | 3.32 | 662.9 | 1660 | |
AMHARA | Mean | 26.19 | 19.03 | 21.96 | 9.21 | 50.6 | 192.98 | 4.72 | 964.9 | 2358.85 |
(46 accessions) | Std | 3.34 | 1.31 | 1.73 | 1.07 | 2.53 | 35.8 | 0.73 | 179 | 366.19 |
CV% | 12.77 | 6.88 | 7.88 | 11.63 | 5.01 | 18.55 | 15.52 | 18.55 | 15.52 | |
Range | 17.61 | 6.92 | 9.04 | 5.48 | 11.66 | 194.58 | 3.22 | 972.9 | 1610 | |
OROMIA | Mean | 25.79 | 18.98 | 22.01 | 8.61 | 50.61 | 208.15 | 5.05 | 1041 | 2522.61 |
(39 accessions) | Std | 3.55 | 1.25 | 1.51 | 0.74 | 2.87 | 37.32 | 0.81 | 186.6 | 407.23 |
CV% | 13.77 | 6.57 | 6.86 | 8.62 | 5.66 | 17.93 | 16.14 | 17.93 | 16.14 | |
Range | 17.1 | 6.89 | 6.11 | 2.35 | 12.02 | 139.31 | 2.74 | 696.5 | 1370 | |
SNNP | Mean | 22.03 | 21.08 | 23.9 | 10.56 | 51.99 | 200.98 | 4.7 | 1005 | 2350 |
(5 accessions) | Std | 13.37 | 5.29 | 0.56 | 4.16 | 6.75 | 48.8 | 0.1 | 244 | 49.5 |
CV% | 60.71 | 25.09 | 2.34 | 39.46 | 12.99 | 24.28 | 2.12 | 24.28 | 2.11 | |
Range | 18.91 | 7.48 | 0.79 | 5.89 | 9.55 | 69.01 | 0.14 | 345 | 70 | |
COMM. VAR | Mean | 29.47 | 17.93 | 21.92 | 10.44 | 48.68 | 169.55 | 4.46 | 847.7 | 2231.67 |
(6 varieties) | Std | 2.07 | 1.79 | 1.87 | 1.23 | 1.42 | 24.45 | 0.59 | 122.3 | 293.22 |
CV% | 7.04 | 9.98 | 8.54 | 11.83 | 2.92 | 14.42 | 13.14 | 14.42 | 13.14 | |
Range | 4.47 | 4.96 | 4.68 | 3.68 | 4.41 | 68.6 | 1.62 | 343 | 810 |
Altitude | Parameter | DF | DM | PH | PB | SB | NC | NSC | TSW | BYP | HI |
|---|---|---|---|---|---|---|---|---|---|---|---|
class I | Mean | 51.36 | 99.30 | 63.54 | 8.73 | 18.66 | 50.53 | 7.14 | 7.22 | 14.89 | 33.98 |
(1480-1700) | Std | 2.64 | 7.11 | 5.70 | 0.73 | 5.62 | 7.28 | 0.48 | 0.39 | 2.79 | 3.61 |
(9 accessions) | CV% | 5.13 | 7.16 | 8.98 | 8.30 | 30.13 | 14.40 | 6.71 | 5.43 | 18.71 | 10.62 |
Range | 8.48 | 19.67 | 17.19 | 2.46 | 14.43 | 22.27 | 1.51 | 1.34 | 7.97 | 11.74 | |
class II | Mean | 50.80 | 101.98 | 61.71 | 8.67 | 17.40 | 45.76 | 7.16 | 7.04 | 15.64 | 32.39 |
(1730-1970) | Std | 4.83 | 13.67 | 7.29 | 1.09 | 4.15 | 8.17 | 0.90 | 0.69 | 4.37 | 4.20 |
(25 accessions) | CV% | 9.51 | 13.41 | 11.81 | 12.59 | 23.87 | 17.85 | 12.51 | 9.80 | 27.96 | 12.97 |
Range | 20.89 | 55.43 | 28.71 | 3.73 | 14.97 | 30.33 | 3.37 | 2.51 | 19.15 | 21.38 | |
class III | Mean | 53.42 | 107.37 | 59.48 | 8.53 | 19.13 | 48.20 | 7.19 | 6.93 | 14.68 | 33.28 |
(1980-2210) | Std | 5.32 | 18.72 | 8.46 | 1.10 | 4.28 | 8.36 | 0.86 | 0.75 | 3.55 | 3.63 |
(27 accessions) | CV% | 9.95 | 17.43 | 14.22 | 12.87 | 22.38 | 17.35 | 11.93 | 10.83 | 24.18 | 10.92 |
Range | 19.26 | 55.65 | 28.19 | 3.54 | 14.83 | 27.52 | 3.03 | 2.53 | 11.72 | 13.07 | |
class IV | Mean | 53.82 | 109.10 | 57.19 | 8.04 | 19.58 | 46.07 | 7.03 | 6.78 | 14.67 | 32.38 |
(2220-2460) | Std | 5.84 | 19.95 | 7.83 | 1.06 | 4.96 | 10.49 | 1.04 | 0.88 | 4.00 | 3.98 |
(19 accessions) | CV% | 10.85 | 18.29 | 13.69 | 13.24 | 25.35 | 22.76 | 14.75 | 13.02 | 27.27 | 12.29 |
Range | 18.33 | 56.40 | 26.95 | 4.56 | 14.63 | 37.56 | 3.25 | 2.99 | 13.46 | 13.84 | |
class V | Mean | 52.84 | 108.67 | 58.77 | 8.65 | 19.18 | 44.55 | 7.14 | 6.79 | 15.29 | 32.06 |
(2480-2700) | Std | 6.74 | 21.44 | 10.11 | 1.37 | 4.41 | 11.98 | 1.06 | 0.92 | 5.05 | 5.08 |
(23 accessions) | CV% | 12.76 | 19.73 | 17.20 | 15.81 | 22.98 | 26.90 | 14.79 | 13.51 | 33.05 | 15.85 |
Range | 24.36 | 63.55 | 32.48 | 4.61 | 14.62 | 43.27 | 3.75 | 2.86 | 20.78 | 22.29 | |
class VI | Mean | 53.22 | 108.85 | 61.05 | 8.50 | 16.77 | 45.93 | 7.10 | 6.85 | 14.76 | 32.70 |
(2710-2950) | Std | 7.48 | 23.15 | 11.33 | 1.43 | 3.27 | 13.34 | 1.06 | 1.07 | 3.96 | 3.20 |
(9 accessions) | CV% | 14.05 | 21.27 | 18.55 | 16.88 | 19.51 | 29.04 | 14.89 | 15.68 | 26.83 | 9.78 |
Range | 21.70 | 61.62 | 31.31 | 4.66 | 11.28 | 42.77 | 2.87 | 3.06 | 13.25 | 11.55 | |
class VII | Mean | 61.74 | 124.82 | 61.42 | 8.44 | 20.70 | 47.98 | 7.05 | 6.95 | 14.76 | 33.83 |
(3040-3440) | Std | 5.51 | 17.74 | 10.26 | 1.20 | 3.06 | 9.92 | 0.75 | 0.74 | 3.24 | 4.80 |
(8 accessions) | CV% | 10.53 | 16.43 | 16.70 | 14.23 | 14.78 | 20.67 | 10.57 | 10.69 | 21.95 | 14.20 |
Range | 14.46 | 50.72 | 25.05 | 2.85 | 10.05 | 28.82 | 1.84 | 2.08 | 7.58 | 14.97 |
Altitude | Parameter | CRB | PRT | OA | LN | LNN | OYP | SYP | OYD | SYD |
|---|---|---|---|---|---|---|---|---|---|---|
class I | Mean | 28.23 | 18.67 | 21.15 | 9.33 | 49.44 | 192.2 | 4.9 | 961.02 | 2385 |
(1480-1700) | Std | 2.18 | 1.22 | 1.08 | 0.54 | 2.34 | 20.09 | 0.47 | 100.47 | 235.4 |
(9 accessions) | CV% | 7.71 | 6.54 | 5.12 | 5.76 | 4.74 | 10.45 | 9.6 | 10.45 | 9.6 |
Range | 6.49 | 3.98 | 2.68 | 1.3 | 7.89 | 63.61 | 1.38 | 318.08 | 690 | |
class II | Mean | 24.99 | 19.42 | 22.18 | 8.92 | 50.96 | 200.65 | 4.82 | 1003.27 | 2408.6 |
(1730-1970) | Std | 4.85 | 1.63 | 1.32 | 1.27 | 3.03 | 39.62 | 0.77 | 198.13 | 383.59 |
(25 accessions) | CV% | 19.42 | 8.38 | 5.93 | 14.23 | 5.94 | 19.75 | 15.93 | 19.75 | 15.93 |
Range | 17.7 | 6.92 | 4.83 | 5.88 | 10.98 | 174 | 2.74 | 869.98 | 1370 | |
class III | Mean | 26.8 | 18.63 | 22.28 | 9.25 | 49.79 | 190.14 | 4.71 | 950.68 | 2355.37 |
(1980-2210) | Std | 2.59 | 1.02 | 1.82 | 1.38 | 2.62 | 33.17 | 0.76 | 165.83 | 381.92 |
(27 accessions) | CV% | 9.67 | 5.49 | 8.16 | 14.96 | 5.26 | 17.44 | 16.21 | 17.44 | 16.21 |
Range | 7.8 | 4.91 | 6.42 | 5.95 | 10.42 | 109.45 | 2.44 | 547.21 | 1220 | |
class IV | Mean | 26.62 | 18.97 | 22.1 | 9.48 | 50.89 | 183.45 | 4.54 | 917.24 | 2269.21 |
(2220-2460) | Std | 2.48 | 0.86 | 2.05 | 1.57 | 2.22 | 38.87 | 0.79 | 194.38 | 397.61 |
(19 accessions) | CV% | 9.32 | 4.55 | 9.28 | 16.53 | 4.36 | 21.19 | 17.52 | 21.19 | 17.52 |
Range | 9.41 | 3.88 | 9.04 | 7.04 | 8.54 | 132.61 | 2.69 | 663.09 | 1345 | |
class V | Mean | 25.44 | 19.12 | 21.81 | 9.1 | 51.09 | 190.22 | 4.58 | 951.12 | 2288.04 |
(2480-2700) | Std | 3.76 | 1.49 | 1.69 | 1.61 | 2.51 | 41.71 | 0.93 | 208.55 | 464.37 |
(23 accessions) | CV% | 14.77 | 7.8 | 7.73 | 17.71 | 4.92 | 21.93 | 20.29 | 21.93 | 20.3 |
Range | 18.82 | 7.51 | 6.5 | 5.59 | 11.43 | 144.89 | 3.32 | 724.46 | 1660 | |
class VI | Mean | 26.86 | 19.02 | 22.25 | 9.18 | 50.36 | 186.36 | 4.65 | 931.83 | 2326.11 |
(2710-2950) | Std | 2.22 | 1.43 | 0.77 | 0.7 | 2.55 | 38.98 | 0.97 | 194.92 | 485.93 |
(9 accessions) | CV% | 8.26 | 7.54 | 3.48 | 7.63 | 5.06 | 20.92 | 20.89 | 20.92 | 20.89 |
Range | 7.15 | 4.9 | 2.19 | 2.09 | 7.04 | 113.41 | 2.86 | 567.01 | 1430 | |
class VII | Mean | 24.8 | 19.88 | 22.65 | 9.37 | 51.87 | 199.04 | 4.77 | 995.22 | 2452.22 |
(3040-3440) | Std | 4.51 | 1.61 | 1.15 | 0.86 | 3.02 | 40.17 | 0.74 | 200.85 | 369.86 |
(8 accessions) | CV% | 18.18 | 8.07 | 5.09 | 9.13 | 5.83 | 20.18 | 15.51 | 20.18 | 15.51 |
Range | 13.26 | 4.22 | 3.53 | 2.38 | 9.69 | 122.08 | 1.82 | 610.39 | 910 |
LOC | REP | REP (LOC) | BLOC (REP) | GEN | GEN*LOC | ERROR | CV% | |
|---|---|---|---|---|---|---|---|---|
S.V | (d.f=1) | (d.f=1) | (d.f=1) | (d.f=40) | (d.f=125) | (d.f=125) | (d.f=210) | |
Days to 50% flowering | 2.14** | 38.12ns | 25.52ns | 9.05ns | 68.84** | 20.47ns | 15.26 | 7.41 |
Days to maturity | 2.41** | 38.11ns | 25.51ns | 131.54ns | 718.36** | 187.77ns | 161.94 | 11.95 |
Plant height (cm) | 2.47** | 38.12ns | 25.52ns | 32.03ns | 153.93** | 55.59ns | 36.27 | 10.05 |
Number of primary branches | 0.31ns | 38.11ns | 25.51ns | 0.71ns | 2.58** | 0.93ns | 0.74 | 10.08 |
Number of secondary branches | 0.15ns | 38.12ns | 25.52ns | 8.57ns | 40.44** | 15.49ns | 9.66 | 16.75 |
Number ofcapsules per plant | 0.24ns | 38.11ns | 25.51ns | 35.62ns | 209.72** | 68.17ns | 49.98 | 15.18 |
Number of seeds per capsule | 0.51ns | 38.11ns | 25.52ns | 0.52ns | 1.64** | 0.58ns | 0.42 | 9.12 |
1000 seeds weight (g) | 0.11ns | 38.12ns | 25.52ns | 0.85ns | 1.34** | 0.54ns | 0.34 | 8.42 |
Biological yield per plant (g) | 0.73ns | 38.11ns | 25.51ns | 8.34ns | 72.05** | 11.78ns | 7.71 | 18.55 |
Harvest index (%) | 0.83ns | 38.12ns | 25.52ns | 8.54ns | 38.4** | 16.77ns | 7.5 | 8.36 |
Carbohydrate (%) | 0.58ns | 38.11ns | 25.51ns | 3.36ns | 31.62** | 15.08ns | 5.41 | 8.85 |
Crudeprotein (%) | 0.25ns | 38.11ns | 25.52ns | 0.93ns | 4.24** | 1.92ns | 0.92 | 5.04 |
Oleic acid (%) | 0.52ns | 38.25ns | 25.51ns | 1.12ns | 5.45** | 1.93ns | 1.39 | 5.35 |
Linoleic acid (%) | 0.15ns | 38.11ns | 25.57ns | 0.48ns | 4.16** | 1.77ns | 0.83 | 9.84 |
Linolenic acid (%) | 0.85ns | 38.11ns | 25.55ns | 2.38ns | 16.36** | 3.88ns | 2.98 | 3.41 |
Oil yield per plant (g plant-1) | 0.42ns | 37.85ns | 23.75ns | 8.32ns | 65.35** | 39.92ns | 37.47 | 3.21 |
Seed yield per plant (g plant-1) | 1.26** | 36.83ns | 22.57ns | 7.01ns | 8.05** | 1.17ns | 0.74 | 18.38 |
Oil yield (kg ha-1) | 0.62ns | 21629.41ns | 14479.5ns | 13793.53ns | 74197.99** | 18711.63ns | 17681.47 | 13.95 |
Seed yield (kg ha-1) | 2.21** | 38.12ns | 25.51ns | 80171.48ns | 321226.5** | 85662.7ns | 81946.74 | 12.23 |
HARC | Holeta Agricultural Research Center |
KARC | Kulumsa Agricultural Research Center |
EIAR | Ethiopian Institute of Agricultural Research |
EBI | Ethiopian Biodiversity Institute |
SNNP | Southern Nations and Nationalities Administrative Region |
| [1] | Diederichsen A, Kusters PM, Kessler D, Bainas Z, Gugel RK. Assembling a core collection from the flax world collection maintained by plant gene resources of Canada. Genet Resour Crop Evol. (2013) 60: 1479–85. |
| [2] | Kaur, V., Singh, M., Wankhede, D. P., Gupta, K., Langyan, S., Aravind, J., Thangavel, B., Yadav. S. K., Kalia, S., Singh, K. and Kumar, A. 2023. Diversity of Linum genetic resources in global genebanks: from agro-morphological characterisation to novel genomic technologies: A review Front. Nutr. 10: 1165580. |
| [3] | Mhiret WN, Heslop-Harrison JS. Biodiversity in Ethiopian linseed (Linum usitatissimum L.): molecular characterization of landraces and some wild species. Genet Resour Crop Evol. (2018) 65: 1603–14. |
| [4] | Vavilov, N. I. (1951). The Origin, Variation, Immunity and Breeding of Cultivated Plants, Vol. 13. The Ronald Press Company, New York, pp. 20–43. |
| [5] | Hoque A, Fiedler JD, Rahman M. Genetic diversity analysis of a flax (Linum usitatissimum L.) global collection. BMC Genomics. (2020) 21: 557. |
| [6] | Adugna, W. and Labuschagne, M. T. 2004. Diversity analysis in Ethiopian and some exotic collections of linseed. S. Afr. J. Plant Soil 21: 53-58. |
| [7] | Worku N, Heslop-Harrison JS, Adugna W. Diversity in 198 Ethiopian linseed (Linum usitatissimum) accessions based on morphological characterization and seed oil characteristics. Genet Resour Crop Evol. (2015) 62: 1037–53. |
| [8] | Liu FH, Chen X, Long B, Shuai RY, Long CL. Historical and botanical evidence of distribution, cultivation and utilization of Linum usitatissimum L. (flax) in China. Veget Hist Archaeobot. (2011) 20: 561–6. |
| [9] | Zare S, Mirlohi A, Saeidi G, Sabzalian MR, Ataii E. Water stress intensified the relation of seed color with lignan content and seed yield components in flax (Linum usitatissimum L.). Sci Rep. (2021) 11: 23958. |
| [10] | DinsaYadetaDabalo, Chandra Sekhar Singh, B. and BulchaWeyessa. 2020. Genetic variability and association of characters in linseed (Linumusitatissimum L.) plant grown in central Ethiopia region. Saudi Journal of Biological Sciences, 27(8): 2192–2206. |
| [11] | van Zeist W, Bakker-Heeres JAH. Evidence for linseed cultivation before 6,000 B.C. J Archaeol Sci. (1975) 2: 215–9. |
| [12] | De Silva SF, Alcorn J. Flaxseed lignans as important dietary polyphenols for cancer prevention and treatment: chemistry, pharmacokinetics, and molecular targets. Pharmaceuticals. (2019) 12: 68. |
| [13] | Adolphe JL, Whiting SJ, Juurlink BH, Thorpe LU, Alcorn J. Health effects with consumption of the flax lignan secoisolariciresinol diglucoside. Br J Nutr. (2020) 103: 929–38. |
| [14] | ESS (Ethiopian Statistics Service). 2022. Agricultural Samples Survey 2021/22 (2014 E.C.) Volume I. Report on Area and Production of Major Crops (Private Peasant Holdings, Meher Season), statistical bulletin 59, Addis Ababa, April, 2022. |
| [15] | Hussain ME, Goyal VK, Paul PJ, Yadav Y, Jha UC, Moitra PK. Assessment of genetic variability, diversity, and identification of promising lines in linseed germplasm for harnessing genetic gain in central plain of the Indian subcontinent. J Plant Breed Crop Sci. (2022) 14: 12–20. |
| [16] | Kumar M, Patel M, Chauhan R, Tank C, Solanki S. Delineating multivariate divergence, heritability, trait association and identification of superior omega-3-fatty acid specific genotypes in linseed (Linum usitatissimum L.). Genetika. (2021) 53: 825–36. |
| [17] | Tadele Tadesse, Parven A, Singh H, Bulcha Weyessa. Estimates of variability and heritability in linseed germplasm. Int J Sustain Crop Prod. (2010) 5: 8–16. |
| [18] | Mulusew Fikere, Firew Mekbib, Adugna Wakjira. Seed oil diversity of Ethiopian linseed (Linum usitatissimum L.) landraces accessions and some exotic cultivars. Afr J Biochem Res. (2013) 7: 76–85. |
| [19] | Mulusew Fikre Ali, Firew Mekbib, Adugna Wakjira. Morphological diversity of Ethiopian linseed (Linum usitatissimum L.) landrace accessions and non-native cultivars. J Plant Breed Genet. (2014) 2: 115–24. |
| [20] | Johnson HW, Robinson HF, Comstock R. (1955). Estimates of Genetic and Environmental Variability in Soybeans. Agronomy J, 47(7): 314-318. |
| [21] | Rajanna B, Gangaprasad S, Shanker Goud I, Dushyantha Kumar BM, Girijesh GK and Sathish KM. Genetic variability, heritability and genetic advance of yield components and oil quality parameters in linseed (Linum usitatissimum L.). International Journal of Chemical Studies 2020; 8(1): 1768-1771. |
| [22] | Vipin Kumar Singh, SA Kerkhi, ShivendraPratap Singh and PrakritiTomar. Study on genetic variability, heritability and genetic advance for grain yield and yield component traits (Linumusitatissimum L.). Journal of Pharmacognosy and Phytochemistry (2019) 8: 761-765. |
| [23] | You FM, Jia G, Xiao J, Duguid SD, Rashid KY, Booker HM, et al. Genetic variability of 27 traits in a core collection of flax (Linum usitatissimum L.). front. Plant Sci. (2017) 8: 1636. |
| [24] | Saroha A, Pal D, Kaur V, Kumar S, Bartwal A, Aravind J, et al. Agro-morphological variability and genetic diversity in linseed (Linum usitatissimum L.) germplasm accessions with emphasis on flowering and maturity time. Genet Resour Crop Evol. (2022) 69: 315–33. |
| [25] | Ashok Kumar Meena, Sandhya Kulhari and Manoj Kumar (2023). Genetic variability, heritability and correlation coefficient in linseed (Linum usitatissimum L.). The Pharma Innovation Journal 2023; 12(3): 3011-3015. |
| [26] | HARC. Annual Research Report for the Period 2015/16; Holeta Agricultural Research Centre: Oromia, Ethiopia, 2016. |
| [27] | KARC. Annual Research Report for the Period 2015/16; Kulumsa Agricultural Research Centre: Oromia, Ethiopia, 2016. |
| [28] | EAA (Ethiopian Agriculture Authority). 2021. Plant Variety Release, Protection and Seed Quality Control Directorate, Crop Variety Register, Issue No. 24, June 2021, Addis Ababa, Ethiopia. |
| [29] | Agarwal, B. L. (1996). Basic Statistics, 3rd ed. New Age International (P) Limited, New Delhi, 713 pp. |
| [30] | Patterson and Williams; A new class of resolvable incomplete block design, Biometrika Vol, 63. No. 1 (April, 1976), pp 83-92. |
| [31] | SAS Institute (2001). SAS software. SAS Institute INC., Cary. NC. USA. |
| [32] | Burton GW, Devane EH. Estimating heritability in tall fescue (Festuca arundinaceia) from replicated clonal material. Agronomy Journal. 1953; 45: 478-481. |
| [33] | Singh RK, Chaudhary BD (1985). Biometrical Methods in Quantitative Genetics Analysis. Kalyanin publishers, New Delhi-Ludhiana. |
| [34] | Allard RW (1960). Principles of plant breeding. John Wiley and Sons. |
| [35] | Gomez, K. A., Gomez, A. A., 1984. Statistical procedure for Agriculture Research. John Willey and Sons, Singapore. |
| [36] | Gemechu Nedi Terfa and Gudeta Nepir Gurmu. Genetic variability, heritability and genetic advance in linseed (Linum usitatissimum L) genotypes for seed yield and other agronomic traits. Oil Crop Science. (2020) 156–160. |
| [37] | Deshmukh, S. N., Basu, M. S. and Reddy, P. S. 1986. Genetic variability, character association and path coefficient analysis of quantitative traits in Virginia bunch varieties of groundnut. Indian Journal of Agricultural Sciences 56: 816-821. |
| [38] | Fekadu Amsalu. 2020. Estimates of heritability, genetic and principal components analysis for yield and its traits in linseed genotypes (Linumusitatissimum L.) in central highlands of Ethiopia. International Journal of Research in Agriculture and Forestry, 7(9): 01-06. |
| [39] | Singh, P. and Narayanan, S. S. 1997. Biometrical Techniques in Plant Breeding. Kalyani Publishers. New Delhi, India. |
APA Style
Ghiday, T., Mohamed, W., Tsehaye, Y., Wakjira, A., Daba, C., et al. (2024). Genetic Variability and Heritability of Morpho-Agronomic Traits, Oil Yield and Fatty Acid Components in Linseed (Linumusitatissimum L.) Germplasm in Ethiopia. International Journal of Biomedical Science and Engineering, 12(2), 19-33. https://doi.org/10.11648/j.ijbse.20241202.11
ACS Style
Ghiday, T.; Mohamed, W.; Tsehaye, Y.; Wakjira, A.; Daba, C., et al. Genetic Variability and Heritability of Morpho-Agronomic Traits, Oil Yield and Fatty Acid Components in Linseed (Linumusitatissimum L.) Germplasm in Ethiopia. Int. J. Biomed. Sci. Eng. 2024, 12(2), 19-33. doi: 10.11648/j.ijbse.20241202.11
AMA Style
Ghiday T, Mohamed W, Tsehaye Y, Wakjira A, Daba C, et al. Genetic Variability and Heritability of Morpho-Agronomic Traits, Oil Yield and Fatty Acid Components in Linseed (Linumusitatissimum L.) Germplasm in Ethiopia. Int J Biomed Sci Eng. 2024;12(2):19-33. doi: 10.11648/j.ijbse.20241202.11
@article{10.11648/j.ijbse.20241202.11,
  author = {Tadesse Ghiday and Wassu Mohamed and Yemane Tsehaye and Adugna Wakjira and Chemeda Daba and Teasfaye Disasa},
  title = {Genetic Variability and Heritability of Morpho-Agronomic Traits, Oil Yield and Fatty Acid Components in Linseed (Linumusitatissimum L.) Germplasm in Ethiopia
},
  journal = {International Journal of Biomedical Science and Engineering},
  volume = {12},
  number = {2},
  pages = {19-33},
  doi = {10.11648/j.ijbse.20241202.11},
  url = {https://doi.org/10.11648/j.ijbse.20241202.11},
  eprint = {https://article.sciencepublishinggroup.com/pdf/10.11648.j.ijbse.20241202.11},
  abstract = {Comprehensive information on genetic variability and selection parameters is very crucial to design breeding strategies. However, very limited information is available in Ethiopian linseed germplasm. Therefore, the present study was conducted to estimate genetic variability, broad sense heritability and genetic advance; and determine selection for 19 quantitative traits using 126 genotypes (120 Ethiopian linseed accessions and six released varieties). The analysis of variance showed highly significant (P < 0.01) differences for all of the traits demonstrating the presence of high genetic diversity among the studied linseed genotypes. Higher differences between PCV and GCV estimates were observed for seed yield per plant and biological yield per plant, signifying the importance of environmental factors influence. High heritability coupled with high genetic advance was observed for seed yield per plant and biological yield per plant, indicating that this high heritability is due to additive gene effects and therefore, selection can be effective for the improvement of linseed for these traits. In addition, moderate heritability coupled with moderate genetic advance was recorded for oil yield per hectare, number of capsules, number of secondary branches, days to maturity, seed yield per hectare and plant height. These results indicated the existence of intermediate expression in these traits for both additive and dominance gene effect. In the present study, high heritability coupled with high GAM was observed for seed yield per plant and biological yield per plant, indicating greater contribution of additive gene action for the expression of these traits; and therefore, improvement can be achieved through selection in these traits.
},
 year = {2024}
}
TY  - JOUR
T1  - Genetic Variability and Heritability of Morpho-Agronomic Traits, Oil Yield and Fatty Acid Components in Linseed (Linumusitatissimum L.) Germplasm in Ethiopia

AU  - Tadesse Ghiday
AU  - Wassu Mohamed
AU  - Yemane Tsehaye
AU  - Adugna Wakjira
AU  - Chemeda Daba
AU  - Teasfaye Disasa
Y1  - 2024/07/08
PY  - 2024
N1  - https://doi.org/10.11648/j.ijbse.20241202.11
DO  - 10.11648/j.ijbse.20241202.11
T2  - International Journal of Biomedical Science and Engineering
JF  - International Journal of Biomedical Science and Engineering
JO  - International Journal of Biomedical Science and Engineering
SP  - 19
EP  - 33
PB  - Science Publishing Group
SN  - 2376-7235
UR  - https://doi.org/10.11648/j.ijbse.20241202.11
AB  - Comprehensive information on genetic variability and selection parameters is very crucial to design breeding strategies. However, very limited information is available in Ethiopian linseed germplasm. Therefore, the present study was conducted to estimate genetic variability, broad sense heritability and genetic advance; and determine selection for 19 quantitative traits using 126 genotypes (120 Ethiopian linseed accessions and six released varieties). The analysis of variance showed highly significant (P < 0.01) differences for all of the traits demonstrating the presence of high genetic diversity among the studied linseed genotypes. Higher differences between PCV and GCV estimates were observed for seed yield per plant and biological yield per plant, signifying the importance of environmental factors influence. High heritability coupled with high genetic advance was observed for seed yield per plant and biological yield per plant, indicating that this high heritability is due to additive gene effects and therefore, selection can be effective for the improvement of linseed for these traits. In addition, moderate heritability coupled with moderate genetic advance was recorded for oil yield per hectare, number of capsules, number of secondary branches, days to maturity, seed yield per hectare and plant height. These results indicated the existence of intermediate expression in these traits for both additive and dominance gene effect. In the present study, high heritability coupled with high GAM was observed for seed yield per plant and biological yield per plant, indicating greater contribution of additive gene action for the expression of these traits; and therefore, improvement can be achieved through selection in these traits.

VL  - 12
IS  - 2
ER  -
Ethiopian Institute of Agricultural Research, Holeta Agricultural Research Center, Holeta, Ethiopia
Information