During sand and dust storm (SDS) events, atmospheric suspension and transport of sand and dust brings a reasonable amount of electrification in the atmosphere which plays a very important role in the atmosphere-ionosphere coupling. The Godzilla SDS began on 5th June 2020 in Algeria following a decrease in pressure and spread to other areas across the Sahara between 6th and 28th June 2020. Using SDS data from Copernicus Sentinel-5P satellite mission and Vertical Total Electron Content (VTEC) data from four GNSS receiver stations: IFR1 (Ifrane Seismic), MELI (Melilla), TETN (Tetouan) and OUCA (Ouca) over Morocco, we investigate the possible ionospheric TEC variability over the four GNSS receiver stations during the Godzilla SDS event which was tracked using the Sentinel-5P Satellite mission. Solar wind parameters: Horizontal component of Interplanetary Magnetic Field (IMF-Bz), interplanetary Electric Field (IEF-Ey) and solar wind speed (V) and geomagnetic indices: Disturbance Storm Time (Dst) and Planetary K (Kp) indices were examined and showed very minimal geomagnetic influence during the period. We observed major ionospheric disturbances over the four Global Navigation Satellite System (GNSS) receiver stations on 16th, 17th, 18th, 21st, 22nd, 23rd 25th and 26th June 2020: the period with the Sentinel-5P Aerosol Index (SAI) of more than 4 as recorded by the Sentinel-5P Satellite engine. The daily VTEC values over the four GNSS receiver stations recorded continuous electron density perturbations during these days. Apart from the ionospheric TEC perturbations, significant enhancements and decreases in daily maximum VTEC values over the four GNSS receiver stations were also noted. These were attributed to the changes in the atmospheric electric fields generated by the SDS event. The VTEC plots for each day exhibited similar trends, hence exhibited the same ionospheric dynamics. VTEC depletions of depths 3 to 6 TECU over all the four GNSS receiver stations were noted on 12th, 14th, 17th, 20th and 25th June 2020. Nighttime VTEC enhancements were also noted and majorly occurred between 20:00 and 21:00 UT on 9th, 13th, 15th, 17th, 19th, 20th and 21st June 2020. This was attributed to the development of the electron avalanche processes including dust and electron absorption or losses and the active conversion to electron dissociative attachment leading to electron excitation. In conclusion, the Godzilla SDS of June 2020 led to the electron density perturbations over Morocco.
| Published in | International Journal of Astrophysics and Space Science (Volume 12, Issue 1) |
| DOI | 10.11648/j.ijass.20241201.11 |
| Page(s) | 1-16 |
| Creative Commons |
This is an Open Access article, distributed under the terms of the Creative Commons Attribution 4.0 International License (http://creativecommons.org/licenses/by/4.0/), which permits unrestricted use, distribution and reproduction in any medium or format, provided the original work is properly cited. |
| Copyright |
Copyright © The Author(s), 2024. Published by Science Publishing Group |
Godzilla Sand and Dust Storm, Atmospheric Electric Fields, Aerosols, Vertical Total Electron Content
 (1)
(1)  (2)
(2)  (3)
(3)  is given by Equation 4:
  (4)
(4) 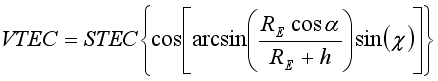 (5)
(5) Station ID | Station Name | Geographic Latitude | Geographic Longitude | Geomagnetic Latitude | Geomagnetic Longitude | Local Time |
|---|---|---|---|---|---|---|
MELI | Melilla | 35.28°N | -2.95°E | 26.67°N | 73.64°E | UT-1 |
IFR1 | Ifrane Seismic | 33.52°N | -5.13°E | 24.23°N | 71.59°E | UT-1 |
OUCA | Ouca | 31.206°N | -7.87°E | 21.09°N | 69.02°E | UT-1 |
TETN | Tetouan | 35.56°N | -5.36°E | 27.35°N | 71.78°E | UT-1 |
 =
=  (6)
(6) DATE | GNSS Receiver Station | Occurrence Time |
|---|---|---|
9th June 2020 | IFR1, OUCA, MELI, TETN | 20:00 UT |
13th June 2020 | IFR1, OUCA, MELI, TETN | 21:00 UT |
15th June 2020 | IFR1, OUCA, MELI, TETN | 20:00 UT |
17th June 2020 | IFR1, OUCA, MELI, TETN | 20:00 UT |
19th June 2020 | IFR1, OUCA, MELI, TETN | 20:00 UT |
20th June 2020 | IFR1, OUCA, MELI, TETN | 20:00 UT |
21st June 2020 | IFR1, OUCA, MELI, TETN | 20:00 UT |
ESA | European Space Agency |
GEC | Global Electric Circuit |
GEE | Google Earth Engine |
GIM | Global Ionospheric Maps |
GNSS | Global Navigation Satellite System |
GPS | Global Positioning System |
IEF | Interplanetary Electric Field |
IMF | Interplanetary Magnetic Field |
Kv | Kilo-Volt |
Kv/m | Kilo-Volt Per Metre |
MHz | Mega-Hertz |
NOAA | National Oceanic and Atmospheric Administration |
PPP | Precise Point Positioning |
RINEX | Receiver Independent Exchange |
RST | Robust Satellite Technology |
SAI | Sentinel-5P Aerosol Index |
SEVIRI | Spinning Enhanced Visible & Infrared Imager |
SDS | Sand and Dust Storm |
STEC | Slant Total Electron Content |
TEC | Total Electron Content |
TECU | Total Electron Content Unit |
UT | Universal Time |
USA | United States of America |
| [1] | WBO-Bulletin-2015. Airborne dust: A hazard to human health, environment and society, 2022, vol 64(2). |
| [2] | Borunda, A. Saharan dust is bad for health. But it is also crucial to Earths biology and climate. National geographic, 2020. |
| [3] | Yu, H., Chin, M., Yuan, T. L., Bian, H., Remer, L. A., Prospero, J. M., Omar, A, et al., The fertilizing role of the African dust in the Amazon rainforest: A first multi-Year assessment based on CALIPSO lidar observations. Geophys. Res. Lett., 42, 2015, 1984-1991, |
| [4] | Remini, B. The Sahara: A wind dynamics on surface and water in depth. Larhyss Journal 47(2021), 189-207, |
| [5] | Zhongming, Z., Linong, L., Xiaona, Y., Wangqiang, Z., Wei, L. Satellites and Unusual Sahara dust plume, 2020. |
| [6] |
Asare-Ansah, A. B., Twumasi, Y. A., Ning, Z. H., Ansah, P. B., Frimpong, D. B., Owusu, F., Apraku, C. Y., Anokye, M., Loh, M., Armah, R. D. N., Opong, J. Tracking the Godzilla Dust plume using the Google Earth Engine Platform. The international Archives of the photogrammetry, Remote sensing and spatial information sciences, Vol. XLVI-M-2-2022, ASPRS 2022 Annual conference, 6-8 February and 21-25 March 2022, Denver, Colorado, USA and Virtual.
https://doi.org/10.5194/isprs-Archives-XLVI-M-2-2022-33-2022 |
| [7] | Zhao, B., Wan, W., Lie, L., et al. Features of annual and semi-annual variations derived from the global ionospheric of total electron content. Annales Geophysicae, Copernicus GmbH 2007, pg 2513-2527. |
| [8] | Gundala, S. S., Jakkampudi, C. S., Yadavalli, A., (2021). Ionospheric total electron content and scintillations characteristics from GPS signal observations at a low latitude station, (2021, Materials today: Proceedings. |
| [9] | Rukundo, W., Shiokawa, K., Alsaid, A., et al. A machine learning approach for total electron content (TEC) prediction over the northern anomaly crest in Egypt, 2022. Advances in space Research. |
| [10] | Shim, J. A. S. Analysis of total electron content (TEC) variation over low-middle Latitude ionosphere. PhD thesis, 2009, Uta University. Paper 403. |
| [11] | Harrison, R. G., Barth, E., Esposito, F., Merrison, J., Montmessin, F., Aplin, K. L., Borlina, C., Berthelier, J. J., Deprez, G., Farrell, W. M., Houghton, S. N., Zimmerman, M. Applications of electrified dust and dust device electrodynamics to Martian Atmospheric electricity. Space scipex, 2016, 203: 299-345. |
| [12] | Pulinets, S., Ouzoinov, D. The possibility of earthquake forecasting. Learning from nature. IOP publishing, 2018, Bristol pg. 167. |
| [13] | Pulinets, S., Davidenko, D. Ionospheric precursors of earthquakes and Global Electric Circuit. Adv. In space Res. 53, 2014, 709-723. |
| [14] | Pulinets, S., Davidenko, D. and Pulinets, M. Atmosphere – ionosphere coupling induced by volcano eruptions and dust storms and role of GEC as the agent of geopsheres interaction. Advances in space research, 2022, |
| [15] | Hargreaves, J. K. The solar-terrestrial environment, Cambridge Atmospheric and Space Sciences series, 1992, Cambridge Univ. Press, Cambridge, UK. |
| [16] | Hoppel, W. A., Anderson, J. C. W. Atmospheric electricity in the planetary boundary layer. In: The Earth’s Electrical Environment. National Academic Press, Washington, DC, 1986, pp. 149–165. |
| [17] | Gringel, W., Rosen, J. M. and Hofmann, D. J. Electrical structure from 0 to 30 km atmospheric electricity in the planetary boundary layer: The Earth’s electrical environment; National Academic press: Washington DC, USA, 1986, PP 166-182. |
| [18] | Pulinets, S. A., Boyarchuk, K. A., Khagai, V. V., Kim, V. P. and Lomonosov, A. M. Quasi-electrostatic model of the atmosphere-thermosphere-ionosphere coupling. Adv Space Res. 2000, 26, 1209-1218. |
| [19] | Ulanowski, Z., Bailey, J., Lucas, P. W., Hough, J. H. and Hirst, E. Alignment of Atmospheric mineral dust due to electric field. Atmos. Chem. Phys. 7, 2007, 6161-6173. |
| [20] | Tramutoli, V., Marchese, F., Falconieri, A., Fillizola, C., Genzano, N., Hattori, K., Lisi, M., Liu, J., Ouzounov, D., Parrot, M., Pergola, N. and Pulinets, S. Tropospheric and ionospheric anomalies induced by volcanic and Sahara Dust events as part of the geosphere interaction phenomena. Geosciences 2019, 9, 177, |
| [21] | Seemala, G. and Valadare, C. Statistics of total electron content depletions observed over the South American continent for the year 2008, Radio Science, 2011, vol. 46. Gurtner, W., Estey, L. (2007) Rinex-the receiver independent exchange format-version 3.00. Astronomical Institute, University of Bern and UNAVCO, Bolulder, Colorado. |
| [22] | Gurtner W., Estey, L. RINEX the receiver independent exchange format-version 3.00. Astronomical institute, University of Bern and UNAVCO, Bolulder, Colorado, 2007. |
| [23] | Tariku YA. Patterns of gps-tec variation over low-latitude regions (African sector) during the deep solar minimum (2008 to 2009) and solar maximum (2012 to 2013) phases. Earth, Planets and Space, 2015, 67(1): 1–9. |
| [24] | Horvath I, Crozier S. Software developed for obtaining GPS-derived total electron content values. Radio Science, 2007, 42(02): 1–20. |
| [25] | Cepni MS, Potts LV, Miima JB. High-resolution station-based diurnal ionospheric total electron content (TEC) from dual-frequency GPS observations. SpaceWeather, 2013, 11(9): 520–528. |
| [26] | Ma X, Maruyama T, Ma G, et al. Three-dimensional ionospheric tomography using observation data of GPS ground receivers and ionosonde by neural network. Journal of Geophysical Research: Space Physics, 2005, 110(A5). |
| [27] | Jin, S., Park, J., Wang, J., Choi, B. and Park, P. Electron density profiles derived from Ground-based observations. The Journal of Navigation, 2006, 59(3): 395-401. |
| [28] | Heise S, Jakowski N, Wehrenpfennig A, et al. Sounding of the topside ionosphere/ plasmasphere based on GPS measurements from champ: Initial results. Geophysical Research Letters, 2002, 29(14): 44–1. |
| [29] | Jawoski, N., Mayer, C., Hoque, M. and Wilken, V. Total electron content models and their use in ionosphere monitoring. Radio science, 2011, 46(06): 1-11. |
| [30] | Ciraolo, L., Azpilicueta, F., Brunini, C., Meza, A. and Radicella, S. M. Calibration errors on experimental slant total electron content determined by the GPS. Journal of Geodesy, 2007, 81: 111-120. |
| [31] | Kassa T, Damtie B. Ionospheric irregularities over Bahir dar, Ethiopia during selected geomagnetic storms. Advances in Space Research, 2017, 60 (1): 121–129. |
| [32] | Otsuka, Y., Ogawa, T., Saito, A., Tsugawa, T., Fukao, S., Miyazaki, S. A new Technique for mapping of total electron content using GPS network in Japan. Earth, Planets and space. 2002, 54(1): 63-70. |
| [33] | Sardon, E. and Zarraoa, N. Estimation of total electron using GPS data: How stable are the differential satellite and receiver instrumental biases? Radio science, 1997, vol. 32, No. 5, pp. 1899-1910. |
| [34] | Gorelick, N., Hancher, M., Dixon, M., Ilyushchenko, S., Thau, D., Moore, R. (2017). Google Earth Engine: Planetary-scale geospatial analysis for everyone. Remote sensing and Environment, 2017, 202, 18-27. |
| [35] | De Graaf, M., Stammes, P., Torres, O., Koelemeijer, R. B. A. Absorbing Aerosol Index: Sensitivity analysis, application to GOME, and comparison to TOMS. Journal of Geophysical Research: Atmospheres, 2005, 110(D1). |
| [36] | Jethva, H., Satheesh, S. K., Srinivasan, J. Seasonal variability of aerosols over the Indo-Gangetic basin. Journal of Geophysical Research: Atmospheres, 2005, 110(D21). |
| [37] | Althaf, P., Shaeb, K. H. B., Kumar, K. R. Hotspot analysis and long-term trends of absorbing aerosol index from dust emissions were measured by the Ozone measuring Instrument at different Urban locations in India from 2005 to 2008. Atmospheric environment, 2022, 118933. |
| [38] |
Warren, C. Godzilla dust storm traced to shaky northern jet stream. Retrieved May 2023, from science:
https://www.science.org/content/article/godzilla-dust-storm-Traced-shaky-northern-jet-stream,2022 |
| [39] | Grousset, F. E., Ginoux, P., Bory, A., Biscaye, P. E. Case study of a Chinese dust plume reaching the French Alps. Geophysical Research Letters, 2003, 30(6), 1277, |
| [40] | Kamide, Y. and Chian, A. Hand Book of the Solar-Terrestrial environment. Springer Berlin Heidelberg, New York. 2007, ISBN 978-3-540-46314-6. |
| [41] | Bagiya, S. Mala, Joshi, H. P., Iyer, K. N., Aggarwal, M., Ravindran, S., & Pathan, B. M. TEC variations during low solar activity period (2005-2007) near the Equatorial Ionospheric Anomaly Crest Region in India. Annales Geophysicae, 2009, 27, pp. 1047-1057. |
| [42] | Fayose, R. S., Oladosu O. R., Rabius A. B. and Grooves. Variation of Total Electron Content [TEC] and Their Effect on GNSS over Akure, Nigeria. |
| [43] | Jackson, W. M. Farrell. Electrostatic fields in dust devils: an analog to Mars. IEEE Trans. Geosci. RemoteSens. 2006, 44(10), 2942–2949. |
| [44] | Williams, E., Nathou, N., Hicks, E., Pontikis, C., Russel, B., Miller, M., Bartholomew, M. J. The electrification of dust-lofting gust fronts (‘haboobs’) the Sahel. Atmos. Res. 2009, 91, 292–298. |
| [45] | Duff, N., Lacks, D. J. Particle dynamics simulations of triboelectric charging in granular insulator systems. J. Electrost. 2008, 66, 51. |
| [46] | Kelley, Michael C. The Earth’s Ionosphere: Plasma Physics and Electrodynamics, 1998, Academic Press. |
| [47] |
Horvath, I., and Essex, E. A. Investigating the mid-latitude nighttime TEC enhancements their relation to the low-latitude ionosphere and at low sunspot numbers, in: Workshop on the Applications of Radios Science, 2000,
http://www.sws.bom.gov.au/IPSHosted/NCRS/wars/wars2000/commg/horvath.pdf |
| [48] | Chen, Y., Ma, G., Huang, W., Shen, H., & Li, J. Night-time total electron content enhancements at equatorial anomaly region in China. Advances in Space Research, 2008, 41(4), 617-623. |
| [49] | Jackson, T. L., Farrell, W. M., Delory, G. T., Nithianandam, J. Effect of dust absorption on the electron avalanche process occurring within Martian dust storms. Geophys. Res. Lett., 2008, 35, L1620. |
| [50] | Kok, J. F., Renno, N. O. Electrification of wind-blown sand on Mars and its implications for atmospheric chemistry. Geophys. Res. Lett., 2009, 36, L05202. |
| [51] | Jackson T. L. et al. Martian dust devil electron avalanche process and associated electrochemistry. J. Geophys. Res., 2010, 115, E05006 (2010). |
| [52] | Seemala Seemala, G. K. & Valladares, C. E. Statistics of total electron content depletions observed over the South American continent for the year 2008. Radio Sci., 2008, 46, RS5019, |
| [53] | Farrell, W. M., McLain, J. L., Collier, M. R., Keller, J. W., Jackson, T. J., Delory, G. T. Is the electron avalanche process in a Martian dust devil self-quenching? Icarus, 2015, 254, 333–337. |
APA Style
Edward, U., Uga, C. I., Odhiambo, A. D., Adhikari, B., Gautam, S. P., et al. (2024). Variability of Ionospheric Total Electron Content Over Morocco During the Godzilla Sand and Dust Storm of June 2020. International Journal of Astrophysics and Space Science, 12(1), 1-16. https://doi.org/10.11648/j.ijass.20241201.11
ACS Style
Edward, U.; Uga, C. I.; Odhiambo, A. D.; Adhikari, B.; Gautam, S. P., et al. Variability of Ionospheric Total Electron Content Over Morocco During the Godzilla Sand and Dust Storm of June 2020. Int. J. Astrophys. Space Sci. 2024, 12(1), 1-16. doi: 10.11648/j.ijass.20241201.11
AMA Style
Edward U, Uga CI, Odhiambo AD, Adhikari B, Gautam SP, et al. Variability of Ionospheric Total Electron Content Over Morocco During the Godzilla Sand and Dust Storm of June 2020. Int J Astrophys Space Sci. 2024;12(1):1-16. doi: 10.11648/j.ijass.20241201.11
@article{10.11648/j.ijass.20241201.11,
  author = {Uluma Edward and Chali Idosa Uga and Athwart Davis Odhiambo and Binod Adhikari and Sujan Prasad Gautam and Ndinya Boniface and Omondi George and Ashutosh Giri and Dessalegn Teferi and Negasa Belay and Ashok Silwal},
  title = {Variability of Ionospheric Total Electron Content Over Morocco During the Godzilla Sand and Dust Storm of June 2020
},
  journal = {International Journal of Astrophysics and Space Science},
  volume = {12},
  number = {1},
  pages = {1-16},
  doi = {10.11648/j.ijass.20241201.11},
  url = {https://doi.org/10.11648/j.ijass.20241201.11},
  eprint = {https://article.sciencepublishinggroup.com/pdf/10.11648.j.ijass.20241201.11},
  abstract = {During sand and dust storm (SDS) events, atmospheric suspension and transport of sand and dust brings a reasonable amount of electrification in the atmosphere which plays a very important role in the atmosphere-ionosphere coupling. The Godzilla SDS began on 5th June 2020 in Algeria following a decrease in pressure and spread to other areas across the Sahara between 6th and 28th June 2020. Using SDS data from Copernicus Sentinel-5P satellite mission and Vertical Total Electron Content (VTEC) data from four GNSS receiver stations: IFR1 (Ifrane Seismic), MELI (Melilla), TETN (Tetouan) and OUCA (Ouca) over Morocco, we investigate the possible ionospheric TEC variability over the four GNSS receiver stations during the Godzilla SDS event which was tracked using the Sentinel-5P Satellite mission. Solar wind parameters: Horizontal component of Interplanetary Magnetic Field (IMF-Bz), interplanetary Electric Field (IEF-Ey) and solar wind speed (V) and geomagnetic indices: Disturbance Storm Time (Dst) and Planetary K (Kp) indices were examined and showed very minimal geomagnetic influence during the period. We observed major ionospheric disturbances over the four Global Navigation Satellite System (GNSS) receiver stations on 16th, 17th, 18th, 21st, 22nd, 23rd 25th and 26th June 2020: the period with the Sentinel-5P Aerosol Index (SAI) of more than 4 as recorded by the Sentinel-5P Satellite engine. The daily VTEC values over the four GNSS receiver stations recorded continuous electron density perturbations during these days. Apart from the ionospheric TEC perturbations, significant enhancements and decreases in daily maximum VTEC values over the four GNSS receiver stations were also noted. These were attributed to the changes in the atmospheric electric fields generated by the SDS event. The VTEC plots for each day exhibited similar trends, hence exhibited the same ionospheric dynamics. VTEC depletions of depths 3 to 6 TECU over all the four GNSS receiver stations were noted on 12th, 14th, 17th, 20th and 25th June 2020. Nighttime VTEC enhancements were also noted and majorly occurred between 20:00 and 21:00 UT on 9th, 13th, 15th, 17th, 19th, 20th and 21st June 2020. This was attributed to the development of the electron avalanche processes including dust and electron absorption or losses and the active conversion to electron dissociative attachment leading to electron excitation. In conclusion, the Godzilla SDS of June 2020 led to the electron density perturbations over Morocco.
},
 year = {2024}
}
TY  - JOUR
T1  - Variability of Ionospheric Total Electron Content Over Morocco During the Godzilla Sand and Dust Storm of June 2020

AU  - Uluma Edward
AU  - Chali Idosa Uga
AU  - Athwart Davis Odhiambo
AU  - Binod Adhikari
AU  - Sujan Prasad Gautam
AU  - Ndinya Boniface
AU  - Omondi George
AU  - Ashutosh Giri
AU  - Dessalegn Teferi
AU  - Negasa Belay
AU  - Ashok Silwal
Y1  - 2024/07/15
PY  - 2024
N1  - https://doi.org/10.11648/j.ijass.20241201.11
DO  - 10.11648/j.ijass.20241201.11
T2  - International Journal of Astrophysics and Space Science
JF  - International Journal of Astrophysics and Space Science
JO  - International Journal of Astrophysics and Space Science
SP  - 1
EP  - 16
PB  - Science Publishing Group
SN  - 2376-7022
UR  - https://doi.org/10.11648/j.ijass.20241201.11
AB  - During sand and dust storm (SDS) events, atmospheric suspension and transport of sand and dust brings a reasonable amount of electrification in the atmosphere which plays a very important role in the atmosphere-ionosphere coupling. The Godzilla SDS began on 5th June 2020 in Algeria following a decrease in pressure and spread to other areas across the Sahara between 6th and 28th June 2020. Using SDS data from Copernicus Sentinel-5P satellite mission and Vertical Total Electron Content (VTEC) data from four GNSS receiver stations: IFR1 (Ifrane Seismic), MELI (Melilla), TETN (Tetouan) and OUCA (Ouca) over Morocco, we investigate the possible ionospheric TEC variability over the four GNSS receiver stations during the Godzilla SDS event which was tracked using the Sentinel-5P Satellite mission. Solar wind parameters: Horizontal component of Interplanetary Magnetic Field (IMF-Bz), interplanetary Electric Field (IEF-Ey) and solar wind speed (V) and geomagnetic indices: Disturbance Storm Time (Dst) and Planetary K (Kp) indices were examined and showed very minimal geomagnetic influence during the period. We observed major ionospheric disturbances over the four Global Navigation Satellite System (GNSS) receiver stations on 16th, 17th, 18th, 21st, 22nd, 23rd 25th and 26th June 2020: the period with the Sentinel-5P Aerosol Index (SAI) of more than 4 as recorded by the Sentinel-5P Satellite engine. The daily VTEC values over the four GNSS receiver stations recorded continuous electron density perturbations during these days. Apart from the ionospheric TEC perturbations, significant enhancements and decreases in daily maximum VTEC values over the four GNSS receiver stations were also noted. These were attributed to the changes in the atmospheric electric fields generated by the SDS event. The VTEC plots for each day exhibited similar trends, hence exhibited the same ionospheric dynamics. VTEC depletions of depths 3 to 6 TECU over all the four GNSS receiver stations were noted on 12th, 14th, 17th, 20th and 25th June 2020. Nighttime VTEC enhancements were also noted and majorly occurred between 20:00 and 21:00 UT on 9th, 13th, 15th, 17th, 19th, 20th and 21st June 2020. This was attributed to the development of the electron avalanche processes including dust and electron absorption or losses and the active conversion to electron dissociative attachment leading to electron excitation. In conclusion, the Godzilla SDS of June 2020 led to the electron density perturbations over Morocco.

VL  - 12
IS  - 1
ER  -
Department of Physics, Masinde Muliro University of Science & Technology, Kakamega, Kenya
Department of Physics, Jimma University, Jimma, Oromia, Ethiopia; Department of Space Science, University of Alabama in Huntsville, Alabama, USA
Department of Physics, Masinde Muliro University of Science & Technology, Kakamega, Kenya
Department of Physics, St. Xaviers’s College, Kathmandu, Nepal
Department of Space Science, University of Alabama in Huntsville, Alabama, USA
Department of Physics, Masinde Muliro University of Science & Technology, Kakamega, Kenya
Department of Physics and Materials Science, Maseno University, Maseno, Kenya
Department of Physics, St. Xaviers’s College, Kathmandu, Nepal
Department of Physics, Jimma University, Jimma, Oromia, Ethiopia
Department of Physics, Jimma University, Jimma, Oromia, Ethiopia
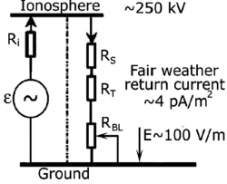
Figure 1. Model diagram of the Global Electric Circuit (GEC) [13, 14].
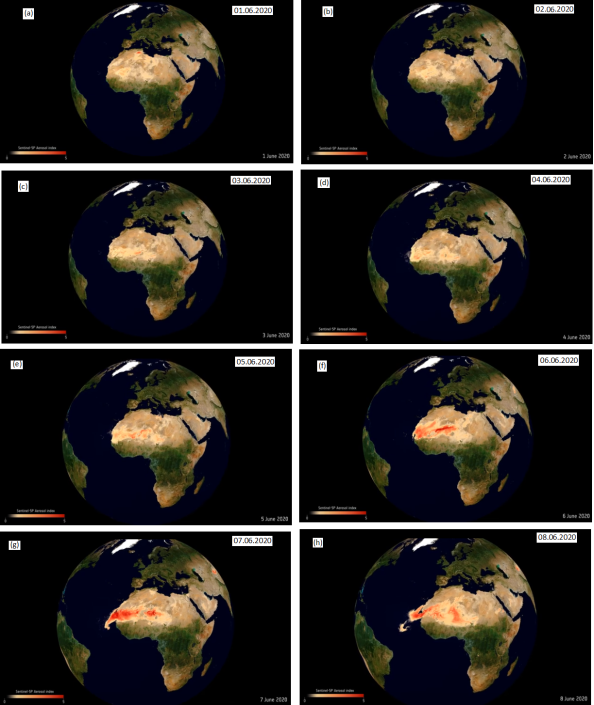
Figure 2. The Copernicus Sentinel-5P satellite images of Godzilla SDS over the Sahara for (a 01.06.2020 (b) 02.06.2020 (c) 03.06.2020 (d) 04.06.2020 (e) 05.06.2020 (f) 06.06.2020 (g) 07.06.2020 and (h) 07.06.2020 (Modified Copernicus Sentinel data, 2020, processed by ESA).
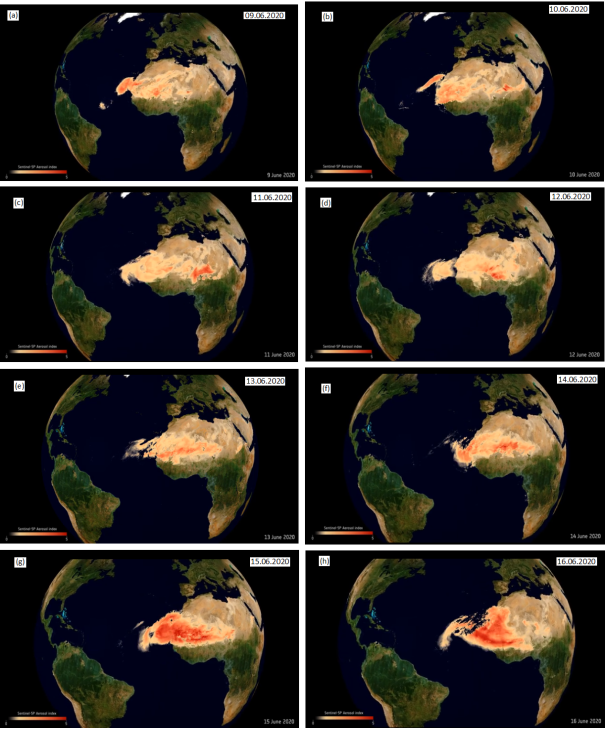
Figure 3. The Copernicus Sentinel-5P satellite images of Godzilla SDS over the Sahara for (a) 09.06.2020 (b) 10.06.2020 (c) 11.06.2020 (d) 12.06.2020 (e) 13.06.2020 (f) 14.06.2020 (g) 15.06.2020 and (h) 16.06.2020 (Modified Copernicus Sentinel data, 2020, processed by ESA).
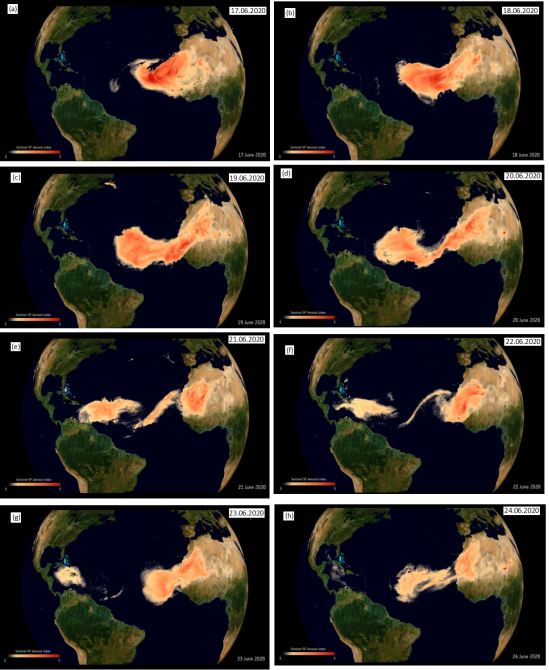
Figure 4. The Copernicus Sentinel-5P satellite images of Godzilla SDS over the Sahara for (a) 17.06.2020 (b) 18.06.2020 (c) 19.06.2020 (d) 20.06.2020 (e) 21.06.2020 (f) 22.06.2020 (g) 23.06.2020 and (h) 24.06.202 (Modified Copernicus Sentinel data, 2020, processed by ESA).
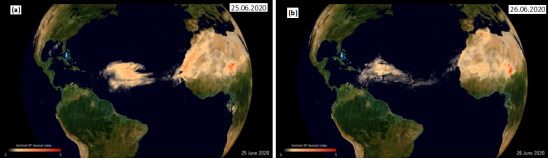
Figure 5. The Copernicus Sentinel-5P satellite images of Godzilla SDS over the Sahara for (a) 25.06.2020 and (b) 26.06.202 (Modified Copernicus Sentinel data, 2020, processed by ESA).
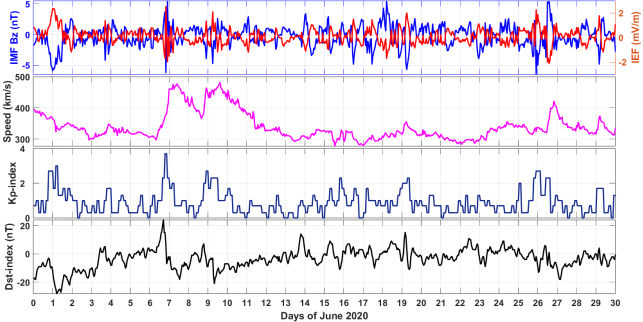
Figure 6. Variations of Solar wind parameters: IMF-Bz, IEF-Ey and V speed and the geomagnetic indices: Kp and Dst index, between 1st and 30th June 2020.
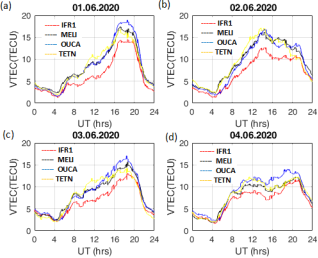
Figure 7. Plot of VTEC against UT for the period (a) 01.06.2020 (b) 02.06.2020 (c) 03.06.2020 and (d) 04.06.2020 over IFR1, MELI, OUCA and TETN GNSS receiver stations.
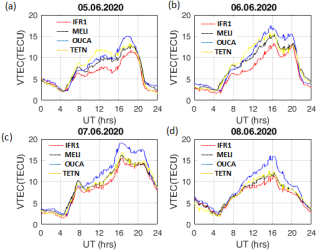
Figure 8. Plot of VTEC against UT for period (a) 05.06.20200 (b) 06.06.2020 (c) 07.06.2020 and 08.06.2020 over IFR1, MELI, OUCA and TETN.
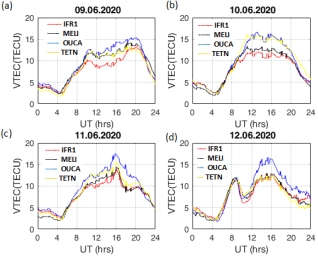
Figure 9. Plot of VTEC against UT for period (a) 09.06.2020 (b) 10.06.2020 (c) 11.06.2020 and (d) 12.06.2020 over IFR1, MELI, OUCA and TETN.
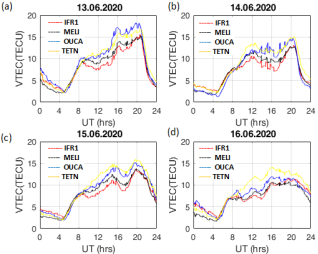
Figure 10. Plot of VTEC against UT for period (a) 13.06.2020 (b) 14.06.2020, (c) 15.06.2020 and (d) 16.06.2020 over IFR1, MELI, OUCA and TETN.
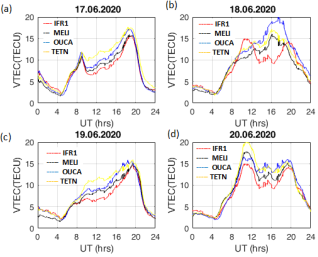
Figure 11. Plot of VTEC against UT for period (a) 17.06.2020 (b) 18.06.2020 (c) 19.06.2020 and (d) 20.06.2020 over IFR1, MELI, OUCA and TETN.
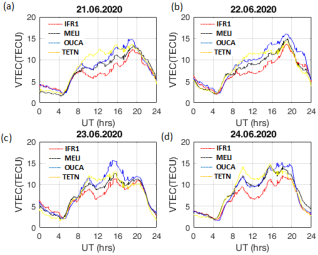
Figure 12. Plot of VTEC against UT for period (a) 21.06.2020 (b) 22.06.2020 (c) 23.06.2020 and (d) 24.06.2020 over IFR1, MELI, OUCA and TETN.
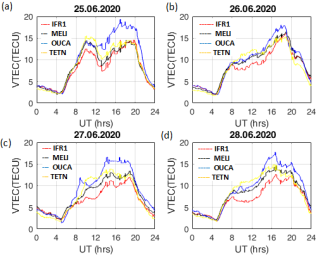
Figure 13. Plot of VTEC against UT for period (a) 25.06.2020 (b) 26.06.2020 (c) 27.06.2020 and (d) 28.06.2020 over IFR1, MELI, OUCA and TETN.
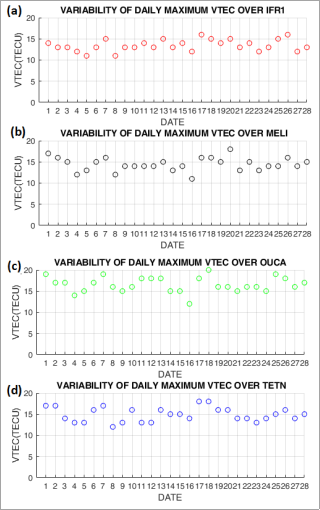
Figure 14. Scatter plots showing variability of daily maximum VTEC values over (a) IFR1, (b) MELI, (c) OUCA and (d) TETN between 1st and 28th June 2020.
Information

