1. Introduction
On a global scale, anthropogenic climate change is fundamentally altering the frequency, intensity, and predictability of extreme weather events. Climate extremes have become increasing frequent and intense under a changing climate, posing significant challenges to water resources, agriculture, ecosystems, and socioeconomic development. The Intergovernmental Panel on Climate Change (IPCC) has consistently documented accelerating global warming trends, which manifest as severe thermal anomalies and disrupted hydrological cycles worldwide
| [4] | Legg, S. (2021). IPCC, 2021: Climate change 2021-the physical science basis. Interaction, 49(4), 44–45.
https://doi.org/10.1017/9781009157896 |
| [12] | IPCC. (2021). Climate Change 2021: The Physical Science Basis. Contribution of Working Group I to the Sixth Assessment Report of the Intergovernmental Panel on Climate Change. Cambridge University Press. |
[4, 12]
. These shifts are not uniform; developing regions-particularly across Sub-Saharan Africa-bear a disproportionate burden of these impacts due to high socio-economic vulnerability and a heavy reliance on climate-sensitive sectors
| [13] | Niang, I., Ruppel, O. C., Abdrabo, M. A., Essel, A., Lennard, C., Padilla-Jaime, A., & Urquhart, P. (2014). Africa. In Climate Change 2014: Impacts, Adaptation, and Vulnerability. Cambridge University Press. |
[13]
.
To facilitate the systematic monitoring and assessment of climate variability and change at regional and global scales, the World Climate Research Programme's (WCRP) Expert Team on Climate Change Detection and Indices (ETCCDI) developed a standardized set of climate extreme indices derived from daily temperature and precipitation observations
| [1] | Data, C. (2009). Guidelines on analysis of extremes in a changing climate in support of informed decisions for adaptation. World Meteorological Organization, 1500, 72. |
| [10] | Zhang, X., Alexander, L., Hegerl, G. C., Jones, P., Tank, A. K., Peterson, T. C., Trewin, B., & Zwiers, F. W. (2011). Indices for monitoring changes in extremes based on daily temperature and precipitation data. Wiley Interdisciplinary Reviews: Climate Change, 2(6), 851–870. |
| [16] | Klein Tank, A. M. G., Zwiers, F. W., and Zhang, X.: Guidelines on Analysis of extremes in a changing climate in support of informed decisions for adaptation, in: Climate Data and Moni toring, (WCDMP-No. 72; p. 52), World Meteorological Organi zation,
https://library.wmo.int/doc_num.php?explnum_id=9419 (last access: 24 August 2022), 2009. |
[1, 10, 16]
. This internationally recognized framework provides a consistent methodology for quantifying changes in climate extremes, thereby enabling the development of comparable station-based and gridded datasets across diverse climatic regions. The ETCCDI core indices encompass a broad range of temperature and precipitation extremes, including consecutive dry and wet days (CDD and CWD), heavy precipitation events (R10mm and R20mm), maximum 1-day and 5-day precipitation totals (RX1day and RX5day), and temperature extremes and percentile-based indices such as TXx, TNx, TXn, TNn, TX90p, TN90p, TX10p, and TN10p. Collectively, these standardized indices provide a robust and universally applicable framework for detecting, monitoring, and comparing changes in climate extremes, thereby supporting assessments of localized environmental stress within the broader context of global climate change.
These indices quantify different aspects of climate extremes, including frequency, intensity, and duration. Among precipitation indices, Consecutive Dry Days (CDD) represents the maximum number of consecutive days with rainfall less than 1 mm, while Consecutive Wet Days (CWD) measures the maximum sequence of days receiving at least 1 mm of rainfall. Similarly, R10mm and R20mm quantify the annual number of heavy (≥10 mm) and very heavy (≥20 mm) rainfall days, respectively. In addition, the highest amount of rainfall dropped in a single day (RX1day) and over a consecutive 5-day period (RX5day), and the warm temperature extreme index (TXx-warmest day, TNn-coldest night, TX90p-warm day in%, TN90p-warm night in%). For temperature extremes, TX90p represents the percentage of days when daily maximum temperature exceeds the 90th percentile, serving as an indicator of warm daytime extremes
| [1] | Data, C. (2009). Guidelines on analysis of extremes in a changing climate in support of informed decisions for adaptation. World Meteorological Organization, 1500, 72. |
| [10] | Zhang, X., Alexander, L., Hegerl, G. C., Jones, P., Tank, A. K., Peterson, T. C., Trewin, B., & Zwiers, F. W. (2011). Indices for monitoring changes in extremes based on daily temperature and precipitation data. Wiley Interdisciplinary Reviews: Climate Change, 2(6), 851–870. |
| [16] | Klein Tank, A. M. G., Zwiers, F. W., and Zhang, X.: Guidelines on Analysis of extremes in a changing climate in support of informed decisions for adaptation, in: Climate Data and Moni toring, (WCDMP-No. 72; p. 52), World Meteorological Organi zation,
https://library.wmo.int/doc_num.php?explnum_id=9419 (last access: 24 August 2022), 2009. |
[1, 10, 16]
. These indices are widely applied for climate variability analysis, impact assessment, and adaptation planning across different climatic regions.
Across Africa, climate extremes have become more frequent and severe due to increasing climate variability and change. East Africa is particularly vulnerable because rainfall and temperature are strongly influenced by the Intertropical Convergence Zone (ITCZ), El Niño–Southern Oscillation (ENSO), the Indian Ocean Dipole (IOD), and complex topography. These climatic drivers have contributed to increasing droughts, floods, and temperature extremes across the region
| [13] | Niang, I., Ruppel, O. C., Abdrabo, M. A., Essel, A., Lennard, C., Padilla-Jaime, A., & Urquhart, P. (2014). Africa. In Climate Change 2014: Impacts, Adaptation, and Vulnerability. Cambridge University Press. |
| [15] | Gebrechorkos, S. H., Hülsmann, S., & Bernhofer, C. (2019). Changes in temperature and precipitation extremes in Ethiopia, Kenya, and Tanzania. International Journal of Climatology, 39, 18–30. https://doi.org/10.1002/joc.5777 |
[13, 15]
.
The impacts of extreme events are disproportionately borne by vulnerable populations and ecosystems, and this disparity is expected to intensify under continued climate change
| [9] | Stott, P. (2016). How climate change affects extreme weather events. Science, 352(6293), 1517–1518. |
[9]
. Moreover, the observed increases in the frequency and intensity of extreme weather events are projected to become more pronounced as the climate changes, with the characteristics of these extremes potentially evolving at a faster rate than the underlying climate mean state
| [8] | Seneviratne, S. I., Zhang, X., Adnan, M., Badi, W., Dereczynski, C., Luca, A. Di, Ghosh, S., Iskandar, I., Kossin, J., & Lewis, S. (2021). Weather and climate extreme events in a changing climate. Climate Change 2021: The Physical Science Basis: Working Group I Contribution to the Sixth Assessment Report of the Intergovernmental Panel on Climate Change, 1513–1766. https://doi.org/10.1017/9781009157896.013 |
[8]
.
Transitioning from the global to the regional level, the Horn of Africa stands out as one of the most climatologically volatile regions on the planet. Characterized by complex interactions between the El Niño-Southern Oscillation (ENSO), the Indian Ocean Dipole (IOD), and shifting monsoonal wind patterns, East Africa frequently experiences devastating cycles of prolonged droughts and catastrophic flooding
| [2] | Funk, C., Dettinger, M. D., Michaelsen, J. C., Verdin, J. P., Brown, M. E., Barlow, M., & Hoell, A. (2008). Warming of the Indian Ocean threatens eastern and southern African food security but could be mitigated by agricultural development. Proceedings of the National Academy of Sciences, 105(32), 11081–11086. https://doi.org/10.1073/pnas.0708196105 |
[2]
. In this regional matrix, rainfall variability directly dictates food security, water availability, and ecological stability. Over the past few decades, the region has seen a noticeable contraction in traditional rainy seasons, alongside an increase in highly intense, critical rainfall events that lead to severe soil erosion and infrastructure damage
.
At the heart of this regional vulnerability lies Ethiopia, a topographically diverse nation where microclimates range from alpine highlands to arid, low-lying deserts. Ethiopia's agrarian economy is profoundly dependent on three distinct seasons: the
Kiremt (June–September; JJAS), which supplies the main monsoon rainfall to the central and western highlands; the
Belg (February–May; FMAM), crucial for short-term agricultural planning; and the
Bega (October–January; ONDJ), which is predominantly dry but dictates secondary rains in the south-eastern lowlands
| [3] | Korecha, D., & Barnston, A. G. (2007). Predictability of June–September rainfall in Ethiopia. Monthly Weather Review, 135(2), 628–650. |
[3]
. Ethiopia, situated in the Horn of Africa, exhibits a highly complex and varied topography that fundamentally dictates its diverse microclimates and hydrological cycles. The nation's socio-economic structure relies intensely on rain-fed agriculture, making it profoundly vulnerable to anomalies in seasonal rainfall and extreme temperature thresholds lowlands
| [2] | Funk, C., Dettinger, M. D., Michaelsen, J. C., Verdin, J. P., Brown, M. E., Barlow, M., & Hoell, A. (2008). Warming of the Indian Ocean threatens eastern and southern African food security but could be mitigated by agricultural development. Proceedings of the National Academy of Sciences, 105(32), 11081–11086. https://doi.org/10.1073/pnas.0708196105 |
| [14] | Conway, D., Schipper, E. L. F., & Warren, R. (2004). Climate change impacts and adaptation in Africa: Review and prospects for Ethiopia. Climate Policy, 4(3), 323–337. |
[2, 14]
.
Over the past four decades, anthropogenic climate change has drastically intensified the frequency and magnitude of extreme weather events across Sub-Saharan Africa. Systematic evaluations utilizing standardized Expert Team on Climate Change Detection and Indices (ETCCDI) framework have become essential for characterizing these environmental shifts
| [10] | Zhang, X., Alexander, L., Hegerl, G. C., Jones, P., Tank, A. K., Peterson, T. C., Trewin, B., & Zwiers, F. W. (2011). Indices for monitoring changes in extremes based on daily temperature and precipitation data. Wiley Interdisciplinary Reviews: Climate Change, 2(6), 851–870. |
[10]
. In Ethiopia, analyzing rainfall anomalies and core rainfall indices-such as the number of heavy rainfall days (
,
), maximum daily intensities (
,
), and consecutive dry or wet periods (
,
)-reveals a stark geographic divergence between the high-yielding, resilient western provinces and the highly volatile, arid eastern lowlands
| [7] | Seleshi, Y., & Zanke, U. (2004). Recent changes in rainfall and rainy days in Ethiopia. International Journal of Climatology: A Journal of the Royal Meteorological Society, 24(8), 973–983. https://doi.org/10.1002/joc.1052 |
[7]
.
Accordingly, this study aims to investigate the spatiotemporal dynamics of Consecutive Dry Days (CDD), Consecutive Wet Days (CWD), the highest amount of rainfall dropped in a single day (RX1day) and over a consecutive 5-day period (RX5day). Similarly, heavy rainfall thresholds (R10mm and R20mm) quantify the annual number of heavy (≥10 mm) and very heavy (≥20 mm) rainfall days, respectively. The warm-cold day-nighttime temperature extreme index (Maximum of daily maximum temperature (warmest day) - (TXx), Minimum of daily minimum temperature (coldest night) - (TNn), Warm days (%) - (TX90p), Warm nights (%) - (TN90p, Cold days (%) - (TX10p), Cold nights (%) - (TN10p), Minimum of daily maximum temperature (Coldest day) - (TXn), and Maximum of daily minimum temperature (Warmest night) (TNx)), and their composite across El Nino-La Nina events over Ethiopia, East Africa.
The findings are expected to improve understanding of the spatial and temporal characteristics of climate extremes and provide scientific evidence for climate adaptation strategies, disaster risk reduction, and sustainable natural resource management in Ethiopia
| [10] | Zhang, X., Alexander, L., Hegerl, G. C., Jones, P., Tank, A. K., Peterson, T. C., Trewin, B., & Zwiers, F. W. (2011). Indices for monitoring changes in extremes based on daily temperature and precipitation data. Wiley Interdisciplinary Reviews: Climate Change, 2(6), 851–870. |
[10]
. Understanding these long-term spatiotemporal trends over study area is vital for building robust localized adaptation strategies, managing agricultural risk, and strengthening hydrometeorological resilience across Ethiopia's diverse landscapes.
3. Results and Discussion
3.1. Seasonal and Annual Rainfall Distribution
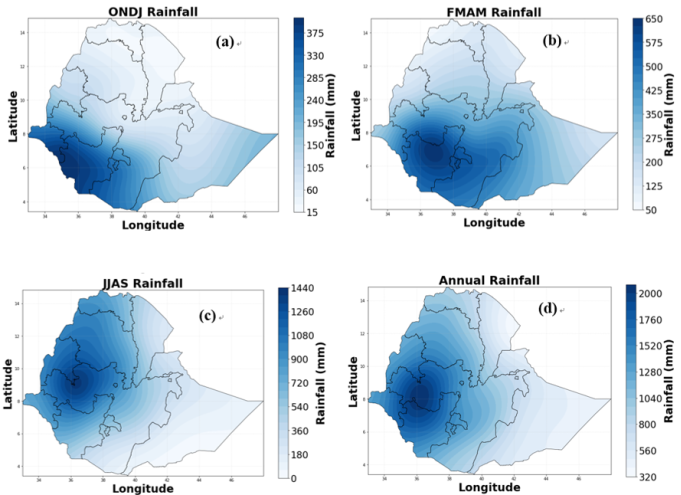
This set of maps analyzes how rainfall varies spatially across different seasons and over the entire year across Ethiopia. ONDJ Rainfall: Represents the October, November, December, and January season (often covering parts of the
Bega dry season or southern rainfall regions). It demonstrates that the southwestern parts receive the highest rainfall during this period (up to 375+ mm), whereas northern and northeastern regions remain predominantly dry (down to 15 mm) (
Figure 2a).
FMAM Rainfall: Represents the February, March, April, and May season (
Belg or short rainy season). Rainfall is heavily concentrated in the southwestern and southern highlands, reaching peaks around 650 mm, showing that this season critically supports agriculture primarily in these regions (
Figure 2b).
JJAS Rainfall / Climatology: Represents the June, July, August, and September season (
Kiremt or main rainy season). This is the most intense rainy period for the majority of the country. Rainfall peaks dramatically in the northwestern and western highlands (exceeding 1050 to 1440 mm), while the eastern and southern lowlands receive very little to no rainfall during these months (
Figure 2c).
Annual Rainfall: Summarizes the total yearly rainfall. It clearly establishes Ethiopia's strong rainfall gradient, showing that the southwest is the wettest region (exceeding 2000 mm annually), while the eastern and northeastern lowlands are extremely arid (receiving under 320 mm) (
Figure 2d).
Figure 2. Seasonal (a) Bega, (b) Belg, (c) Kiremt, and (d) Annual rainfall distribution during the period of 1981-2022.
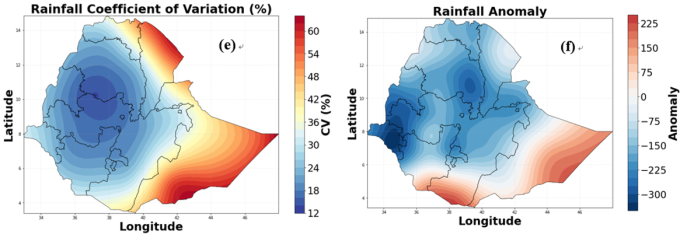
Rainfall Coefficient of Variation (CV %) measures the stability or reliability of rainfall. High CV values (orange to dark red, 48% to over 60%) are concentrated in the northern, northeastern, and southeastern lowlands, meaning rainfall there is highly volatile and unpredictable from year to year. Conversely, the western and southwestern highlands display a very low CV (blue, 12% to 24%), indicating highly reliable and stable annual rainfall (
Figure 3e).
Rainfall Anomaly depicts departures from the long-term historical average. The map shows significant negative anomalies (dark blue, down to -300) in the western and central parts, contrasted with positive anomalies (red) in the far south and southeast, indicating regional shifts or specific cyclical deviations from historical averages over the study period (
Figure 3f).
Figure 3. Spatial analysis of (e) Coefficient of variation (CV %) and (f) Rainfall Anomaly during the period of 1981-2022.
3.2. Extreme Rainfall Frequency Indices, Rainfall Intensity and Dry-Wet Spells
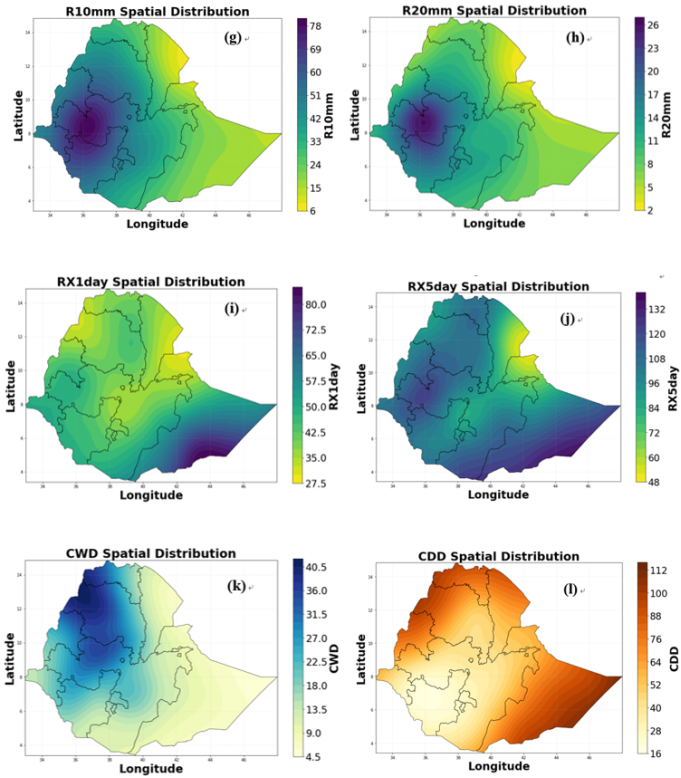
R10mm Spatial Distribution tracks the annual number of days with heavy rainfall (
10 mm). The western highlands experience the highest frequency (up to 78 days per year), whereas eastern areas see fewer than 6 to 15 days per year (
Figure 4g). R20mm Spatial Distribution tracks very heavy rainfall days (
20 mm). Following a similar pattern, the southwest/west experiences up to 26 days of very intense rainfall per year, while the rest of the country rarely sees such frequent daily extremes (
Figure 4h).
RX1day & RX5day Spatial Distribution maps capture the highest amount of rainfall dropped in a single day (RX1day) and over a consecutive 5-day period (RX5day). Interestingly, the highest single-day and 5-day extreme totals shift toward the south and southeastern lowlands (up to 80+ mm in a single day and 132+ mm in 5 days), implying that while these arid regions get less total rainfall, when it does rain, it often occurs as highly intense, potentially flood-inducing storm events (
Figures 4i & j).
Consecutive Wet Days (CWD) measures the maximum duration of consecutive rainy days. The northwestern and western highlands see prolonged wet spans (up to 40+ consecutive days), reflecting a sustained
Kiremt monsoon season (
Figure 4k). Consecutive Dry Days (CDD) measures the maximum duration of consecutive days without rain. The eastern, northeastern, and southeastern borders mark intense prolonged dry spells (ranging from 88 to over 112 consecutive dry days), highlighting their vulnerability to drought (
Figure 4l).
Figure 4. Spatial analysis of (g) Number of days per year with rainfall ≥ 10 mm (R10mm), (h) Number of days per year with rainfall ≥ 20 mm (R20mm), (i) Maximum 1-day rainfall (RX1day), (j) Maximum 5-day rainfall (RX5day), (k) Consecutive Wet Days (CWD) and (l) Consecutive Dry Days (CDD) during the period of 1981-2022.
3.3. Extreme Warm and Cold Temperature Indices
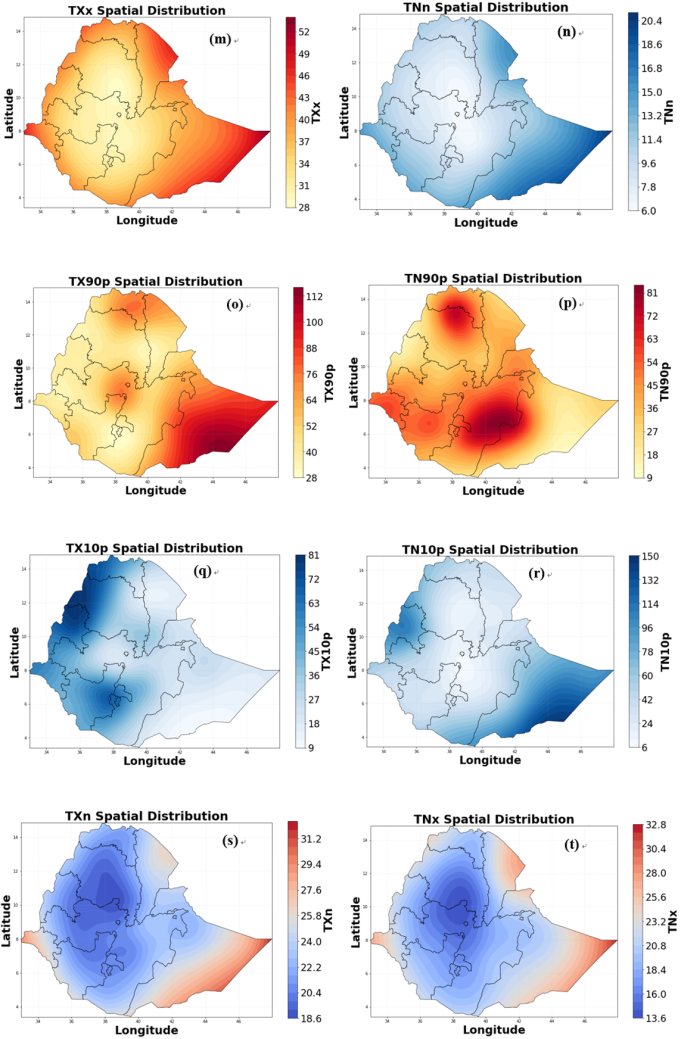
TXx Spatial Distribution (Warmest Day) shows the maximum daily maximum temperature recorded. The lowlands surrounding the country-particularly the northeastern Afar region and northwestern/southeastern borders - experience extreme heat peaking between 46°C and 52°C. Central highland areas remain much cooler due to elevation across 28°C–31°C (
Figure 4m). TNn Spatial Distribution (Coldest Night): Records the minimum daily minimum temperature. The central highlands experience the coldest nights (dropping down to 6°C), while the peripheral lowlands remain warm even during their coolest periods (staying above 18°C to 20°C) (
Figure 5n).
TX90p Spatial Distribution (Warm Days %): Maps the percentage of days when daily maximum temperature exceeded the 90th percentile. The eastern and southeastern lowlands show a high percentage (exceeding 100 days/extent in some index boundaries), indicating an increasing frequency of unusually hot daytime temperatures (
Figure 4o). TN90p Spatial Distribution (Warm Nights %): Maps the percentage of nights where the minimum temperature stayed above the 90th percentile. High values are heavily concentrated in the north-central regions and south-central zones, showing that nights are warming up significantly in these specific areas (
Figure 5p).
TX10p Spatial Distribution (Cold Days %) maps the percentage of days that were unusually cold (below the 10th percentile). The highest concentration is visible in the northwestern highlands and parts of the south, signifying regions that have preserved a higher relative frequency of cooler daytime windows over the decades compared to the rapidly warming lowlands (
Figure 5q).
Cold Nights (%) -TN10p the highest percentage of cold nights (reaching up to 114% to 150%) is concentrated in the southeastern lowlands (Somali region) as well as localized pockets in the northwestern highlands. The central highlands, Rift Valley, and south-central regions exhibit significantly lower values (dropping down to 6% to 24%). The elevated occurrence of cold nights in the southeastern lowlands highlights strong regional radiative cooling during nocturnal hours, typical of arid/semi-arid environments with lower cloud cover and atmospheric moisture. Conversely, the central highland region experiences fewer extremes below its historical baseline percentile, reflecting localized thermal buffering or microclimatic variations (
Figure 5r).
Minimum Daily Maximum Temperature (°C) - TXn the central and northern Ethiopian highlands feature the lowest minimum daily maximum temperatures, ranging between 18.6°C and 21.0°C (deep blue colors). Values increase steadily moving away from the central plateau toward the peripheral lowlands, peaking at 29.4°C to >31.2°C in the eastern, southeastern, and far western lowland borders (red hues). TXn heavily reflects the underlying topographic lapse rate of Ethiopia. High-altitude regions maintain cooler daytime peak temperatures even on their coldest days. The expansive low-altitude regions in the east and southeast record consistently high daytime maximum temperatures throughout the year due to lower elevations and intense daytime solar radiation (
Figure 5s).
Maximum Daily Minimum Temperature (°C) - TNx high-elevation areas of the central and north-central highlands display the lowest values, dropping to 13.6°C – 16.0°C (deep blue zone). The highest maximum night-time temperatures are observed in the northeastern Afar depression and the eastern/southeastern lowland areas, reaching 28.0°C to >32.8°C (deep red hues). TNx measures the warmest night-time minimum temperatures recorded. Lowland areas (particularly Afar and Somali regions) trap heat effectively overnight, leading to elevated night-time minimums that exceed 30°C. In contrast, high-elevation zones retain cool nighttime temperatures even during warm seasonal spikes due to efficient terrestrial long wave radiation to space at higher altitudes (
Figure 5t).
Figure 5. Spatial analysis of (m) Maximum of daily maximum temperature (warmest day) - (TXx), (n) Minimum of daily minimum temperature (coldest night) - (TNn), (o) Warm days (%) - (TX90p), (p) Warm nights (%) - (TN90p, (q) Cold days (%) - (TX10p), (r) Cold nights (%) - (TN10p), (s) Minimum of daily maximum temperature (Coldest day) - (TXn) and (t) Maximum of daily minimum temperature (Warmest night) (TNx) during the period of 1981-2022.
3.4. Temporal Analysis of Rainfall and Temperatures Indices across Anomaly and Annual Trends
R10mm Anomaly
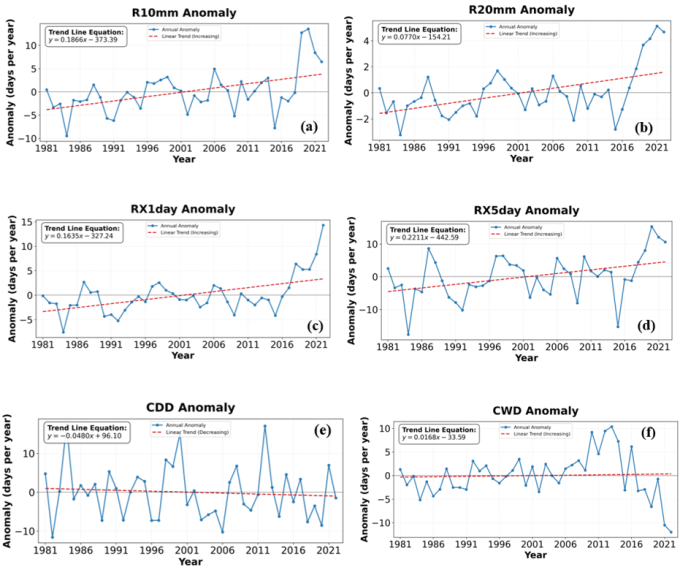
Figure 6a indicates the annual anomaly of days where daily rainfall was greater than or equal to 10 mm. Statistically increasing trend in the number of heavy rainfall days over the 40-year period. The upward trajectory accelerates dramatically after 2016 and large positive anomalies after 2018, with the highest positive anomalies recorded around 2019–2020, suggest that recent years experienced substantially more heavy rainfall events than the long-term average. This indicates that heavy rainfall events are becoming more frequent. Earlier years (1980s–1990s) mostly exhibited negative anomalies, indicating fewer heavy rainfall days. Heavy rainfall events have become more frequent, suggesting an intensification of moderate-to-heavy rainfall.
R20mm Anomaly shows the anomaly for days with daily rainfall greater than or equal to 20 mm. Similar to the R10mm index, there is an increasing trend in very heavy rainfall days, though the positive slope value. Most years before 2015 fluctuated around the mean, while a marked increase occurred after 2018 (
Figure 6b). The highest positive anomalies occurred during 2019–2022, indicating more frequent extreme rainfall events. Very heavy rainfall events have become increasingly common in recent years, although the increase is slower than for R10mm.
RX1day Anomaly indicates the annual anomaly of the maximum amount of rainfall received in a single day. The trend line shows a stable increase over time. This means that the single wettest day of the year is getting progressively wetter, indicating that intense, short-duration storm events are intensifying. Most years before 2015 fluctuated near or below average. Strong positive anomalies after 2018 indicate exceptionally intense one-day rainfall events (
Figure 6c). The intensity of the single wettest day each year has increased, raising the likelihood of flash floods.
RX5day Anomaly measures the anomaly for the maximum consecutive 5-day rainfall total, which is a strong indicator of prolonged rainfall that can trigger heavy flooding. This index shows the steepest upward positive slope value among the rainfall amount. Although variability is high, the recent years show sustained positive anomalies. Peaks around 2020–2022 reflect exceptionally wet multi-day rainfall periods (
Figure 6d). The increasing trend signifies that prolonged, multi-day severe rainfall events are growing more severe, posing a higher risk for major regional flooding persistent heavy rainfall episodes have intensified, landslides, and soil saturation.
CDD Anomaly (Consecutive Dry Days) monitors the maximum number of consecutive days with less than 1 mm of rainfall (a metric for meteorological drought duration). This index shows a decreasing trend, indicated by the negative slope value. While the data exhibits massive year-to-year volatility (such as severe dry spells around 1984, 1999, and 2012), the overall trend suggests that the longest continuous stretches of completely dry weather are slightly shortening over time (
Figure 6e). Dry spells have become marginally shorter, possibly reflecting more frequent rainfall interruptions.
CWD Anomaly (Consecutive Wet Days) shows the maximum number of consecutive days with rainfall greater than or equal to 1 mm. The trend line is nearly flat but shows a very slight increase with positive value. Interestingly, while consecutive wet days peaked around 2010–2014, there is a sharp drop-off to negative anomalies after 2016 (
Figure 6f). This suggests that while overall heavy rainfall amounts are up, they are happening in shorter, more intense bursts rather than extended, multi-week rainy spells. Rainfall is becoming more concentrated into fewer consecutive days, meaning rainfall events are more intense but not necessarily longer-lasting.
Collectively, the six indices (
Figure 6) indicate a shift toward more intense rainfall extremes over the 1981–2022 period: R10mm, R20mm, RX1day, and RX5day all exhibit positive trends, demonstrating increases in the frequency and intensity of heavy rainfall events. RX5day shows the strongest upward trend, highlighting an increasing risk of prolonged heavy rainfall and flooding. CDD exhibits a slight declining trend, suggesting marginally shorter dry spells. CWD shows only a weak positive long-term trend, but recent negative anomalies imply that rainfall is occurring in shorter, more intense episodes rather than as prolonged wet periods.
The overall pattern suggests that the climate in the study area is becoming wetter in terms of rainfall intensity rather than rainfall duration. The increasing occurrence of heavy and extreme rainfall events (R10mm, R20mm, RX1day, and RX5day), coupled with only minor changes in wet- and dry-spell duration (CWD and CDD), is consistent with a climate experiencing more concentrated rainfall. This has important implications for flood risk, water-resource management, agriculture, and infrastructure planning, as intense rainfall events are becoming more frequent even though the duration of wet periods has not increased substantially.
Figure 6. ETCCDI rainfall index trends (a) Number of days per year with rainfall ≥ 10 mm (R10mm), (b) Number of days per year with rainfall ≥ 20 mm (R20mm), (c) Maximum 1-day rainfall (RX1day), (d) Maximum 5-day rainfall (RX5day), (e) Consecutive Dry Days (CDD), and (f) Consecutive Wet Days (CWD) during the period of 1981-2022.
This
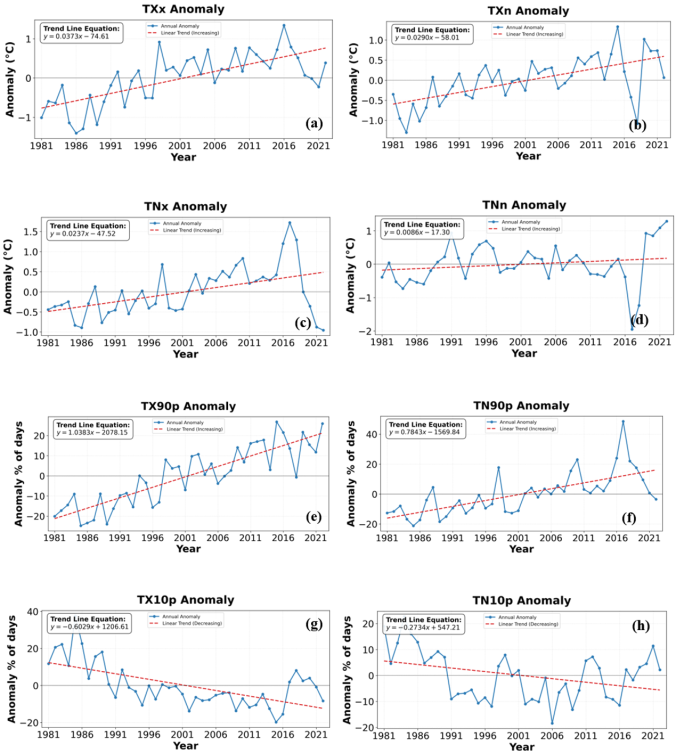
Figure 7 presents annual anomalies of eight temperature extreme indices from 1981–2022. The blue line represents annual anomalies relative to the long-term average, while the red dashed line shows the linear trend. Positive anomalies indicate values above the climatological mean, whereas negative anomalies represent below-average conditions.
TXx Anomaly (Annual maximum value of daily maximum temperature) the positive slope (+0.0373°C/year) indicates that the warmest daytime temperature recorded each year has gradually increased. The early years (1980s) were generally characterized by negative anomalies, while positive anomalies became more frequent after the late 1990s. The highest positive anomaly occurred around 2017, indicating an exceptionally hot year (
Figure 7a). The intensity of annual daytime heat extremes has increased, suggesting more severe heat wave conditions.
TXn Anomaly (Annual minimum value of daily maximum temperature) the positive trend indicates that the coolest daytime maximum temperatures are becoming warmer. Despite considerable year-to-year variability, positive anomalies became more common after 2000. A pronounced negative anomaly around 2019 reflects an unusually cool daytime maximum during that year (
Figure 7b). Even the coolest daytime temperatures are warming, indicating a reduction in cool daytime extremes.
TNx Anomaly (Annual maximum value of daily minimum temperature) the positive slope indicates increasing warm-night extremes over the study period. Most years after 2005 show positive anomalies, with exceptionally high values around 2018–2019 (
Figure 7c). A sharp decline in the final years reflects temporary interannual variability rather than a reversal of the long-term warming trend. The warmest nights are becoming hotter, increasing the occurrence of oppressive nighttime heat.
TNn Anomaly (Annual minimum value of daily minimum temperature) the trend is weakly positive, suggesting a modest increase in the coldest nighttime temperatures. Large fluctuations occur throughout the record, including an exceptionally cold year around 2019 (
Figure 7d). Strong positive anomalies during 2020–2022 indicate much warmer minimum nighttime temperatures in recent years. Cold-night extremes are becoming less severe, although interannual variability remains substantial.
TX90p Anomaly (Warm days - percentage of days when maximum temperature exceeds the 90th percentile) this index exhibits a pronounced upward trend, indicating a substantial increase in the frequency of unusually warm days. Negative anomalies dominated the 1980s and early 1990s, whereas positive anomalies became increasingly frequent after 2000. The highest anomalies occurred during the late 2010s, reflecting exceptionally frequent warm days (
Figure 7e). Warm daytime extremes have become much more common, consistent with ongoing climate warming.
TN90p Anomaly (Warm nights - percentage of days when minimum temperature exceeds the 90th percentile) the positive trend indicates a steady increase in the occurrence of unusually warm nights. The most pronounced positive anomaly occurred around 2018, followed by continued above-average conditions (
Figure 7f). Earlier decades were dominated by negative anomalies, indicating fewer warm nights. Warm nights are becoming increasingly frequent, reducing nighttime cooling and increasing heat stress.
TX10p Anomaly (Cool days - percentage of days when maximum temperature falls below the 10th percentile) the negative slope indicates a decline in the frequency of unusually cool daytime temperatures. Positive anomalies were common during the early 1980s but gradually shifted toward negative anomalies after the late 1990s (
Figure 7g). Although occasional positive anomalies appear in recent years, the long-term tendency remains downward. Cool daytime extremes are becoming less frequent, consistent with a warming climate.
TN10p Anomaly (Cool nights - percentage of days when minimum temperature falls below the 10th percentile) the negative trend indicates that unusually cool nights have become less frequent over time. The largest positive anomalies occurred during the early 1980s, whereas most years after 1990 show values below the long-term average. Some recovery in recent years is evident, but the overall trend remains negative (
Figure 7h). Cold nighttime extremes are declining, reflecting warmer night-time conditions over the study period.
The temperature extreme indices consistently indicate a warming climate during 1981–2022. Indices representing warm extremes (TXx, TXn, TNx, TNn, TX90p, and TN90p) all exhibit positive trends, indicating increases in both the intensity and frequency of hot days and warm nights. In contrast, indices representing cold extremes (TX10p and TN10p) show negative trends, demonstrating a decline in the occurrence of unusually cool days and nights. Among all indices, TX90p and TN90p display the strongest increases, highlighting a marked rise in the frequency of warm temperature extremes. Meanwhile, TX10p and TN10p show persistent decreases, indicating that cold extremes have become increasingly rare.
Overall, the
Figure 7 demonstrates a clear shift toward warmer temperature extremes over the study period. The increasing intensity of annual maximum temperatures (TXx and TNx), together with the growing frequency of warm days and warm nights (TX90p and TN90p), and the simultaneous decline in cool days and cool nights (TX10p and TN10p), provides strong evidence of ongoing regional warming. These changes have important implications for heat wave occurrence, human health, agriculture, ecosystem functioning, and energy demand, as higher temperatures and more frequent warm extremes increase thermal stress while reducing the occurrence of cold events.
Figure 7. ETCCDI temperature index trends (g) Maximum of daily maximum temperature (warmest day) - (TXx), (h) Minimum of daily maximum temperature (TXn), (i) Maximum of daily maximum temperature (TNx), (j) Minimum of daily minimum temperature (coldest night) - (TNn), (k) Warm days (%) - (TX90p), (l) Warm nights (%) - (TN90p), (m) Cold days (%) - (TX10p), and (n) Cold nights (%) - (TN10p) during the period of 1981-2022.
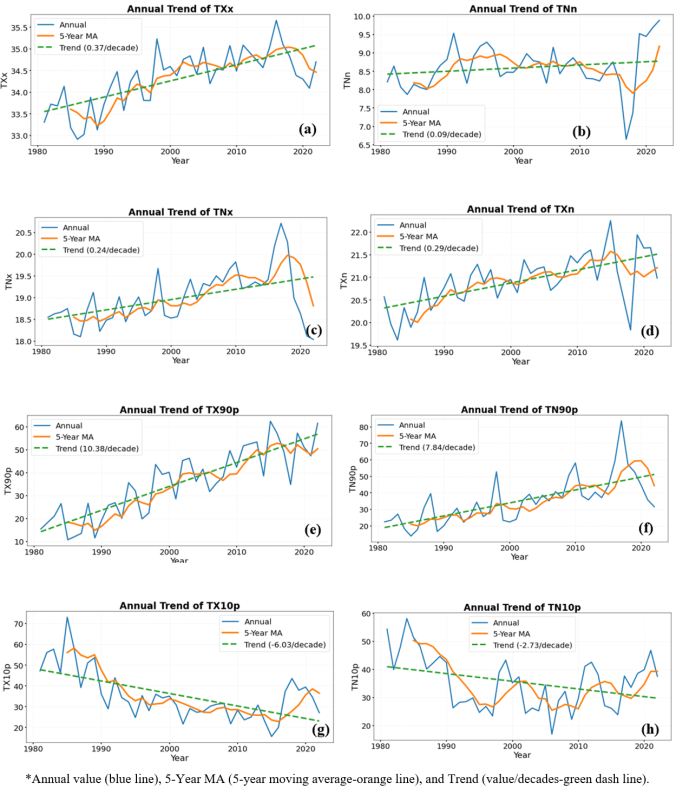
Based on the provided
Figure 8, here is the explanation and interpretation of each climate index trend recorded between 1981 and 2022. Each figure features three data points: the yearly value (blue line), a 5-year moving average (orange line), and the long-term trend line (green dashed line).
TXx: Maximum of Daily Maximum Temperature (Warmest Day) the warmest single day of the year has experienced a clear upward trajectory over the 40-year period, indicating that extreme daytime heat events are becoming progressively hotter (
Figure 8a). TNn: Minimum of Daily Minimum Temperature (Coldest Night) the coldest night of the year is warming up, though at a much slower rate compared to daytime extremes. A significant drop occurred around 2017, followed by a sharp rise toward 2022 (
Figure 8b).
TNx: Maximum of Daily Minimum Temperature the highest nighttime temperature recorded annually shows a steady increase. This indicates that the warmest nights of the year are growing significantly hotter over time, despite a sharp downturn after 2018 (
Figure 8c). TXn: Minimum of Daily Maximum Temperature even on the coolest days of the year, the maximum daytime temperature is steadily climbing. This point toward a generalized reduction in cooler day options year-round (
Figure 8d).
TX90p: Warm Days (%) the percentage of days exceeding the 90th percentile for temperature has grown aggressively. This shows a substantial and rapid increase in the overall frequency of unusually hot days (
Figure 8e). TN90p: Warm Nights (%) similar to warm days, the frequency of unusually warm nights has risen drastically over the decades, meaning nights are failing to cool down as often as they used to (
Figure 8f).
TX10p: Cold Days (%) the percentage of unusually cool days has seen a steady, steep decline. Extreme cold daytime weather is becoming a much rarer occurrence (
Figure 8g). TN10p: Cold Nights (%) the frequency of unusually cold nights is dropping over time, corroborating the general warming trend across all temperature vectors (
Figure 8h).
Figure 8. Temperature indices of (a) Maximum of daily maximum temperature (warmest day) - (TXx), (b) Minimum of daily minimum temperature (coldest night) - (TNn), (c) Maximum of daily minimum temperature (TNx), (d) Minimum of daily maximum temperature (TXn), (e) Warm days (%) - (TX90p), (f) Warm nights (%) - (TN90p), (g) Cold days (%) - (TX10p), and (h) Cold nights (%) - (TN10p) during the period of 1981-2022.
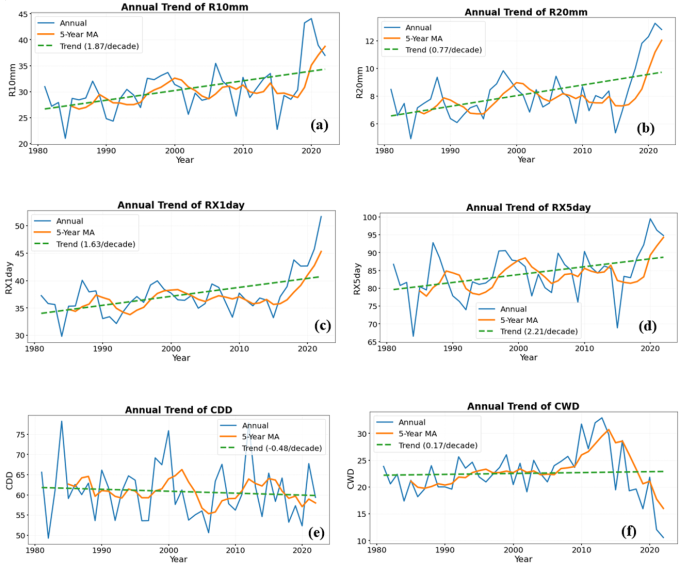
R10mm: Number of Days with Rainfall
the frequency of moderate-to-heavy rainfall days is climbing. The region experienced a sharp increase in these rainy days around 2019–2020 (
Figure 9a). R20mm: Number of Days with Rainfall
days with very heavy rainfall is increasing slightly. A prominent spike in frequency is visible in the final years leading up to 2022 (
Figure 9b).
RX1day: Maximum 1-Day Rainfall the maximum amount of rainfall dropped in a single 24-hour period is rising. This point toward an increase in the intensity of sudden, heavy rainfall events, peaking sharply at the end of the timeline (
Figure 9c). RX5day: Maximum Consecutive 5-Day Rainfall the total volume of rain falling during the wettest 5-day streak of the year is increasing. This indicates that sustained, heavy rainfall systems are intensifying (
Figure 9d).
CDD: Consecutive Dry Days the maximum length of dry spells has decreased very slightly over time, though it remains highly variable year-to-year (
Figure 9e). CWD: Consecutive Wet Days the longest consecutive streak of rainy days shows a flat-to-slight long-term increase, though a major multi-year dip occurred right at the end of the recording period (2020–2022) (
Figure 9f).
Figure 9. Rainfall indices of (a) Number of days with rainfall ≥ 10 mm (R10mm), (b) Number of days with rainfall ≥ 20 mm (R20mm), (c) Maximum 1-day rainfall (RX1day), (d) Maximum consecutive 5-day rainfall (RX5day), (e) Consecutive Dry Days (CDD), and (f) Consecutive Wet Days (CWD) during the period of 1981-2022.
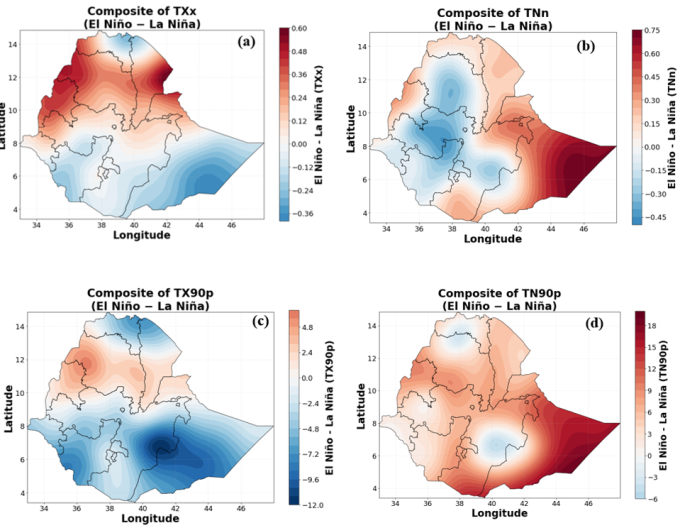
These Figures below depict how temperature anomalies behave during El Niño compared to La Niña. Positive values (red/orange) mean El Niño is warmer than La Niña, while negative values (blue) mean El Niño is cooler.
Composite of TXx (Maximum of Daily Maximum Temperature / Warmest Day): During El Niño years, the warmest day of the year becomes significantly hotter across northern, northwestern, and northeastern Ethiopia (reaching up to
warmer than La Niña). Conversely, the southern and southeastern regions experience slightly cooler peak temperatures (down to
) during El Niño compared to La Niña (
Figure 10a).
Composite of TNn (Minimum of Daily Minimum Temperature / Coldest Night): This map indicates that the coldest night of the year is substantially warmer during El Niño in the easternmost "horn" of Ethiopia (the Somali region), with values up to
higher than in La Niña years. In contrast, central and north-central Ethiopia experience colder minimum temperatures during El Niño (dropping to
lower than La Niña) (
Figure 10b).
Composite of TX90p (Warm Days% / Percentage of Days when TX > 90th Percentile): El Niño reduces the frequency of extremely warm days substantially in the southern and southeastern parts of the country (by up to
fewer warm days). A small pocket in the northwest experiences a slight increase (
to
) in the frequency of warm days during El Niño compared to La Niña (
Figure 10c).
Composite of TN90p (Warm Nights% / Percentage of Nights when TN > 90th Percentile): During El Niño, the percentage of unusually warm nights spikes drastically in the far east and south of the country, showing an increase of up to
more warm nights compared to La Niña. Most of the country experiences an increase in warm nights, except for small isolated pockets in the north and south-central areas (
Figure 10d).
Figure 10. Temperature indices across El Nino and La Nina events on the (a) Composite of TXx (Maximum of Daily Maximum Temperature / Warmest Day), (b) Composite of TNn (Minimum of Daily Minimum Temperature / Coldest Night), (c) Composite of TX90p (Warm Days% / Percentage of Days when TX > 90th Percentile), and (d) Composite of TN90p (Warm Nights% / Percentage of Nights when TN > 90th Percentile).
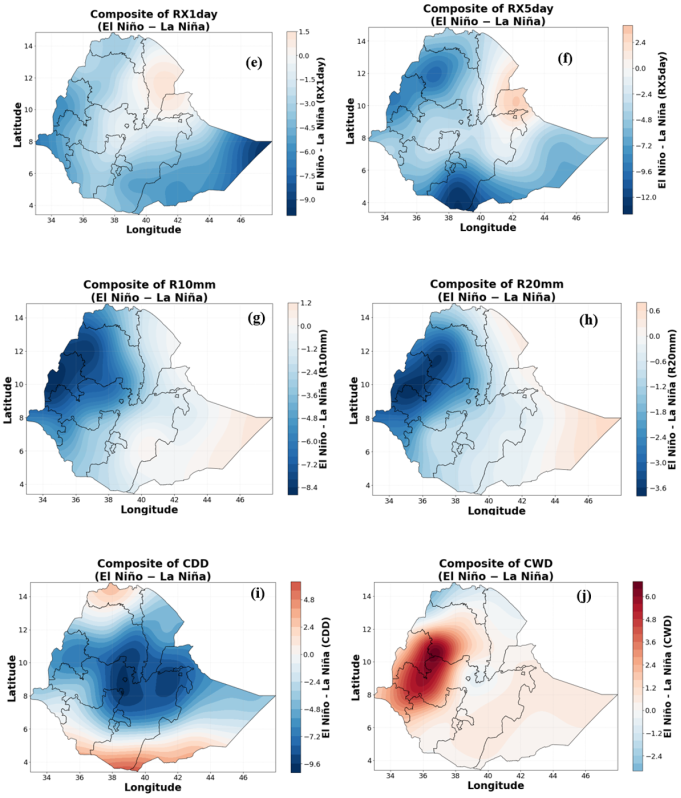
These maps depict the differences in rainfall characteristics. Negative values (blue) mean El Niño years receive less rainfall or fewer rainy days than La Niña years (i.e., El Niño is drier). Positive values (red/orange) mean El Niño is wetter.
Composite of RX1day (Maximum 1-Day Rainfall): El Niño suppresses heavy, single-day rainfall events across almost the entire country, particularly in the south and southeast (reaching down to
less than La Niña). A small region in northeastern Ethiopia shows a minor positive anomaly, meaning its heaviest single-day rainfall increases slightly during El Niño (
Figure 11e).
Composite of RX5day (Maximum Consecutive 5-Day Rainfall): Similar to the 1-day maximum, the maximum amount of rainfall falling over a consecutive 5-day period is deeply suppressed during El Niño across the northern highlands and the southern region (with reductions exceeding
). Only a small pocket in north-central/northeastern Ethiopia sees a minor increase in 5-day rainfall totals (
Figure 11f).
Composite of R10mm (Number of Days with Rainfall
): The number of days with significant rainfall (
) drops sharply across the western and northwestern highlands during El Niño (experiencing up to
fewer heavy rainy days compared to La Niña). The southeastern region shows near-neutral or slightly higher frequencies (
days) (
Figure 11g).
Composite of R20mm (Number of Days with Rainfall
): Very heavy rainfall days (
) are heavily reduced during El Niño in northwestern Ethiopia (up to
fewer days). The rest of the country generally experiences a deficit in these heavy rainfall days as well, confirming that El Niño curbs intense rainfall events across the Ethiopian highlands (
Figure 11h).
Composite of CDD (Consecutive Dry Days): Counter intuitively, the center of the country shows a large negative anomaly (up to
days), indicating that the longest stretch of consecutive dry days is actually
shorter during El Niño compared to La Niña in central Ethiopia. However, the far north and far south show positive anomalies, meaning consecutive dry periods lengthen in those border regions during El Niño (
Figure 11i).
Composite of CWD (Consecutive Wet Days): During El Niño, a prominent region in west-central Ethiopia experiences a strong increase in consecutive wet days (up to
days longer wet spells compared to La Niña). Conversely, the northern tip of the country sees a reduction in consecutive wet days, meaning prolonged rainy streaks are truncated there during El Niño (
Figure 11j).
Figure 11. Rainfall indices across El Nino and La Nina events on the (e) Composite of RX1day (Maximum 1-Day Rainfall), (f) Composite of RX5day (Maximum Consecutive 5-Day Rainfall), (g) Composite of R10mm (Number of Days with Rainfall ≥10 mm), (h) Composite of R20mm (Number of Days with Rainfall ), (i) Composite of CDD (Consecutive Dry Days), and (j) Composite of CWD (Consecutive Wet Days).
Several studies have examined climate extremes in Ethiopia using the Expert Team on Climate Change Detection and Indices (ETCCDI) framework, consistently reporting increasing trends in temperature-related extreme indices alongside pronounced spatial variability in precipitation extremes. For instance,
| [15] | Gebrechorkos, S. H., Hülsmann, S., & Bernhofer, C. (2019). Changes in temperature and precipitation extremes in Ethiopia, Kenya, and Tanzania. International Journal of Climatology, 39, 18–30. https://doi.org/10.1002/joc.5777 |
[15]
documented significant increases in warm temperature extremes and shifts in precipitation extremes across Ethiopia, Kenya, and Tanzania. Likewise, subsequent studies conducted in Ethiopia have reported increasing frequencies of heavy precipitation events (R10mm and R20mm), changes in the duration of consecutive dry and wet spells (CDD and CWD), and increases in warm daytime temperature extremes (TX90p). However, the magnitude, significance, and spatial patterns of these trends differ across climatic regions, reflecting the influence of Ethiopia's complex topography and diverse climatic regimes.
Within Ethiopia, the spatiotemporal expression of climate change exhibits pronounced geographical heterogeneity. The relatively humid and high-yielding western regions have retained greater hydrological resilience, whereas the arid and semi-arid eastern lowlands continue to experience persistent moisture deficits and increasing environmental degradation
| [7] | Seleshi, Y., & Zanke, U. (2004). Recent changes in rainfall and rainy days in Ethiopia. International Journal of Climatology: A Journal of the Royal Meteorological Society, 24(8), 973–983. https://doi.org/10.1002/joc.1052 |
[7]
. Concurrently, Ethiopia has undergone significant warming, as evidenced by long-term increases in temperature extremes.
| [6] | Mekasha, A., Tesfaye, K., & Duncan, A. J. (2014). Trends in daily observed temperature and precipitation extremes over three Ethiopian eco-environments. International Journal of Climatology, 34(6). https://doi.org/10.1002/joc.3816 |
[6]
reported a significant rise in the annual maximum daily maximum temperature (TXx) at a rate of 0.37°C decade
-1 and an increase in the frequency of warm days (TX90p) of 10.38% decade
-1. These changes have shifted thermal baselines, altered frost occurrence in high-elevation areas, and intensified environmental stress across vulnerable agroecological zones.
Concurrently, the thermal regime across the region has undergone significant changes. Long-term analyses indicate a persistent warming trend, characterized by increases in extreme temperature indices, including the annual maximum daily maximum temperature (TXx), which increased at a rate of 0.37°C decade
-1, and the percentage of warm days (TX90p), which increased by 10.38% decade
-1 | [6] | Mekasha, A., Tesfaye, K., & Duncan, A. J. (2014). Trends in daily observed temperature and precipitation extremes over three Ethiopian eco-environments. International Journal of Climatology, 34(6). https://doi.org/10.1002/joc.3816 |
[6]
. These changes have shifted thermal baselines, altered frost occurrence in high-elevation areas, and intensified environmental stress across vulnerable agroecological zones. Understanding the spatiotemporal variability and long-term trends in climate extremes during the 1981–2022 period is essential for developing evidence-based adaptation strategies, improving agricultural risk management, and enhancing hydrometeorological resilience.
4. Conclusion and Recommendations
This study investigated the spatiotemporal dynamics of ETCCDI-based daily rainfall and temperature extreme indices across Ethiopia during the period 1981–2022. The analysis demonstrated that climate extremes have undergone substantial changes, although the magnitude and direction of these changes vary across climatic and topographic regions.
Temperature extremes exhibited a more coherent pattern than precipitation extremes. The increasing frequency of warm days and warm nights, together with declining occurrences of cool days and cold nights, indicates persistent warming across much of Ethiopia. In addition, increases in annual maximum and minimum temperatures suggest that both daytime and nighttime heat extremes have intensified over the past four decades. These findings are consistent with broader regional and global warming trends.
Rainfall extremes displayed marked spatial variability. While several regions experienced increases in heavy precipitation events and rainfall intensity, others showed prolonged dry spells and declining precipitation, highlighting the coexistence of heightened flood and drought risks. This spatial heterogeneity reflects the complex interactions among atmospheric circulation, topography, and regional climate variability that characterize Ethiopia's climate.
The observed changes have important implications for agriculture, water resources, food security, public health, and ecosystem resilience. Increasing temperatures may accelerate evapotranspiration and exacerbate drought conditions, while more intense rainfall events can increase the likelihood of flooding, soil erosion, and infrastructure damage. Consequently, adaptation and mitigation strategies should consider the distinct climatic characteristics and vulnerabilities of different regions.
Overall, the study demonstrates the value of ETCCDI indices for monitoring long-term climate extremes and provides a scientific basis for developing evidence-based climate adaptation policies and sector-specific planning in Ethiopia.
Based on the findings of this study, the following recommendations are proposed:
National and regional climate monitoring systems should strengthen the continuous observation and analysis of climate extreme indices to support timely detection of emerging climatic changes.
Sectors and researchers should integrate information on climate extremes into national and regional adaptation strategies, disaster risk reduction programs, and development planning to improve resilience against droughts, floods, and heat extremes.
The national meteorological and disaster management agencies should strengthen early warning systems for extreme rainfall, heat waves, droughts, and floods by improving forecasting capacity and dissemination of climate information to local communities.
Future studies should incorporate high-resolution climate datasets, satellite observations, and climate model projections to evaluate future changes in extreme climate indices under different greenhouse gas emission scenarios.
Further research should investigate the relationships between climate extremes and large-scale climate drivers such as the El Niño–Southern Oscillation (ENSO), the Indian Ocean Dipole (IOD), and other regional circulation systems that influence Ethiopia's climate variability.
Additional interdisciplinary studies are recommended to assess the socioeconomic, agricultural, hydrological, ecological, and public health impacts of climate extremes to support comprehensive climate adaptation planning.





 Share This Article
 Twitter
 Linked In
 Facebook
 Copy
Copy Download