The study aimed to establish climate change on temperature trends, variation and change point patterns in Warri, Nigeria, using 31-year daily temperature data (1992-2022). The primary data were obtained from the Nigerian Meteorological Agency (NIMET) for Warri to understand the temperature dynamic in the city. Both the annual maximum and minimum temperatures were extracted from the dataset and also the mean temperature was obtained by getting the mean temperature of the maximum temperature values. Mann-Kendall trend tests, linear regression, change point detection through CUSUM analysis, and Sequential Mann-Kendall tests were used for the trend and change point analyses. Results revealed statistically significant increasing trends in annual maximum temperature (0.02°C/year) and mean temperature (0.025°C/year), while minimum temperature showed a non-significant positive trend. Change point analysis identified significant shifts in maximum and mean temperatures around 2005-2006. The average annual maximum temperature was 36.35°C, with temperature yearly projections suggesting potential increases to nearly 40°C over the next century if current trends continue. These findings have important implications for urban infrastructure and industrial operations in Warri, particularly given its significance as a major oil and gas hub. The study provides crucial insights for climate adaptation planning in coastal industrial cities experiencing warming trends.
| Published in | Hydrology (Volume 13, Issue 2) |
| DOI | 10.11648/j.hyd.20251302.11 |
| Page(s) | 90-101 |
| Creative Commons |
This is an Open Access article, distributed under the terms of the Creative Commons Attribution 4.0 International License (http://creativecommons.org/licenses/by/4.0/), which permits unrestricted use, distribution and reproduction in any medium or format, provided the original work is properly cited. |
| Copyright |
Copyright © The Author(s), 2025. Published by Science Publishing Group |
Temperature Trends, Change Point Detection, Mann-Kendall Test, CUSUM Analysis, Climate Change, Urban Heat Island, Warri
Annual Temperature Series | Shapiro-Wilk | Anderson-Darling | Skewness | Standard Error of Skewness | Z-skewness |
|---|---|---|---|---|---|
Maximum Temperature | 0.011 | 0.006 | 0.818 | 0.421 | 1.944089 |
Minimum Temperature | 0.005 | 0.027 | -1.295 | 0.421 | -3.07957 |
Mean Temperature | 0.431 | 0.222 | -0.230 | 0.421 | -0.54589 |
Statistic | Annual Maximum Temperature | Annual Minimum Temperature | Annual Mean Temperature | |||
|---|---|---|---|---|---|---|
Intercept | Year | Intercept | Year | Intercept | Year | |
Value | -32.039 | 0.034 | -44.492 | 0.031 | -14.938 | 0.023 |
Standard error | 24.998 | 0.012 | 84.471 | 0.042 | 13.653 | 0.007 |
t | -1.282 | 2.736 | -0.527 | 0.740 | -1.094 | 3.440 |
Pr > |t| | 0.210 | 0.011 | 0.602 | 0.465 | 0.283 | 0.002 |
Lower bound (95%) | -83.166 | 0.009 | -217.255 | -0.055 | -42.863 | 0.009 |
Upper bound (95%) | 19.089 | 0.060 | 128.271 | 0.117 | 12.986 | 0.037 |
Statistic | Annual Maximum Temperature | Annual Minimum Temperature | Annual Mean Temperature |
|---|---|---|---|
Kendall's tau | 0.356 | 0.184 | 0.363 |
S | 153.000 | 83 | 169 |
Var(S) | 3280.333 | 3419 | 3461.667 |
p-value (Two-tailed) | 0.008 | 0.161 | 0.004 |
Sen Slope | 0.020 | 0.045 | 0.025 |
alpha | 0.05 | 0.05 | 0.05 |
Temperature Series | Maximum CUSUM Value | Critical Values | Change Point Year | Remark |
|---|---|---|---|---|
Annual Maximum Temperature | 11 | CI @ 90%: 6.7927 CI @ 95%: 7.5722 CI @ 99%: 9.0755 | 2006 | Significant change point |
Annual Minimum Temperature | 6 | CI @ 90%: 6.7927 CI @ 95%: 7.5722 CI @ 99%: 9.0755 | 2003 | No significant change point |
Annual Mean Temperature | 10 | CI @ 90%: 6.7927 CI @ 95%: 7.5722 CI @ 99%: 9.0755 | 2005 | Significant change point |
Temperature Series | Change Point Year | Crossing Pattern | Remark |
|---|---|---|---|
Annual Maximum Temperature | 2016 | Single crossing | Probable change point |
Annual Minimum Temperature | 2012 | Multiple crossings | No change point |
Annual Mean Temperature | 2006 | Single crossing | Probable change point |
U | 43.000 |
Expected value | 119.000 |
Variance (U) | 604.213 |
p-value (Two-tailed) | 0.002 |
alpha | 0.05 |
U | 80.000 |
Expected value | 110.000 |
Variance (U) | 580.753 |
p-value (Two-tailed) | 0.221 |
alpha | 0.05 |
U | 38.000 |
Expected value | 117.000 |
Variance (U) | 624.000 |
p-value (Two-tailed) | 0.002 |
alpha | 0.05 |
ACF | Autocorrelation Function |
CUSUM | Cumulative Sum |
IEA | International Energy Agency |
IPCC | International Panel on Climate Change |
MK | Mann-Kendall |
NIMET | Nigerian Meteorological Agency |
SQMK | Sequential Mann-Kendall |
SSE | Sen’s Slope Estimator |
TFPW | Trend Free Pre-whitening |
| [1] | AghaKouchak, A., Cheng, L., Mazdiyasni, O., & Farahmand, A. (2014). Global warming and changes in risk of concurrent climate extremes: Insights from the 2014 California drought. Geophysical Research Letters, 41(24), 8847-8852. |
| [2] | Akinsanola, A. A., & Zhou, W. (2019). Projections of West African summer monsoon rainfall extremes from two CORDEX models. Climate Dynamics, 52(3). Available at |
| [3] | Akpodiogaga-a, P., & Odjugo, O. (2010). General overview of climate change impacts in Nigeria. Journal of Human Ecology, 29(1), 47-55. |
| [4] | Amirabadizadeh, M., Huang, Y. F., & Lee, T. S. (2015). Recent trends in temperature and precipitation in the Langat River Basin, Malaysia. Advances in Meteorology, 2015, 1-12. |
| [5] | Bisai, D., Chatterjee, S., Khan, A., & Barman, N. K. (2014). Long term temperature trend and change point: A statistical approach. Open Journal of Atmospheric and Climate Change, 1(1), 32-42. |
| [6] |
Collins, M., Knutti, R., Arblaster, J., Dufresne, J. L., Fichefet, T., Friedlingstein, P.,... & Wehner, M. (2013). Long-term Climate Change: Projections, Commitments and Irreversibility. In: Climate Change 2013: The Physical Science Basis. Contribution of Working Group I to the Fifth Assessment Report of the Intergovernmental Panel on Climate Change. Cambridge University Press. Available at:
https://www.ipcc.ch/site/assets/uploads/2018/02/WG1AR5_Chapter12_FINAL.pdf |
| [7] | Douglas, E. M., Vogel, R. M., & Kroll, C. N. (2000). Trends in floods and low flows in the United States: impact of spatial correlation. Journal of hydrology, 240(1-2), 90-105. |
| [8] | Efe, S. I., & Ojoh, C. O. (2013). Climate variation and malaria prevalence in Warri metropolis. Atmospheric and Climate Sciences, 3, 132-140. |
| [9] | Ghasemi, A., & Zahediasl, S. (2012). Normality tests for statistical analysis: a guide for non-statisticians. International journal of endocrinology and metabolism, 10(2), 486. |
| [10] |
International Energy Agency, IEA (2023). Emissions from oil and gas operations in net zero transitions. IEA.
https://www.iea.org/reports/emissions-from-oil-and-gas-operations-in-net-zero-transitions |
| [11] |
IPCC (2013). Climate Change 2013: The Physical Science Basis. Contribution of Working Group I to the Fifth Assessment Report of the Intergovernmental Panel on Climate Change. Cambridge University Press. Available at:
https://www.ipcc.ch/site/assets/uploads/2017/09/WG1AR5_Frontmatter_FINAL.pdf |
| [12] |
IPCC (2014). Climate Change 2014: Impacts, Adaptation, and Vulnerability. Cambridge University Press. Available at:
https://www.ipcc.ch/site/assets/uploads/2018/02/WGIIAR5-FrontMatterA_FINAL.pdf |
| [13] |
IPCC. (2021). Climate Change 2021: The Physical Science Basis. Contribution of Working Group I to the Sixth Assessment Report of the Intergovernmental Panel on Climate Change [Masson-Delmotte, V., Zhai, P., Pirani, A., Connors, S. L., Péan, C., Berger, S., Caud, N., Zhou, Y., Mulder, L., Matthews, J.,... & Waterfield, T. (Eds.)]. Cambridge University Press. Available at
https://www.ipcc.ch/report/ar6/wg1/downloads/report/IPCC_AR6_WGI_SummaryVolume.pdf |
| [14] | Kendall, M. G. (1955). Rank correlation methods. Griffin. |
| [15] | Gallagher, Colin, Lund, Robert and Robbins, Michael W. (2013). Changepoint Detection in Climate Time Series with Long-Term Trends. Journal of Climate 26(14): 4994-5006. |
| [16] | Mann, H. B. (1945). Nonparametric tests against trend. Econometrica, 13(3), 245-259. |
| [17] | Sam, M. G., Nwaogazie, I. L., & Ikebude, C. (2023). Establishing Climatic Change on Rainfall Trend, Variation and Change Point Pattern in Benin City, Nigeria. International Journal of Environment and Climate Change, 13(5), 202-212. |
| [18] | Mmom, P. C., & Aifesehi, P. E. (2013). Impact of the 2012 flood on water quality and rural livelihood in the Orashi Province of the Niger Delta, Nigeria. Journal of Geography and Geology, 5(3), 216-225. |
| [19] | Nwaogazie, I. L. (2021). Probability and statistics for science and engineering (4th ed.). De-adorit Innovation. ISBN 978-8137-47-4, p. 373. Available at: |
| [20] |
Origho, T. (2016). Examination of the spatial characteristics of urban heat island in Warri metropolis, Delta State, Nigeria (Doctoral dissertation). Nnamdi Azikiwe University, Awka, Nigeria. Available at:
https://phd-dissertations.unizik.edu.ng/repos/81131849300_82754486286.pdf |
| [21] | Sam, M., Nwaogazie, I., Ikebude, C., Dimgba, C. and El-Hourani, D. (2023) Detecting Climate Change Trend, Size, and Change Point Date on Annual Maximum Time Series Rainfall Data for Warri, Nigeria. Open Journal of Modern Hydrology, 13, 165-179. |
| [22] |
Patakamuri, S. K. (2022) Trendchange: Innovative Trend Analysis and Time-Series Change Point Analysis. The R Project for Statistical Computing, Vienna.
https://cran.r-project.org/web/packages/trendchange/trendchange.pdf |
| [23] | Ragatoa, D. S., Ogunjobi, K. O., Okhimamhe, A. A., Francis, S. D., & Adet, L. (2018). A trend analysis of temperature in selected stations in Nigeria using three different approaches. Open Access Library Journal, 5(2), 1-17. |
| [24] | Ray, L. K., Goel, N. K., & Arora, M. (2019). Trend analysis and change point detection of temperature over parts of India. Theoretical and Applied Climatology, 137, 281-295. |
| [25] | Sen, P. K. (1968). Estimates of the regression coefficient based on Kendall's tau. Journal of the American Statistical Association, 63(324), 1379-1389. |
| [26] | Suhaila, J., Deni, S. M., Wan Zin, W. Z., & Jemain, A. A. (2010). Spatial patterns and trends of daily rainfall regime in Peninsular Malaysia during the southwest and northeast monsoons: 1975–2004. Meteorology and Atmospheric Physics, 110, 1-18. |
| [27] | Suhaila, J., & Yusop, Z. (2017). Trend analysis and change point detection of annual and seasonal temperature series in Peninsular Malaysia. Meteorology and Atmospheric Physics, 129(6), 681-693. |
| [28] | Sylla, M. B., Nikiema, P. M., Gibba, P., Kebe, I., & Klutse, N. A. B. (2016). Climate change over West Africa: Recent trends and future projections. In Adaptation to Climate Change and Variability in Rural West Africa (pp. 25-40). Springer, Cham. |
| [29] | Tan, M. L., Ibrahim, A. L., Yusop, Z., Duan, Z., & Ling, L. (2015). Impacts of land-use and climate variability on hydrological components in the Johor River Basin, Malaysia. Hydrological Sciences Journal, 60(5), 873-889. |
| [30] | Tabari, H., Somee, B. S., & Zadeh, M. R. (2011). Testing for long-term trends in climatic variables in Iran. Atmospheric research, 100(1), 132-140. |
| [31] | Team, R. C. (2020). RA language and environment for statistical computing, R Foundation for Statistical. Computing. Vienna, Austria. |
| [32] | Theil, H. (1950). A rank-invariant method of linear and polynomial regression analysis. Available at: |
| [33] | Von Storch, H. (1999). Misuses of statistical analysis in climate research. In Analysis of Climate Variability: Applications of Statistical Techniques Proceedings of an Autumn School Organized by the Commission of the European Community on Elba from October 30 to November 6, 1993 (pp. 11-26). Berlin, Heidelberg: Springer Berlin Heidelberg. |
| [34] |
Yue, S., Pilon, P., Phinney, B., & Cavadias, G. (2002). The influence of autocorrelation on the ability to detect trend in hydrological series. Hydrological Processes, 16(9), 1807-1829. Available at:
https://www.pacificclimate.org/~wernera/zyp/Yue%20Pilon%20Phinney%20Cavadias%202002%20HP.pdf |
| [35] |
Zarenistanak, M., Dhorde, A. G., & Kripalani, R. H. (2014). Trend analysis and change point detection of annual and seasonal precipitation and temperature series over southwest Iran. Journal of Earth System Science, 123(2), 281-295. Available at:
https://www.ias.ac.in/article/fulltext/jess/123/02/0281-0295 |
| [36] | Zhang, Q., Xu, C. Y., & Zhang, Z. (2009). Observed changes of drought/wetness episodes in the Pearl River basin, China, using the standardized precipitation index and aridity index. Theoretical and Applied Climatology, 98, 89-99. |
APA Style
Olali, K., Nwaogazie, I. L., Ikebude, C. F. (2025). Establishing Climate Change on Temperature Trend, Variation and Change Point Pattern in Warri, Nigeria. Hydrology, 13(2), 90-101. https://doi.org/10.11648/j.hyd.20251302.11
ACS Style
Olali, K.; Nwaogazie, I. L.; Ikebude, C. F. Establishing Climate Change on Temperature Trend, Variation and Change Point Pattern in Warri, Nigeria. Hydrology. 2025, 13(2), 90-101. doi: 10.11648/j.hyd.20251302.11
AMA Style
Olali K, Nwaogazie IL, Ikebude CF. Establishing Climate Change on Temperature Trend, Variation and Change Point Pattern in Warri, Nigeria. Hydrology. 2025;13(2):90-101. doi: 10.11648/j.hyd.20251302.11
@article{10.11648/j.hyd.20251302.11,
  author = {Kigigha Olali and Ify Lawrence Nwaogazie and Chiedozie Francis Ikebude},
  title = {Establishing Climate Change on Temperature Trend, Variation and Change Point Pattern in Warri, Nigeria},
  journal = {Hydrology},
  volume = {13},
  number = {2},
  pages = {90-101},
  doi = {10.11648/j.hyd.20251302.11},
  url = {https://doi.org/10.11648/j.hyd.20251302.11},
  eprint = {https://article.sciencepublishinggroup.com/pdf/10.11648.j.hyd.20251302.11},
  abstract = {The study aimed to establish climate change on temperature trends, variation and change point patterns in Warri, Nigeria, using 31-year daily temperature data (1992-2022). The primary data were obtained from the Nigerian Meteorological Agency (NIMET) for Warri to understand the temperature dynamic in the city. Both the annual maximum and minimum temperatures were extracted from the dataset and also the mean temperature was obtained by getting the mean temperature of the maximum temperature values. Mann-Kendall trend tests, linear regression, change point detection through CUSUM analysis, and Sequential Mann-Kendall tests were used for the trend and change point analyses. Results revealed statistically significant increasing trends in annual maximum temperature (0.02°C/year) and mean temperature (0.025°C/year), while minimum temperature showed a non-significant positive trend. Change point analysis identified significant shifts in maximum and mean temperatures around 2005-2006. The average annual maximum temperature was 36.35°C, with temperature yearly projections suggesting potential increases to nearly 40°C over the next century if current trends continue. These findings have important implications for urban infrastructure and industrial operations in Warri, particularly given its significance as a major oil and gas hub. The study provides crucial insights for climate adaptation planning in coastal industrial cities experiencing warming trends.},
 year = {2025}
}
TY  - JOUR
T1  - Establishing Climate Change on Temperature Trend, Variation and Change Point Pattern in Warri, Nigeria
AU  - Kigigha Olali
AU  - Ify Lawrence Nwaogazie
AU  - Chiedozie Francis Ikebude
Y1  - 2025/03/26
PY  - 2025
N1  - https://doi.org/10.11648/j.hyd.20251302.11
DO  - 10.11648/j.hyd.20251302.11
T2  - Hydrology
JF  - Hydrology
JO  - Hydrology
SP  - 90
EP  - 101
PB  - Science Publishing Group
SN  - 2330-7617
UR  - https://doi.org/10.11648/j.hyd.20251302.11
AB  - The study aimed to establish climate change on temperature trends, variation and change point patterns in Warri, Nigeria, using 31-year daily temperature data (1992-2022). The primary data were obtained from the Nigerian Meteorological Agency (NIMET) for Warri to understand the temperature dynamic in the city. Both the annual maximum and minimum temperatures were extracted from the dataset and also the mean temperature was obtained by getting the mean temperature of the maximum temperature values. Mann-Kendall trend tests, linear regression, change point detection through CUSUM analysis, and Sequential Mann-Kendall tests were used for the trend and change point analyses. Results revealed statistically significant increasing trends in annual maximum temperature (0.02°C/year) and mean temperature (0.025°C/year), while minimum temperature showed a non-significant positive trend. Change point analysis identified significant shifts in maximum and mean temperatures around 2005-2006. The average annual maximum temperature was 36.35°C, with temperature yearly projections suggesting potential increases to nearly 40°C over the next century if current trends continue. These findings have important implications for urban infrastructure and industrial operations in Warri, particularly given its significance as a major oil and gas hub. The study provides crucial insights for climate adaptation planning in coastal industrial cities experiencing warming trends.
VL  - 13
IS  - 2
ER  -
Department of Civil and Environmental Engineering, University of Port Harcourt, Choba, Nigeria
Department of Civil and Environmental Engineering, University of Port Harcourt, Choba, Nigeria
Department of Civil and Environmental Engineering, University of Port Harcourt, Choba, Nigeria
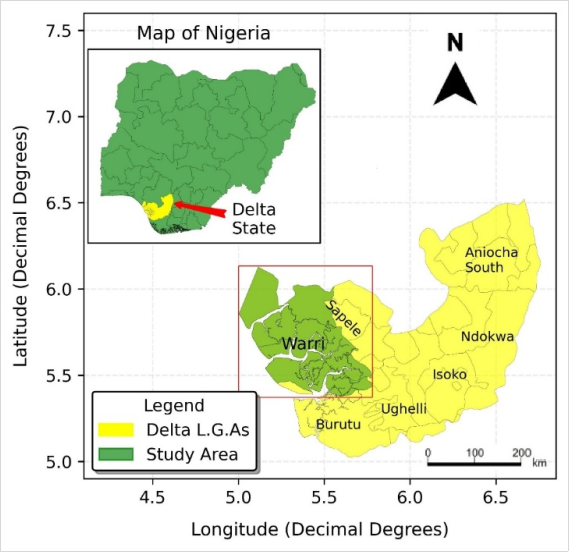
Figure 1. Map of Study Area (Warri in South Central Nigeria).
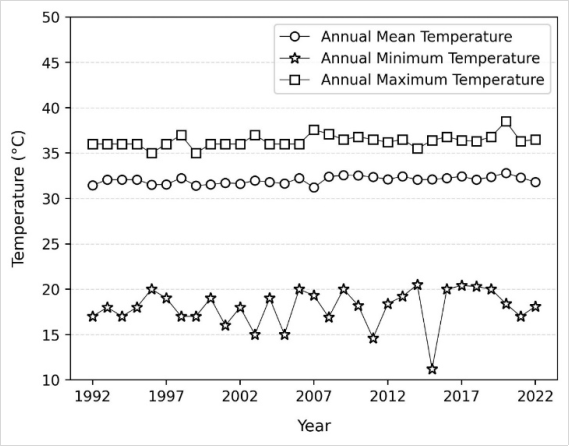
Figure 2. Plot of annual temperature series for the study for Warri.
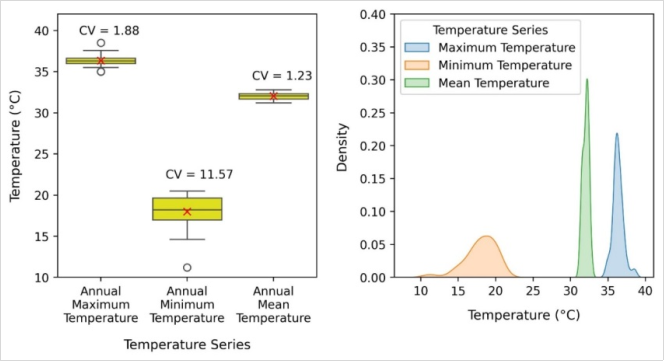
Figure 3. Distribution and summary statistics of temperature series.
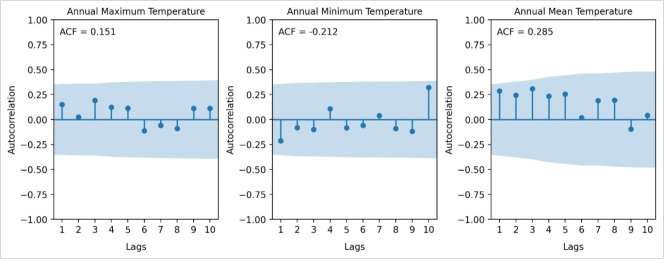
Figure 4. Rainfall precipitation correlogram of ACF for Warri.
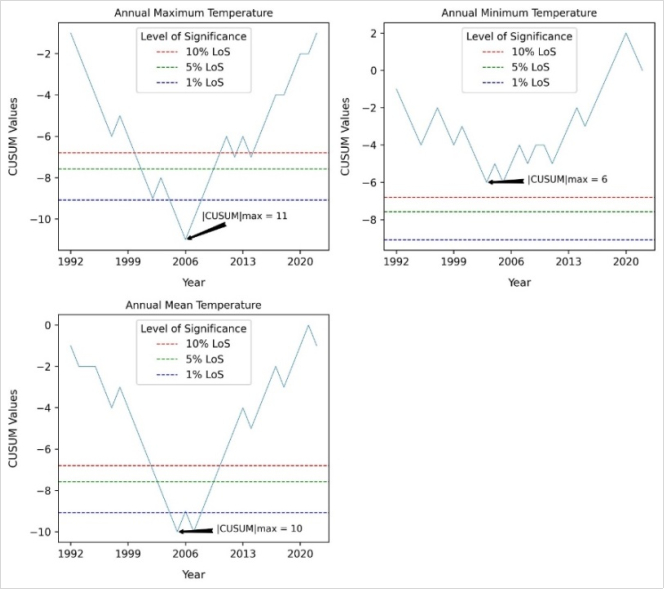
Figure 5. Distribution-free CUSUM plot for temperature series for Warri.
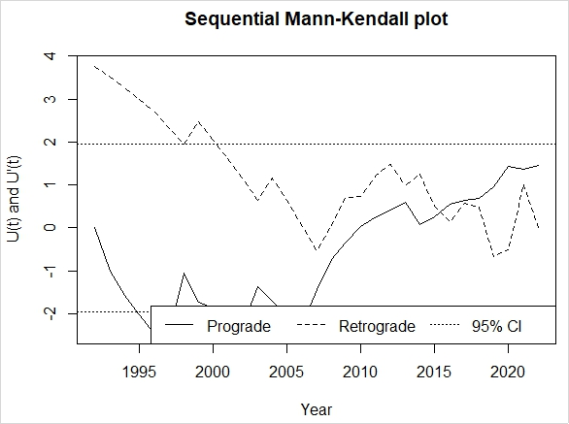
Figure 6. Sequential Mann-Kendall plot for Annual Maximum Temperature.
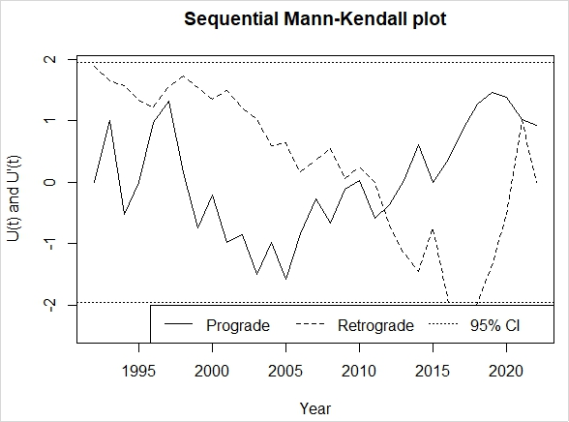
Figure 7. Sequential Mann-Kendall plot for Annual Minimum Temperature.
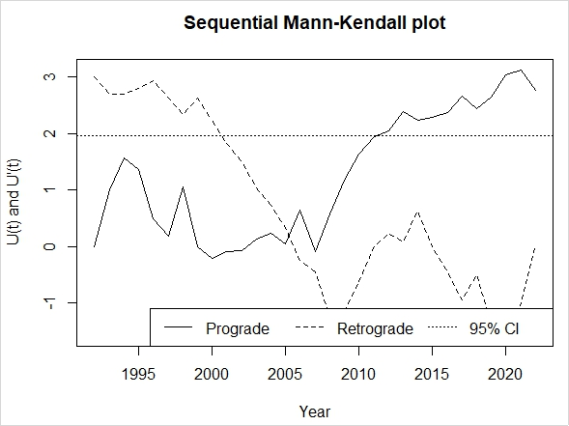
Figure 8. Sequential Mann-Kendall plot for Annual Mean Temperature.
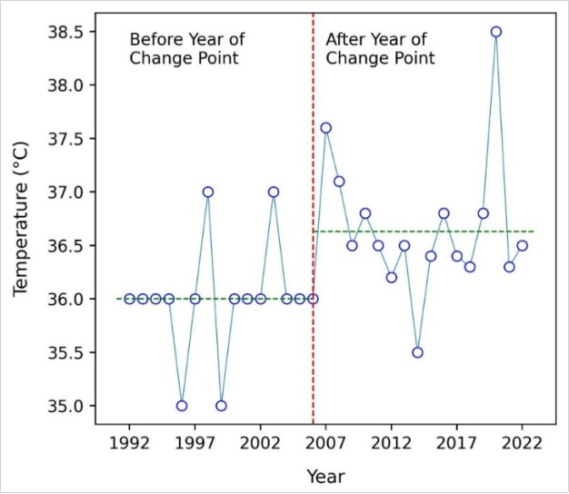
Figure 9. Annual Maximum Temperature before and after change point year.
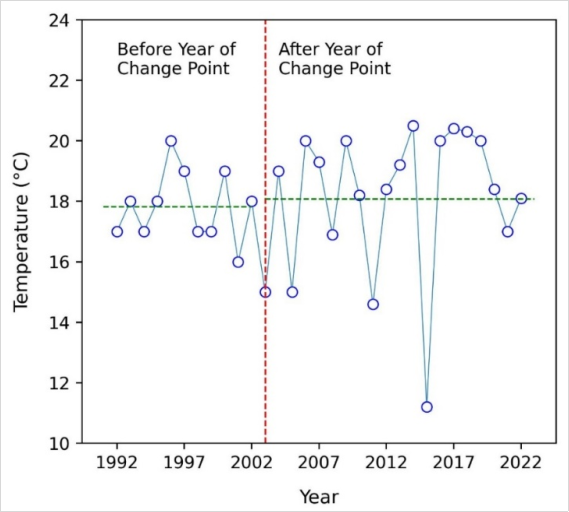
Figure 10. Annual Minimum Temperature before and after change point year.
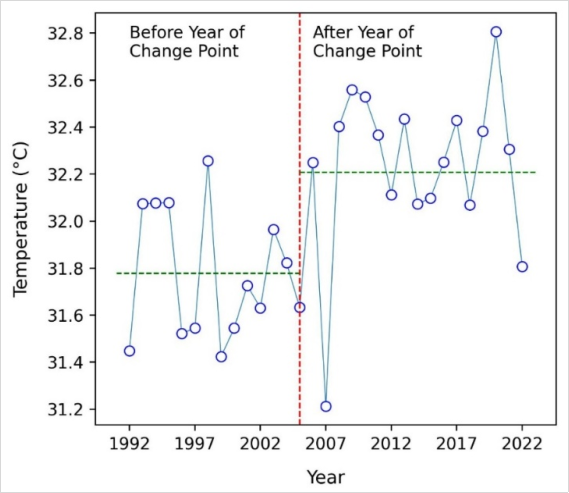
Figure 11. Annual Mean Temperature before and after change point year.
Information

