Research Article | | Peer-Reviewed

Diversity of Cyanobacteria in Some Polluted Wetlands of Nkwen in Bamenda (North-West, Cameroon)

Published in Frontiers (Volume 4, Issue 2)
Received: 6 January 2024    Accepted: 23 January 2024    Published: 6 June 2024
Views:       Downloads:
Abstract

Human activities more and more intensify the pollution of aquatic ecosystems. These pollutants lead to some Cyanobacteria proliferation causing “blooms” or “efflorescence” and disappearance of sensitive species. The aim of the study was to determine the composition and variation of Cyanobacteria community in some polluted wetlands of Nkwen in Bamenda. Sampling of Cyanobacteria took place from October 2022 to September 2023 by using plankton net for phytoplankton and scrubbing for periphyton. Some hydromorphological and physicochemical parameters of water were measured in situ and in the laboratory. Results showed that species richness of microalgae amounted to 11 families divided into 22 genera and 46 species. Oscillatoriaceae constituted the most important family (26.66% with 12 species) of the Cyanobacteria community, in the study sites. Shannon-Weaver’s index was weak and varied between 1.24 (site 6) and 2.65 (site 2). These results showed that wetlands of Nkwen had a Cyanobacteria community more abundant where the water velocity is low, with high nitrates and phosphates contents. Different Cyanobacteria families with strong proliferation in polluted waters (sites 1, 2 and 3) were: Oscillatoriaceae, Gloeotrichiaceae, Rivulariaceae, Nostocaceae, Merismopediaceae, Microcoleaceae, Microcystaceae and Tolypotrichaceae. On the other hand, the families abundantly present in less polluted waters (sites 4, 5 and 6) were: Chroococcaceae, Pseudanabaenaceae and Aphanizomenonaceae. Thus, physicochemical parameters have an influence on the composition and structure of Cyanobacteria community in wetlands of Nkwen in Bamenda. Monitoring, based on biological indices of Cyanobacteria, could be developed to prevent the risks of perturbation of these wetlands.

Published in Frontiers (Volume 4, Issue 2)
DOI 10.11648/j.frontiers.20240402.11
Page(s) 42-54
Creative Commons

This is an Open Access article, distributed under the terms of the Creative Commons Attribution 4.0 International License (http://creativecommons.org/licenses/by/4.0/), which permits unrestricted use, distribution and reproduction in any medium or format, provided the original work is properly cited.

Copyright

Copyright © The Author(s), 2024. Published by Science Publishing Group

Keywords

Cyanobacteria Community, Physicochemical Parameters, Wetlands, Nkwen, Bamenda

1. Introduction
Cyanobacteria are photosynthetic prokaryotic microorganisms found in wetlands and also known as Cyanophytes or Cyanophyceae that inhabit a wide variety of habitats as free living, epiphytic, symbiotic or parasitic plants . They form a component of the base of the aquatic food chain, and their photosynthetic activity aerates the habitat. Hence, they are of great importance in aquaculture. Spirulina and Nostoc are sources of proteins, edible to man. Nitrogen fixing forms (Anabaena and Nostoc) increase the nitrogen content of the habitat and supply nitrates in symbiotic relationships where they enhance the nutritive quality of the host plant, which could be used as green manure, fodder, and fish feed. Some act as bio-fertilizers, a fact that can be utilized effectively in improving plant nutrition, especially in rice and wheat production. As producers of growth hormones, they improve yield of rice (e.g. Phormidium tenue). Consequently they are essential in rice based economies. Some are capable of producing antibiotics (Microcystis, Nostoc and Scytonema) .
Cyanobacteria prevent soil erosion; help in soil water retention, sodium removal and act as the first colonizers in land reclamation. Blooms of some species release toxins and lead to anoxia in the habitat to the detriment of the biota. Phormidium is known to reduce the quality of brine. Some of these Cyanobacteria have been observed in Cameroon. There is therefore the need to harness them or combat the obnoxious forms . Control of blooms is expensive hence the need to use biological control measures. They are systematically classified in the plant kingdom, as they possess both bacterial (absence of nucleus and intracellular organelles) and algal characteristics (presence of chorophyll a, and phycobiliproteins and ability to make photosynthesis). They present a significant morphological diversity. They can be found either in isolated unicellular form or in colonies; or in the form of a trichome, which corresponds to a chain of cells (thallus) without a sheath; or in the form of a filament, which is a thallus with a sheath. They are generally distinguished according to their morphological characteristics: cell size, presence of sheath, color. However, these characteristics vary according to the environmental conditions, and make species identification difficult . Thanks to their great capacity for adaptation, cyanobacteria are able to colonize a large number of terrestrial and aquatic environments (fresh and marine water). Some species are adapted to extreme environments such as glaciers, hot springs or volcanic ash, as they can withstand extreme temperatures, low pH or variable light conditions. Indeed, Cyanobacteria are photo-autotrophic (they derive their energy from light through photosynthesis). Consequently, light is one of the essential factors for their development .
However, some species can survive in total darkness for long periods. In the aquatic environment, Cyanobacteria are either planktonic or pelagic if they proliferate in suspension in a water column; or benthic when they develop attached to a support. Their presence becomes problematic when certain species multiply rapidly and form a mass visible to the naked eye (on the surface or in the water) which is called a "bloom" of Cyanobacteria. In some cases, these Cyanobacteria blooms cause a change in the color of the water (red, green and blue-green) and a foul smell. Their presence is observed more and more frequently on all continents. It is becoming a growing international concern due to the ecological, sanitary and economic consequences of their proliferation .
In whatever way, some wetlands are used as dumping grounds for liquid and solid waste, which causes environmental pollutions. Research indicates that these wetlands which constituted up to twenty seven percent (27%) of the city of Bamenda in 1984 have now been reduced to less than six percent (6%) just 38 years later, due to urbanization and industrialization . This phenomenon is a call for concern as some associations and councilors of Bamenda II and III councils organized a protest in 2017 against the construction of an industrial plant on a wetland in Nkwen by a business tycoon. These anthropogenic disturbances of wetlands undoubtedly have the propensity to induce climate disruption and global environmental consequences. It is certainly with this awareness that countries around the world have decided to celebrate Wetlands Day on the second of February since 1971. Furthermore, despite the human pressure on wetlands, there are also natural and biological stressors such as bacteria and algae in the water that affect the natural state of wetlands, including climate change, invasions of other species and pests. The increase pressure on wetlands from all these stressors has reduced natural ecological functions such as the ability to enhance groundwater storage and reduced carbon sequestration.
The maintenance and restoration of the aquatic ecosystems are well illustrated by a study of the biodiversity communities. This biodiversity especially the Cyanobacteria community are affected by the change or disturbance of the concerned hydrosystems. A few of such studies have been done in the study of algal communities in some wetlands in the North-West Region.
The aim of the study was to determine the composition and variation of Cyanobacteria community in some polluted wetlands of Nkwen in Bamenda (North West, Cameroon).
2. Materials and Methods
2.1. Description of Study Sites
Six (6) sites were delimited (Figure 1). Each site was found around a bridge, and near the road because accessibility and security. Site 1 (5°57’45.80244” N and 10°10’4.97892” E) is located in Mile 2, opposite “Miracle informatique”. This River is polluted by waste coming from household, market, HYSACAM, CONGELCAM and pig manure. The wastes are dumped directly in the river. The vegetation surrounding the site is dominated by pioneer species like Alternanthera sessilis and Commelina benghalensis. Site 2 (5°58’33.2634” N and 10°10’39.01548” E) is located in Mile 3, Farmer’s house junction. It’s located in a polluted zone where the source of pollution is waste coming from household and farms. The vegetation surrounding the site is dominated by young macrophytes like Echinochloa pyramidalis, Acroceras zizanoides and Leersia hexandra. Sites 3 and 4 are located in Mile 4, respectively near FOKOU and Health center. In Site 3 (5°59’2.38164” N and 10°10’50.36196 E), the main activities are agriculture, fishing, car wash and pig farming producing pesticides, chemical manures, household waste and pig manures in the wetlands. The vegetation in this site is dominated by Pennisetum purpureum and Echinochloa pyramidalis. Site 4 (5°59’22.7724” N and 10°11’29.4468” E) is less polluted by water coming from surrounding highlands. Site 5 (5°59’58.08696” N and 10°12’26.1918” E) is located in Mile 5, behind SHUMAS, less polluted. The vegetation in this site is dominated by transition species like Alchornea cordifolia and Raphia sp. Site 6 (6°00’22.06944” N and 10°13’1.50456” E) is located in Mile 6, Apostolic junction, less polluted. The main anthropogenic activities are construction of buildings. The vegetation found in this site is a secondary forest dominated by Raphia sp., Alchornea cordifolia and Eucalyptus sp.
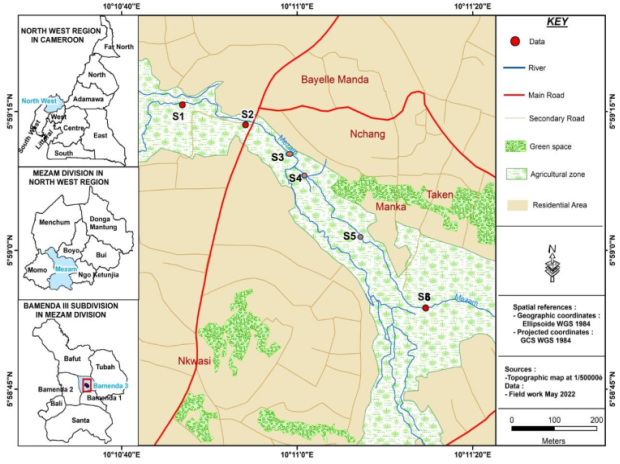
Figure 1. Localization of the study area and sites modified.
2.2. Sampling and Determination of Physicochemical Parameters in the Study Sites
The physicochemical parameters were measured between 8:00 and 11:00 a.m. in all the sites. Temperature, electrical conductivity, hydrogen potential, salinity and total dissolved solids were measured with a Temperature/pH/Salinity/Conductivity/TDS multi-parameter of OAKTON instruments Trademark. The dissolved oxygen was measured with an Oxymeter of WTW Trademark. Some water samples were collected with polyethylene (PE) bottles of 1.5 L and stored at -5°C, in darkness inside a cool box for the analysis of nitrates, total phosphorus and biochemical oxygen demand (BOD5) by using spectrophotometer methods .
In each station, information with regards to the width of the river course (wet bed), the surface area inside water were taken. The velocity of the water was determined using permanganate and a stopwatch. To do that, permanganate was thrown into the river and was timed for a distance of 10 m. The calculations were done using the following formula: V = d/t; V is water velocity in m/s, d is distance in m and t is time in s. The river depth was measured with a calibrated stick by inserting in 3 parts of the water (in the 2 banks and in the middle of the water). The transparency of the water was measured with Secchi disk by inserting it vertically in the water. The nature of riverbed substrates was written down.
2.3. Sampling and Analysis of Cyanobacteria
The sampling of Cyanobacteria was done at the study sites by using plankton net for phytoplankton. The sample was transferred into a 150 mL bottle. For phytobenthos, a surface of 30 × 30 cm2 was delimited respectively on the rock sides exposed to the water, scraped and on macrophytes bound in the water; macrophytes on this surface were detached and squeezed. The residues were transferred in a 150 mL bottle and fixed by 10% formalin for preservation.
In the laboratory, after dumping and homogenization of samples, some subsamples more concentrated were diluted by distilled water in the 100 mL beakers; the less concentrated samples were transferred directly in the 50 mL beakers; but the microfiltration was done on the concentrated samples. After 24 h sedimentation, a drop of each subsample was mounted between slide and lamella, and observed by the microscope with 3 replications. Some identification keys were used during the analysis .
For quantitative analysis, after homogenization of samples, 1 mL of each was taken by a micropipette and dumped in the Malassez’s slide; then mounted in the light microscope where the counting was done. During the counting, 1 isolated cell, 1 colony and 1 filament of 100 µm was considered as 1 individual.
2.4. Determination of Biological Parameters
Species richness is the total number of taxa identified in a sample. It is an element that indicates the specific variety of the stand that is its species richness. This property may be a distinctive criterion of the ecosystem or stations studied within a given ecosystem.
Simpson’s D index is D = WNi (Ni-1)/N(N-1) or D = Wpi2. This index represents the probability that two individuals selected at random from a sample belong to the same species.
The Shannon-Weaver (H’) index represents a wealth of information on the stand structure of a given sample and how individuals are distributed among different species. A low diversity index indicates that the community is young with high multiplication rate with dominance of one or a few species, while a high index characterizes mature populations with a complex specific composition with a stability relatively large population. The Shannon diversity index (H') for a sample corresponds to the value calculated from the formula: H’ = -∑((ni/N) × log2 (ni/N)) with ni = number of individuals belonging to a species, N = total number of species.
The regularity of Pielou (J) is given by the formula: J = H'/log2S, with S = total volume.
The dominance index "d" of Berger and Parker which has the formula: d = Nmax/N; Nmax is the maximum abundance or number of the most common individuals in the medium and N is the total abundance. It establishes the dominance of the species and shows that, if d is weak it tends to 0, the diversity is great, and the dominance is zero. When d tends to 1, one or a few species are dominant and a low diversity.
To know the number of dominant species, the Hill index is calculated = (1/D)/expH'.
Sorensen’s Similarity index (S) is given by S = 2c/(2c+a+b). Let A and B be two media, c = number of species common to both media; a = number of species present in the medium A and b = number of species present in the medium B. Sorensen’s similarity index (S) varies from 0 (lack of similarity) to 1 (identical media),
2.5. Density of Microalgae
Number of object/mL of taxon I (Ni) is obtained with: Ni = [(xi×A×a×v)/1000×c)]×d, with xi: number of counted objects, A: volume of Malassez’s cell, a: total number of fields, v: sedimented volume in mL, c: number of counted fields, and d: diluted factor.
2.6. Statistical Analysis
Microsoft Office Excel software was used for keying and coding data collected during the study. Qualitative and quantitative variables were presented as frequency and mean ± standard deviations respectively in charts. One-way ANOVA was used to study the difference among sites, where significant values (P < 0.05) was obtained and least significant difference test was subsequently applied to detect the specific point of difference among variables and correlation among physicochemical, biodiversity was conducted. These analyses were performed using XLSTAT software and PAST for the dendrograms, principal components analysis and bar chats.
3. Results
3.1. Some Abiotic Parameters of Water Related to Cyanobacteria in the Study Sites
Hydro-morphological parameters were variables in the study sites (Table 1). Depth and width depended on rainfall. The minimal value of depth was 35 ± 35 cm obtained in site 4 and the highest value was 100 ± 80 cm obtained in site 5. In the same way, width varied from 3 ± 3 m in site 2 to 20 ± 10 m in site 3. Transparency showed that water was much diluted in the sites and varied from 30 ± 15 cm site 4 to 65 ± 20 cm in site 5. Velocity varied from 0.16 ± 0.10 m/s in site 2 to 0.96 ± 0.90 m/s in site 3. Study sites showed different granulometry but 3 types of sediments were dominant (Sand, mud and rocks). Rocks were variable from 80 ± 10% in site 2 to 2 ± 1% in site 6, mud was variable from 90 ± 15% in site 6 to 5 ± 3% in site 2, and sand was variable from 80 ± 14% in site 2 to 5 ± 5% in site 3.
Temperature was less variable and upper to 20°C favorable to the development of organisms. The highest value was 24.5 ± 5.6°C in site 6 (Table 1).
Mineral parameters were highest in sites 1, 2 and 3 significantly different to sites 4, 5 and 6 with lowest values (Table 1). Electrical conductivity, total dissolved solids, and salinity ranged respectively from 227.5 ± 45.67 µS/cm, 203.87 ± 100.45 ppm, 175.02 ± 46.5 ppm in site 1 to 23.6 ± 20.34 µS/cm, 15.2 ± 13.41 ppm, 17.32 ± 15.45 ppm in site 5. Ecologically, pH was neutral (between 6.5 and 7.5). It was ranged from 7.21 ± 0.95 site 2 to 6.55 ± 0.55 site 5. Organic parameters were fewer variables in the sites. Nitrates were ranged from 6.45 ± 0.75 mg/l in site 1 to 0.81 ± 0.75 mg/l in site 5. Phosphates were ranged from 6.18 ± 0.45 mg/l in site 2 to 0.85 ± 1.15 mg/l in site 5. Biological demand oxygen was significantly different in the sites with highest value obtained in site 3 of 12200 ± 2150 mg/l.
Table 1. Some hydro-morphological and physicochemical parameters of the study sites.

Parameters

Site

1

2

3

Min

Max

Average

Min

Max

Average

Min

Max

Average

Depth (cm)

55

150

75 ± 65b

35

105

45 ± 40a

50

120

60 ± 55b

Width (m)

4

8

5 ± 4a

3

6

3 ± 3a

17

25

20 ± 10b

Transparency (cm)

45

55

51 ± 20b

30

45

40 ± 10a

37

56

45 ± 26a

Velocity (m/s)

0.67

0.89

0.74 ± 0.22c

0.15

0.26

0.16 ± 0.10a

0.76

0.98

0.96 ± 0.90d

Sediments (%)

Rocks

75

85

80 ± 10b

5

20

15 ± 11a

5

20

15 ± 10a

Sand

10

15

15 ± 10a

75

85

80 ± 14c

5

10

5 ± 5a

Mud

5

10

5 ± 5a

3

10

5 ± 3a

70

85

80 ± 12c

Ts (°C)

20.3

25.5

23.1 ± 5.2a

20.4

25.4

23.2 ±4.9a

20.1

24.5

23.2 ± 5.5a

TDS (ppm)

195.45

225.41

203.87 ± 100.45e

125.67

156.34

130.25 ± 67.56d

115.01

150.23

125.75 ± 60.65d

COND (µS/cm)

214.45

235.67

227.5 ± 45.67e

167.55

195.34

176.34 ± 35.54d

185.25

210.25

198.25 ± 43.24d

Salinity (ppm)

165.95

185.14

175.02 ± 46.5d

65.45

89.45

78.21 ± 45.55c

75.45

95.15

85.24 ± 30.45c

pH

6.15

7.01

6.98 ± 0.68a

6.98

7.35

7.21 ± 0.95a

7.01

7.25

7.15 ± 0.30a

Oxydability (mg/l)

3.15

4.23

3.86 ± 1.54a

4.12

5.34

4.25 ± 0.74a

3.01

3.75

3.25 ± 0.43a

Nitrates (mg/l)

6.01

7.25

6.45 ± 0.75b

4.24

5.32

4.59 ± 0.95b

5.2

6.12

5.7 ± 2.45b

PO (mg/l)

4.66

6.43

5.32 ± 1.85b

6.01

6.78

6.18 ± 0.45b

4.05

4.75

4.25 ± 4.78b

DBO5 (mg/l)

9903

11905

11254 ± 2102d

10678

12000

11300 ± 2456d

11965

12800

12200 ± 2150e

Parameters

Site

4

5

6

Min

Max

Average

Min

Max

Average

Min

Max

Average

Depth (cm)

30

75

35 ± 35a

55

175

100 ± 80c

60

150

80 ± 46b

Width (m)

12

23

15 ± 11b

3

7

5 ± 4a

5

10

5 ± 4a

Transparency (cm)

29

55

30 ± 15a

40

65

65 ± 20b

20

45

30 ± 21a

Velocity (m/s)

0.25

0.45

0.31 ± 0.15b

0.12

0.25

0.16 ± 0.13a

0.38

0.45

0.41 ± 0.22b

Sediments (%)

Rocks

5

10

5 ± 3a

15

25

20 ± 15a

1

2

2 ± 1a

Sand

65

85

80 ± 15c

25

35

30 ± 20b

5

14

8 ± 10a

Mud

5

20

15 ± 5a

45

60

50 ± 35b

75

95

90 ± 15c

Ts (°C)

20.6

24.2

23.98 ± 5.6a

20.2

26.7

24.1 ± 4.6a

21.3

25.8

24.5 ± 5.6a

TDS (ppm)

45.65

66.15

52.16 ± 45.54b

10.4

25.0

15.2 ± 13.41a

75.45

115.45

99.78 ± 85.25c

COND (µS/cm)

84.25

134.54

103.23 ± 86.54c

17.5

65.4

23.6 ± 20.34a

65.45

86.43

75.29 ± 54.50b

Salinity (ppm)

54.34

70.85

68.23 ± 54.64b

10.25

25.45

17.32 ± 15.45a

42.45

67.55

56.23 ± 35.45b

pH

6.50

7.04

6.68 ± 1.35a

6.25

6.85

6.55 ± 0.55a

6.55

6.98

6.79 ± 0.50a

Oxydability (mg/l)

3.14

3.86

3.48 ± 0.56a

2.15

2.87

2.54 ± 0.75a

3.50

4.01

3.87 ± 1.25a

Nitrates (mg/l)

3.25

4.35

3.82 ± 1.13b

0.65

1.23

0.81 ± 0.75a

2.25

3.25

2.87 ± 1.65b

PO (mg/l)

2.15

3.01

2.79 ± 1.04b

0.65

1.45

0.85 ± 1.15a

2.14

2.95

2.74 ± 0.95b

DBO5 (mg/l)

3145

3950

3450 ± 604b

215

276

235 ± 215a

1050

1650

1250 ± 715c

Min = minimal, Max = Maximal, Ts = temperature of water, TDS = total dissolved solids, COND = electrical conductivity, PO = phosphates, DBO5 = biological demand oxygen; cases on the same line with the same letter mean no significant difference with p<0.05.
3.2. Biological Parameters of Study Sites
3.2.1. Species Richness
Total species richness of the study sites amounted to 3 orders divided in 11 families, 22 genera and 46 species (Table 2). The most represented family was that of Oscillatoriaceae (26.08%) with 12 species (Figure 2).
Table 2. Species richness of study sites.

Orders

Families

Genera

Number of Species

Nostocales

Nostocaceae

Anabaena

1

Anabaenopsis

1

Nordularia

1

Nostoc

4

Raphidiopsis

2

Aphanizomenonaceae

Aphanizomenon

2

Merismopediaceae

Aphanocapsa

3

Merismopedia

3

Rivulariaceea

Calothrix

3

Rivularia

2

Gloeotrichiaceae

Gloeotrichia

1

Pseudanabaenaceae

Limnothrix

1

Tolypothrichaceae

Tolipothrix

1

Chroococcales

Chroococcaceae

Coelosphaerium

1

Synechococcus

1

Synechocystis

2

Microcystaceae

Microcystis

3

Oscillatoriales

Oscillatoriaceae

Oscillatoria

8

Lyngbya

3

Microcoleus

1

Microcoleaceae

Phormidium

1

Planktothrix

1

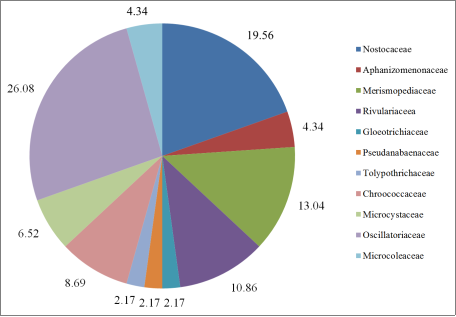
Figure 2. Proportions (%) of different families according to the number of species.
3.2.2. Diversity Indices
The number of species was variable in the study sites (Table 3). The average highest value obtained was 5 ± 1 species (site 6) and the average lowest value obtained was 22 ± 4 species (site 2). Dominance was variable in the study sites. The highest value was obtained in site 6 of 0.3189 ± 0.0037 and the lowest value was obtained in site 2 of 0.08864 ± 0.00253. Simpson was variable in the study sites. The highest value was obtained in site 2 of 0.9114 ± 0.0026 and the lowest value was obtained in site 6 of 0.6809 ± 0.0035. Shannon-Weaver’s index was weak and varied between 1.239 ± 0.007 (site 6) and 2.659 ± 0.021 (site 2). Pielou’s equitability index was variable in the sites. The highest value was 0.924 ± 0.0087 (site 5) and the lowest value was 0.7591 ± 0.0118 (site 4). Hill’s index was also variable in the study sites. The highest value was 0.8632 ± 0.0063 obtained in site 6 and the lowest value was 0.5053 ± 0.0166 obtained in site 4.
Table 3. Variation of some diversity indices in the study sites.

Site

Parameters

Taxa (S)

Dominance (D)

Simpson (1-D)

Shannon (H’)

Evenness (e^H/S)

Equitability (J)

1

Min

7

0.2408

0.7476

1.694

0.6044

0.7708

Max

10

0.2524

0.7592

1.726

0.6241

0.7855

Average

9 ± 2

0.2465 ± 0.0059

0.7535 ± 0.0059

1.71 ± 0.016

0.6145 ± 0.0101

0.7784 ± 0.0076

2

Min

18

0.08652

0.9088

2.638

0.6356

0.8534

Max

25

0.09117

0.9135

2.677

0.6609

0.866

Average

22 ± 4

0.08864 ± 0.00253

0.9114 ± 0.0026

2.659 ± 0.021

0.6494 ± 0.0138

0.8603 ± 0.0069

3

Min

12

0.2453

0.734

1.772

0.588

0.7694

Max

13

0.266

0.7547

1.826

0.621

0.7931

Average

13 ± 1

0.2551 ± 0.0109

0.745 ± 0.011

1.805 ± 0.033

0.6052 ± 0.0172

0.7819 ± 0.0129

4

Min

16

0.1672

0.8187

2.117

0.4887

0.7473

Max

19

0.1813

0.8327

2.18

0.5203

0.7694

Average

17 ± 2

0.1739 ± 0.0074

0.8261 ± 0.0074

2.151 ± 0.034

0.5053 ± 0.0166

0.7591 ± 0.0118

5

Min

9

0.1454

0.8461

2.011

0.8302

0.9153

Max

9

0.1539

0.8546

2.046

0.8599

0.9313

Average

9 ± 0

0.1489 ± 0.0035

0.8507 ± 0.0046

2.032 ± 0.021

0.8461 ± 0.0159

0.924 ± 0.0087

6

Min

5

0.3159

0.6774

1.232

0.8569

0.8886

Max

6

0.3226

0.6841

1.246

0.8692

0.8989

Average

5 ± 1

0.3189 ± 0.0037

0.6809 ± 0.0035

1.239 ± 0.007

0.8632 ± 0.0063

0.8939 ± 0.0053

Max: maximum, Min: minimum
3.2.3. Similarity Between the Study Sites According to the Species
According to the similar number of species between the study sites, the similarity was high between sites 2 and 4 (8 species), followed by sites 1 and 2 (5 species) (Figure 3). Between sites 1 and 5, sites 1 and 6, there was not similarity (0 species). Sorensen’s similarity index was high between site 2 and 4 with 42%, and secondly between 1 and 4 with 36% (Table 4).
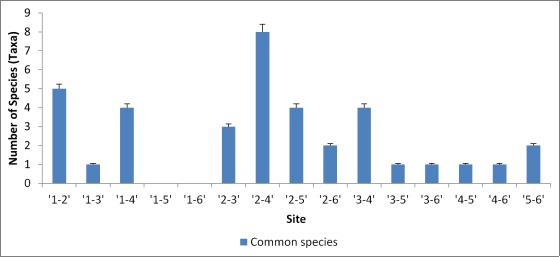
Figure 3. Variation of the number of Species in the study sites.
Table 4. Sorensen’s similarity index between the study sites.

Site

1

2

3

4

5

6

1

1

2

0.29

1

3

0.11

0.18

1

4

0.36

0.42

0.29

1

5

0.00

0.24

0.10

0.07

1

6

0.00

0.15

0.14

0.09

0.30

1

3.2.4. Density of Different Families in the Study Sites
Total density of Cyanobacteria was high in site 5 with a value of about 18800 Ind./l (Figure 4). Site 2 followed with a value of about 11700 Ind./l. The family getting the highest density was Aphanizomenonaceae, about 8000 Ind./l observed in site 5. This followed by Oscillatoriaceae with about 7900 Ind./l. The lowest density was obtained in site 2 by Gloeotrichiaceae with 100 Ind./l.
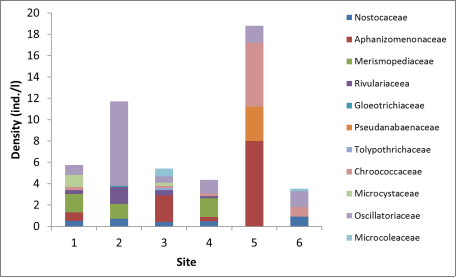
Figure 4. Variation of densities of the different families in the study sites.
3.2.5. Distribution of Different Families According to Physicochemical Parameters in the Study Sites
The principal component analysis F1×F2 with 72.05% inertia grouped the sites according to 9 abiotic parameters (Figure 5). The factorial axis F1 (53.51% inertia) was positively correlated with: oxidability, total phosphorus, hydrogen potential, biochemical oxygen demand, electrical conductivity, total dissolved solids, salinity and nitrates. It was negatively correlated with water temperature. However, the factorial axis F2 (18.55% inertia) was positively correlated with: water temperature, oxidability and total phosphorus. It was negatively correlated with: hydrogen potential, biochemical oxygen demand, total dissolved solids, salinity and nitrates. These physicochemical parameters divided the sites into two groups: group 1, presenting very high physicochemical parameters, was made up of sites 1, 2 and 3. Group 2, presenting low physicochemical parameters, was made up of sites 4, 5 and 6. Different cyanobacteria families with strong proliferation in polluted waters (sites 1, 2 and 3) were: Oscillatoriaceae, Gloeotrichiaceae, Rivulariaceae, Nostocaceae, Merismopediaceae, Microcoleaceae, Microcystaceae and Tolypotrichaceae. On the other hand, the families abundantly present in less polluted waters (sites 4, 5 and 6) were: Chroococcaceae, Pseudanabaenaceae and Aphanizomenonaceae.
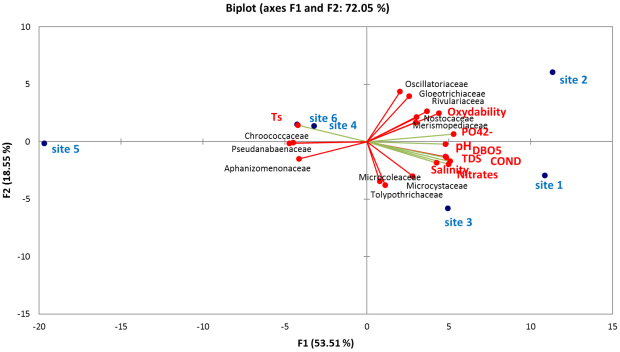
Figure 5. Distribution of Cyanobacteria families according to physicochemical parameters and sites.
In general, the total density of Cyanobacteria depended not only on nutritional factors (nitrates and total phosphorus) but also on water mineralization parameters such as salinity, electrical conductivity, total dissolved solids, as well as the velocity of the water (Figure 6). The linear regression (model equation: Density = 12.963485-10.3215*Velocity) showed a 95% confidence interval between the total density per site and the water velocity.
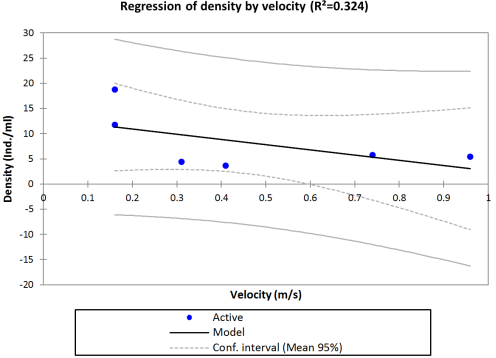
Figure 6. Linear regression of density by velocity in the study sites.
4. Discussion
Temperature influences the rate of chemical and biological activities in the aquatic environment . The temperature values in the 6 study sites were within the norms (20-30°C) . The lowest temperature was at site 1 because there is riparian bridge cover which reduces the water surface exposed to light. The highest temperature at site 6 was probably due to the increased load of suspended solids, soil particles and decomposed organic matter in the river, as they absorb more heat . Thus, the variation in temperature among the sampling sites was due to anthropogenic activities in the study area catchment. The pH value of the 6 sites was within the permissible range and these results are similar to those of Motto et al.’s study in Londji River, where the pH values vary between 6 and 7, determinants of a biodiversity rich environment . Electrical conductivity (EC) is a useful indicator of mineralization in a water sample. EC is an indication of the total amount of ionisable salts in solution as it gives a numerical expression of the ability of a solution to conduct electric current . Most mineral salts in solution are good conductors. In contrast, organic compounds are poor conductors. Conductivity varied from 227.5 ± 45.67 µS/cm and 23.5 ± 20.34 μS/cm. It is positively correlated with salinity and TDS and describes an increasing gradient of dissolved salts in the environment and confirms that the waters of wetlands of Nkwen would be good conductors of electric current. The results are higher than those of Ndjouondo et al.’s study within the Batika River, Yabassi (44.25-58.25 μS/cm) . Total dissolved solids at all sites in the wetlands of Nkwen were within the WHO stated tolerance limits of 500 mg/l as the maximum tolerance limit .
The nitrate levels observed at the sampling sites were below the WHO limit of 50 mg/l . Although the nitrate values are below the standards, the fluctuating values at the sampling sites are indicators of human influence on the Nkwen Rivers. Site 1 being the most affected could be due to sources of chemical contamination from various anthropogenic activities such as runoff from fertilized agricultural land, sewage, landfill, decaying plant debris and waste from Nkwen market. The results are lower than those obtained by Tsafack’s study in the Nkwen River (1.52-6.85 mg/l) and higher than those obtained by Ndjouondo et al.’s study in the Batika River, Yabassi (0.81-1.55 mg/l) . According to World Health Organization, the maximum allowable limit for phosphate is 5 mg/l . The obtained phosphorus values were higher than this classification, which could be due to intense human activities such as agriculture, industries, wastewater, and household waste. Ammonia, nitrates and phosphates are essential nutrients for Cyanobacteria, but when present in excessive amounts they can stimulate undesirable growth such as algal blooms. Excessive nutrient inputs lead to an explosion of phytoplankton. The results obtained are higher than those obtained by Tsafack’s study in the Nkwen River (0.86-3.05 mg/l), Ndjouondo et al.’s study in the Batika River (0.15-0.23 mg/l), and Severes et al.’s study in some unexplored water bodies in a rapidly developing industrial region in India (0.15-0.67 mg/l) .
Pollution sensitive and tolerant organisms are present in "clean" waters, but it is the absence of sensitive organisms coupled with the presence of tolerant organisms that may indicate damage . The results of the species richness amounting to 46 species showed a significant richness in the sampling sites with the most represented family being the Oscillatoriaceae (26.66% with 12 species). The higher proportions of cyanobacteria appear exclusively during periods of stable weather and high temperature. Their success could be explained by the nutrient status of the environment and the water temperature which is close to the optimal culture temperature (above 20°C) of the species concerned, associated with the high turbidity of the water. These results are similar to those of Pratibha et al.’s study who sampled Cyanobacteria in wetlands in the industrialized district of Sambalpur, India showed 55 species; and different to those of Gupta’s study who worked on diversity of Cyanobacteria of Broknes Peninsula of Larsemann Hills, East Antarctica showed 16 species . The results are not consistent with those found by Motto’s study where Bacillariophyceae are more represented (59.67%) in the Londji River in Kribi . This could be explained by the faster flow of water in this river from upstream to downstream compare to the above mentioned river. Cyanobacteria live in freshwater where higher water flows are known to threaten their multiplication due to their size and ability to detach from supports and drift in the current. Furthermore, this difference in results could also be attributed to differences in water quality. The family Oscillatoriaceae was identified as the dominant family in terms of abundance in the study sites. These results are consistent with those found by Dibong and Ndjouondo’s study in the Kambo and Longmayagui rivers in Douala where 105 species were identified, of which 70.39% of Cyanobacteria community was Oscillatoriaceae .
The Shannon-Weaver index obtained was between 1.24 and 2.65. Standard values are between 1.5 and 3.5 . A low cyanobacteria diversity index (site 6) indicated that the community is young with a high multiplication rate with the dominance of one or a few species or that the population is under the influence of a single growing species. The high diversity index (site 2) showed that the population is not under the influence of a single developing species but rather a strong development of several different individuals. This result is lower than those obtained by Dibong and Ndjouondo’s study in the Kambo and Longmayagui rivers (3.8-4.95) indicating rich diversity . The regularity close to 1 justified the stability of the community showing that site 5 (0.92) is the most stable site. This result is slightly high compared to Motto et al.’s study in the Londji River who found community stability between the values 0.8 and 0.9 .
Cyanobacteria densities showed a large variation between sites as the family Oscillatoriaceae appeared to be the densest family in site 1. This is because Cyanophyceae form blooms (blooms) in streams polluted with organic matter. Watercourses with a very slow current velocity polluted by organic matter undergo a strong eutrophication by letting efflorescence appear through the multiplication of one or several species. These results are in line with those of Aurousseau who worked on the evaluation of the impact of rivers on eutrophication in the coastal strip in France, Groga who was interested in the structure, functioning and dynamics of phytoplankton in Lake Ta'abo in Ivory Coast and Sana’a who addressed the structure, dynamics and physicochemical and phytoplanktonic typologies of the Bou Regreg estuary in Morocco .
5. Conclusion
The overall objective of the study was to determine the composition and variation of cyanobacteria community in some polluted wetlands of Nkwen in bamenda (North-West, Cameroon). The inventory of cyanobacteria identified a total of 11 families divided into 22 genera and 46 species. Oscillatoriaceae constituted the most important familly (26.66% with 12 species) of the cyanobacteria community, in the study sites. Cyanobacteria community has abundant species where the velocity of water is low with high nitrates and phosphates contents. Some physico-chemical parameters (salinity, electrical conductivity and total dissolved solids) divided study sites in 2 groups according to the degree of pollution; polluted area grouping sites in town (1, 2 and 3) where Oscillatoriaceae, Gloeotrichiaceae, Rivulariaceae, Nostocaceae, Merismopediaceae, Microcoleaceae, Microcystaceae and Tolypotrichaceae were dominant and less polluted area grouping sites at the peripheral town area (4, 5 and 6) with less anthropogenic activities where Chroococcaceae, Pseudanabaenaceae and Aphanizomenonaceae were dominant. The physico-chemical relationship with the abundance of species explains the generic existence probability of cyanobacteria communities and could be used as indicator of ecological status of wetlands. The diversity and abundance of the cyanobacteria community is influenced by anthropogenic activities in the wetlands of Nkwen. Thus, physico-chemical parameters have an influence on the diversity and structure of the cyanobacteria development in the wetlands of Nkwen (Bamenda, Cameroon). Monitoring, based on biological indices of cyanobacteria, could be developed to prevent the risks of eutrophication of these wetlands.
Conflicts of Interest
The authors declare no conflicts of interest.
References
[1] Ndjouondo, G. P., Ba’ana, E. M. L., Nwamo, R. D., Fankem, H., Dibong, S. D. Structure and dynamic of periphytics algae of Batika (Yabassi) and Tongo’o Bassa rivers (Douala). International Journal of Innovation and Scientific Research, 2017, 32(2), 329-344.
[2] Mayur, G., Hiren, P., Poonam, C., Leena, S., Poonam, Y. Isolation, screening and identification of cyanobacteria and its uses in bioremediation of industrial effluents and chromium sorption. International Journal of Advanced Research in Biological Sciences, 2017, 4(4), 138-146.
[3] Ndjouondo, G. P., Teke, N. A., Mbah, G. E., Muyang, R. F. Phytoplankton characterization and the state of eutrophication of Mefou Lake (Yaounde, Cameroon). International Journal of Botany Studies, 2020, 5(4), 139-146.
[4] Dibong, S. D., Ndjouondo, G. P. Inventaire floristique et écologie des algues des rivières Kambo et Longmayagui de la zone humide de Douala (Cameroun). International Journal of Biological and Chemical Sciences, 2014, 8(6), 2560-2577.
[5] Anagnostidis, K., Komárek, J. Modern approach to the classification system of cyanophytes. Archiv fur Hydrobiology Supplement, 1985, 71, 291–302.
[6] Barry, H. R., Ann, S. A. Field and Laboratory Guide to Freshwater Cyanobacteria Harmful Algal Blooms for Native American and Alaska Native Communities. Open-File Report, U.S. Geological Survey, Reston, Virginia, 2015, pp. 15-35.
[7] Yolar, B. N., Fombe, L. F., Mokwe, B. P. J., Nuipokoh, O. M. Maladies et santé; cas des populations des zones humides de l’aire urbaine de Bamenda, Region du Nord-Ouest du Cameroun. Advances in Social Sciences Research Journal, 2019, 6(4), 220-231.
[8] Tsafack, P. Diversity and Ecology of Macrophytes of some wetlands of Bamenda (North-West Region, Cameroon). Master Thesis, Higher Teacher Training College, The University of Bamenda, 2021.
[9] Ndjouondo, G. P., Nwamo, R. D., Muyang, R. F., Ache, N. T., Kouadio, A. D. Influence of Some Abiotic Factors on the Diatom Densities in the Mezam River (Bamenda, North-West Cameroon). African Journal of Biology and Medical Research, 2023, 6(3): 40-55.
[10] Guiry, M. D., & Guiry, G. M. AlgaeBase. World-wide electronic publication, National University of Ireland, Galway. Available from:
[11] Iltis, A. Algae. In: Flora and Aquatic Fauna of Sahelo-Sudanian Africa, Durand, J. R., Leveque, C., Ed., Volume 1, ORSTOM, initiation collection, technical documents n° 44: Paris, 1980, pp. 1-60.
[12] Seifu Kebede, Travia, Y., Tamiru Alemayehu, Marc, V. Water balance of Lake Tana and its sensitivity to fluctuations in rainfall, Blue Nile basin, Ethiopia. Journal of Hydrology, 2005, 316, 233–247.
[13] Mbalassa, M., Bagalwa, M. J. J., Nshombo, M., Kateyo, M. E.. Assessment of physicochemical parameters in relation with fish ecology in ishasha River and lake Edward, Albertine Rift Valley, East Africa. International Journal of Current Microbial and Applied Sciences, 2014, 3(6), 230-244.
[14] Phul, K. S. R. Physico-chemical study of Mohan Ram Lake Shahdol (M.P.). International Journal of Applied Research; 2016, 2(1), 239-241.
[15] Motto, I. S., Priso, R. J., Essomè-Koum, G. L., Gaudin, G. L. P., Makombu, J. G., Jourdan, T., Ndoumbè–Ebombè, M., Ghepdeu, Y. G. F., Kotte-Mapoko, E. F., Geneva-Ojong, N., Dicka-Kwambè, E., Onana, J., Mialhe, E., Din, N. Diversity and distribution of algal settlement in Mangrove of Londji, Kribi-Southern-Cameroon. Journal of Applied Biosciences, 2020, 149, 15344-15361,
[16] Muthulakshmi, L., Arasu, P. T., Ilavarasi, R., Selvanayagam, S. Hydrochemical trend of ground water Rajapalayam town, Tamil Nadu, India. Journal of Materials and Environmental Science, 2015, 6(4), 1004-8.
[17] Wondie, Z. A. Comparative study on composition and abundance of major planktons and physico-chemical characteristics among two ponds and Lake Tana, Ethiopia. Journal of Coastal Life Medicine, 2015, 3(11): 852-856.
[18] World Health Organization, ''Polynuclear aromatic hydrocarbons in drinking water''. Background document for preparation of WHO Guidelines for drinking -water quality: Geneva, (WHO/SDE/WSH/03.04/59), 2003, pp. 1-27.
[19] Severes, A., Nivas, S., D'Souza, L., Hegde, S. Diversity study of freshwater microalgae of some unexplored water bodies of a rapidly developing industrial region in India. Journal of Algal Biomass Utilization, 2018, 9(2), 31-40.
[20] Mandaville, S. M. Benthic Macroinvertebrates in Freshwaters-Taxa Tolerance Values, Metrics, and Protocols. New York State Department of Environmental Conservation. Available from:
[21] Pratibha, R. D., Shantanu, B., Binata, N. Cyanobacteria in wetlands of the industrialized Sambalpur District of India. Aquatic biosystems, 2013, 9, 1-14.
[22] Gupta, P. First report of diversity of Cyanobacteria of Broknes Peninsula of Larsemann Hills, East Antarctica. Cryptogamie, Algologie, 2021, 42(15), 241-251.
[23] Kemka, N., Njine, T., Zebaze, T. S. H., Niyitegeta, D., Nola, M., Monkiedje, A., Demanou, J., Menbohan, F. S. Phytoplankton of the Yaounde Municipal Lake: ecological succession and stand structure. Journal of Water Science, 2004, 17(3), 301-316.
[24] Aurousseau, P. Evaluation of the impact of rivers on eutrophication in the coastal strip: need to reason about concentrations and fluxes. Biotechnology and Agronomy Societies Environnement, 2013, 17(1), 271-276.
[25] Groga, N. Structure, functioning and dynamic of phytoplankton in the Ta'abo Lake (Ivory Coast). Doctorat Thesis, University of Toulouse: France, 2012, pp. 15-224.
[26] Sana’a, B. Structure, dynamics and physicochemical and phytoplanktonic typologies of the Bou Regreg estuary (Moroccan Atlantic coast). PhD Thesis, Mohammed V University-Agdal, Faculty of Science: Morocco, 2006, pp. 1-89.
Cite This Article
  • APA Style

    Parfait, N. G., Fosah, M. R., Teke, A. N., Fridolin, C. T. (2024). Diversity of Cyanobacteria in Some Polluted Wetlands of Nkwen in Bamenda (North-West, Cameroon). Frontiers, 4(2), 42-54. https://doi.org/10.11648/j.frontiers.20240402.11

    Copy | Download

    ACS Style

    Parfait, N. G.; Fosah, M. R.; Teke, A. N.; Fridolin, C. T. Diversity of Cyanobacteria in Some Polluted Wetlands of Nkwen in Bamenda (North-West, Cameroon). Frontiers. 2024, 4(2), 42-54. doi: 10.11648/j.frontiers.20240402.11

    Copy | Download

    AMA Style

    Parfait NG, Fosah MR, Teke AN, Fridolin CT. Diversity of Cyanobacteria in Some Polluted Wetlands of Nkwen in Bamenda (North-West, Cameroon). Frontiers. 2024;4(2):42-54. doi: 10.11648/j.frontiers.20240402.11

    Copy | Download

  • @article{10.11648/j.frontiers.20240402.11,
      author = {Ndjouondo Gildas Parfait and Muyang Rosaline Fosah and Ache Neh Teke and Choula Tegantchouang Fridolin},
      title = {Diversity of Cyanobacteria in Some Polluted Wetlands of Nkwen in Bamenda (North-West, Cameroon)
    },
      journal = {Frontiers},
      volume = {4},
      number = {2},
      pages = {42-54},
      doi = {10.11648/j.frontiers.20240402.11},
      url = {https://doi.org/10.11648/j.frontiers.20240402.11},
      eprint = {https://article.sciencepublishinggroup.com/pdf/10.11648.j.frontiers.20240402.11},
      abstract = {Human activities more and more intensify the pollution of aquatic ecosystems. These pollutants lead to some Cyanobacteria proliferation causing “blooms” or “efflorescence” and disappearance of sensitive species. The aim of the study was to determine the composition and variation of Cyanobacteria community in some polluted wetlands of Nkwen in Bamenda. Sampling of Cyanobacteria took place from October 2022 to September 2023 by using plankton net for phytoplankton and scrubbing for periphyton. Some hydromorphological and physicochemical parameters of water were measured in situ and in the laboratory. Results showed that species richness of microalgae amounted to 11 families divided into 22 genera and 46 species. Oscillatoriaceae constituted the most important family (26.66% with 12 species) of the Cyanobacteria community, in the study sites. Shannon-Weaver’s index was weak and varied between 1.24 (site 6) and 2.65 (site 2). These results showed that wetlands of Nkwen had a Cyanobacteria community more abundant where the water velocity is low, with high nitrates and phosphates contents. Different Cyanobacteria families with strong proliferation in polluted waters (sites 1, 2 and 3) were: Oscillatoriaceae, Gloeotrichiaceae, Rivulariaceae, Nostocaceae, Merismopediaceae, Microcoleaceae, Microcystaceae and Tolypotrichaceae. On the other hand, the families abundantly present in less polluted waters (sites 4, 5 and 6) were: Chroococcaceae, Pseudanabaenaceae and Aphanizomenonaceae. Thus, physicochemical parameters have an influence on the composition and structure of Cyanobacteria community in wetlands of Nkwen in Bamenda. Monitoring, based on biological indices of Cyanobacteria, could be developed to prevent the risks of perturbation of these wetlands.
    },
     year = {2024}
    }
    

    Copy | Download

  • TY  - JOUR
    T1  - Diversity of Cyanobacteria in Some Polluted Wetlands of Nkwen in Bamenda (North-West, Cameroon)
    
    AU  - Ndjouondo Gildas Parfait
    AU  - Muyang Rosaline Fosah
    AU  - Ache Neh Teke
    AU  - Choula Tegantchouang Fridolin
    Y1  - 2024/06/06
    PY  - 2024
    N1  - https://doi.org/10.11648/j.frontiers.20240402.11
    DO  - 10.11648/j.frontiers.20240402.11
    T2  - Frontiers
    JF  - Frontiers
    JO  - Frontiers
    SP  - 42
    EP  - 54
    PB  - Science Publishing Group
    SN  - 2994-7197
    UR  - https://doi.org/10.11648/j.frontiers.20240402.11
    AB  - Human activities more and more intensify the pollution of aquatic ecosystems. These pollutants lead to some Cyanobacteria proliferation causing “blooms” or “efflorescence” and disappearance of sensitive species. The aim of the study was to determine the composition and variation of Cyanobacteria community in some polluted wetlands of Nkwen in Bamenda. Sampling of Cyanobacteria took place from October 2022 to September 2023 by using plankton net for phytoplankton and scrubbing for periphyton. Some hydromorphological and physicochemical parameters of water were measured in situ and in the laboratory. Results showed that species richness of microalgae amounted to 11 families divided into 22 genera and 46 species. Oscillatoriaceae constituted the most important family (26.66% with 12 species) of the Cyanobacteria community, in the study sites. Shannon-Weaver’s index was weak and varied between 1.24 (site 6) and 2.65 (site 2). These results showed that wetlands of Nkwen had a Cyanobacteria community more abundant where the water velocity is low, with high nitrates and phosphates contents. Different Cyanobacteria families with strong proliferation in polluted waters (sites 1, 2 and 3) were: Oscillatoriaceae, Gloeotrichiaceae, Rivulariaceae, Nostocaceae, Merismopediaceae, Microcoleaceae, Microcystaceae and Tolypotrichaceae. On the other hand, the families abundantly present in less polluted waters (sites 4, 5 and 6) were: Chroococcaceae, Pseudanabaenaceae and Aphanizomenonaceae. Thus, physicochemical parameters have an influence on the composition and structure of Cyanobacteria community in wetlands of Nkwen in Bamenda. Monitoring, based on biological indices of Cyanobacteria, could be developed to prevent the risks of perturbation of these wetlands.
    
    VL  - 4
    IS  - 2
    ER  - 

    Copy | Download

Author Information
  • Abstract
  • Keywords
  • Document Sections

    1. 1. Introduction
    2. 2. Materials and Methods
    3. 3. Results
    4. 4. Discussion
    5. 5. Conclusion
    Show Full Outline
  • Conflicts of Interest
  • References
  • Cite This Article
  • Author Information