Research Article | | Peer-Reviewed

Community Structures of On-Farm Tree Species in Budaka Sub-County, Budaka District, Eastern Uganda

Received: 4 February 2024     Accepted: 26 February 2024     Published: 15 August 2024
Views:       Downloads:
Abstract

Tree species population composition and diversity refers to the variety of tree species and their relative abundance in an ecosystem. In most tropical agro-ecosystems where land cover changes are faster than natural restoration, tree species composition, distribution, richness and diversity and the services provided by them are particularly susceptible to change globally from continuous stress factors such as bushfires, logging and cultivation. Data for the study was obtained from trees inventory using a systematic random sampling technique. A quadrant measuring 25m x 25m was laid. A total of sixty quadrants were used in the study. Each quadrant was demarcated using a measuring tape and its boundaries marked using pegs. All tree species encountered in each quadrant were identified and recorded. The unidentified specimens were collected, pressed and taken to Makerere University herbarium for proper identification. The results from the study revealed a total of 28 tree species belonging to 16 families were documented as being used by people in the four surveyed villages of Budaka Sub County, where Family Moraceae had the highest number of tree species with no significance difference in the density, diversity, richness, evenness, poles, saplings and seedlings of tree species across the four villages (Kruskal-Wallis P< 0.05). This indicates that these trees are under threat in the study area. This situation is quite alarming and calls for more resourceful and sustainable management and conservation techniques. Among others, it is suggested that laws should be enacted to protect the resource from further timber and fuel wood exploitation in the area in order to allow it to regenerate fully.

Published in Ecology and Evolutionary Biology (Volume 9, Issue 3)
DOI 10.11648/j.eeb.20240903.12
Page(s) 83-90
Creative Commons

This is an Open Access article, distributed under the terms of the Creative Commons Attribution 4.0 International License (http://creativecommons.org/licenses/by/4.0/), which permits unrestricted use, distribution and reproduction in any medium or format, provided the original work is properly cited.

Copyright

Copyright © The Author(s), 2024. Published by Science Publishing Group

Keywords

Trees Species, Composition, Diversity, Richness and Evenness

1. Introduction
Tree species population composition and diversity refers to the variety of tree species and their relative abundance in an ecosystem . Plants such as trees form a critical base in the provision of ecosystem services like the provision of food, recreational and spiritual values to humans. Though a large number of plant species are involved in ecosystem processes, their complex interactions make it difficult to draw general conclusions on their contributions. However, a consensus is emerging that both species diversity and community composition are important for ecosystem functioning . In most tropical agro-ecosystems where land cover changes are faster than natural restoration, tree species composition, distribution, richness and diversity and the services provided by them are particularly susceptible to change globally from continuous stress factors such as bushfires, logging and cultivation . Species richness promotes ecosystem sustainability and services such as the provision of food, climate regulation, soil formation, prevention of soil erosion, reduction in soil and nutrient loss, and maintenance of hydrological cycles . In Uganda, tree species contribute significantly to the country’s economy and account for 5.2% of Gross Domestic Product (GDP) contributed in terms of income, taxes and employment for about 20,000 people , further emphasizes that about 90% of the Ugandan population depends on fuel wood as a primary source of energy. USAID, 2006 also reported that over one million people in Uganda earn their income from tree species through agroforestry, tourism and selling products like timber, charcoal, firewood, crafts and fruits. In Budaka sub-county, Budaka District, trees on household farms and forests are cut down for timber, firewood, and poles for as well as construction purposes with the preponderance of wetlands dried, poor afforestation and reafforestation management that leads a significant number of trees in the sub-county harvested . The current global attention on the conservation and sustainability of biodiversity that led to many different treaties particularly in the tropical area is a consequence of the threat posed by overexploitation. This might lead to depletion of such trees if allowed to go on unchecked resulting also in the elimination of other flora or fauna which depend on such trees for survival . Therefore, tree species composition studies in Budaka Sub County are therefore extremely important in the context of understanding the extent of plant diversity and the services provided by them in various ecosystems .
2. Materials and Methods
2.1. Study Area
The community generally are subsistence farmers belonging to the Gwere ethnic group and the main language spoken is Lugwere. Other languages include Lusoga and Lunyole. The main cash crops are coffee and cotton. Fruit and vegetable growing are also common, with tomatoes, onions, carrots and cabbage .
2.2. Location
Budaka Sub County is located in Budaka District, Eastern Uganda. The District is bordered by Pallisa District in the north, Mbale District in the east, Butaleja District in the south and Kibuku District in the west. Budaka Sub County is bordered by Nansanga and Lyama Sub Counties in the south, Budaka town council in the east, Kakule and Kaderuna Sub Counties in the north. The Sub County is approximately 36 kilometres from Mbale, the largest town in the sub-region; and approximately 212 kilometres from Kampala, the capital city of Uganda. The coordinates of Budaka Sub County are 01 01 00N, 33 56 42E (Latitude: 1.0150; Longitude: 33.9450) at an elevation of 1,220. metres above sea level and it’s divided into four parishes: Sapiri, Nampangala, Chaali and Gadumire parish.
2.3. Climate
The district has a sub-humid climate with a bimodal rainfall with first rains starting in early April-July while the second season starting in September- November. The total annual rainfall ranges between 1,130 mm and 1,720 mm, temperature ranges between 16.2 and 28.7 degrees Celsius and the relative humidity ranges between 52 per cent and 89 per cent .
2.4. Soils
Budaka Sub County has two dominant soil types. These include ferralitic and hydromorphic. The dominant soil in the ferralitic type is reddish brown and sandy-loam and loams on the laterite. They are acidic with PH value below 5, deficient in available phosphorus and all the major exchangeable bases. They are good for sorghum, millet, groundnut, cassava and pigeon pea cultivation. Hydromorphic soils are common in areas occupied by permanent wetlands characterised by water logging.
2.5. Vegetation
Savannah grass is the most dominant vegetation type in the Sub County. In some parts of the Sub County, there is a mixture of forest remnant and incoming savannah trees, and a grass layer dominated by Pennisetum perversion. Swamp vegetation is very common in wetland areas where paddy rice is cultivated. The sub county does not have well gazetted forest reserves except tree plantations at the household level. Mvule tree which was very common has been over exploited to the extent that very few exist. The vegetation of the Sub County has been generally encroached on and affected by human activities such as tree cutting, animal grazing, over cultivation and infrastructural development.
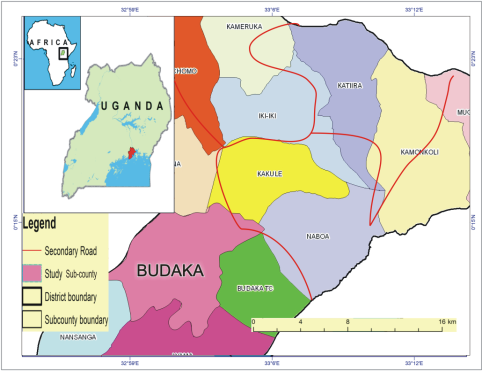
Figure 1. Location of Budaka Sub County in Budaka District, Eastern Uganda.
2.6. Field Survey
Before the commencement of data collection, permission was obtained from the Chief District administrative officer (CAO), District Natural Resources Officer and the Sub County Chief by an introductory letter from the Dean of the Faculty of Science, Islamic University, Uganda. Budaka Sub County comprises four parishes: Sapiri, Nampangala, Chaali and Gadumire. However, data for this study was collected from two parishes namely Sapiri and Nampangala; and specifically, from two villages of each parish that were randomly selected. The four villages from the two parishes were Nansekese, Sapiri, Nampangala and Nawango. One research assistant and a Parish Chief from each of the two parishes were hired as lead persons to help in language interpretation during data collection. Ethical conduct was ensured by following the principles contained in the Code of Ethics of the International Society of Ethnobiology . A pilot testing lasted for only one week conducted at the beginning of the study and key informants were also identified with the help of the local assistants and community.
2.7. Determination of Tree Species Community Structure
A quadrant method was used to collect data on tree species composition and diversity (ecological status). In each household, farms were selected by systematic random sampling technique, a quadrant measuring 25m x 25m was laid. A total of sixty quadrants were used in the study. Each quadrant was demarcated using a measuring tape and its boundaries marked using pegs. All tree species encountered in each quadrant were identified and recorded. The unidentified specimens were collected, pressed and taken to Makerere University herbarium for proper identification while the verification was done using the database at www.planlist.org. The on-farm tree specimens were collected according to the standard practice, including leaves, flowers and fruits where possible . Similarly, regenerative individuals such as seedlings, saplings and poles of each tree species per quadrant were counted. The girths of the trees at 1.3 meters from the ground level (Diameter at Breast Height) were measured by use of a measuring tape and recorded. Tree species density per hectare was determined; the diversity, richness and evenness were also determined using Shannon Weiner index which is calculated using the formula shown below:
H'=-i=1spilnln pi (1)
Where i, is the proportion of the species relative to the total number of species (pi) multiplied by the natural logarithm of this proportion (ln pi) and the final product multiplied by -1.
Species richness, the number of species present in an ecosystem (S) was defined by:
S=n(2)
Where n is the number of species in a community.
Species evenness, the proportion of individuals among species in an ecosystem is often assessed by Shannon's equitability index (H'E) which is calculated by:
H'E = H' / Hmax(3)
Where Hmax is defined as ln S. H'E values range from 0 to 1 and 1 indicates complete evenness.
While the DBH (Diameter at breast height) was calculated using =Girth3.142
2.8. Data Analysis
All the data obtained from the field on tree species population and structure were entered in Microsoft Office Excel spreadsheets, checked for errors, and edited. Tree species diversity, richness and evenness were computed using Microsoft Office Excel version 2010. The variability of tree species diversity, evenness and richness across the parishes was analyzed by Kruska- Wallis test at p ≤ 0.05 level of significance. Similarly, information obtained from the International Plant Index and www.plantzafrica.org was used to validate the documented species and to establish their families.
3. Result and Discussions
On Farm Tree Species Composition in Budaka Sub County
A total of 28 tree species belonging to 16 families were documented as being used by people in the four surveyed villages of Budaka Sub County. Family Moraceae had the highest number of tree species. This is a family of tree species such as Artocarpus heterophyllus, Ficus natalensis, Ficus platyphylla and Ficus sur. The dominance of the family Moraceae, was due to the high presence of Artocarpus heterophyllus that might be attributed to its several uses. The fruits of this tree can be consumed at household level, sold to generate income and its branches are cut and used for firewood. This observation agrees with that of , that some trees have single uses e.g. used as food while others have multiple uses for example, used as firewood, food, charcoal, etc. The family with the second highest number of trees was Ceasalpinniaceae followed by Meliaceae, Anarcadiaceae, Mimosaceae and Bignoniaceae; while the family with least number of trees was Annonaceae followed by Combretaceae and Pinnaceae. Family Annonaceae has tree species that have single uses such as producing edible fruits while Combretaceae and Pinnaceae have trees used for timber production.
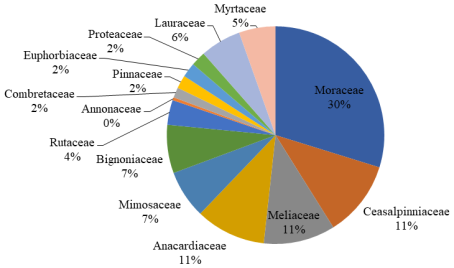
Figure 2. Families of the On-Farm Tree Species Documented in Budaka Sub County.
Table 1. Name of Tree Species, Abundance and their Density per Hectare.

Botanical name

Family name

Abundance

Density h-1

Ablizia coriariaOlive

Mimosaceae

29

464

Albizi azygia

Mimosaceae

4

64

Aleurites moluccanusL

Euphorbiaceae

5

80

Annona muricata

Annonaceae

2

32

Artocarpus heterophyllusLam

Moraceae

35

560

Azadirachta indica

Meliaceae

4

64

Citrus sinensis

Rutaceae

17

272

Combretum collinum Fresen

Combretaceae

5

80

Entandophragma angolense

Meliaceae

16

256

Eucalyptus grandis W. Hill

Myrtaceae

18

288

Ficus natalensis

Moraceae

29

464

Ficus platyphylla

Moraceae

11

176

Ficus sur

Moraceae

25

400

Greveria robusta A.cunn

Proteaceae

10

160

Grewia mollis

Tiliaceae

5

80

Jatropha curcas

Euphorbiaceae

5

80

Khaya anthoteca Welw

Meliaceae

1

16

Mangifera indicaL

Anacardiaceae

48

768

Makharmia lutea (Benth)

Bignoniaceae

33

528

Melia azadirach

Meliaceae

28

448

Milicia excelsa

Moraceae

37

592

Persia Americana Mill

Lauraceae

28

448

Piliostigma thoningii Schum

Fabaceae

4

64

Pinus patula

Pinnaceae

9

144

Psidium guajava

Myrtaceae

7

112

Senna siamea

Ceasalpinniacea

44

704

Tamarindus indica

Ceasalpinniacea

8

128

Terminallia spp

Combretaceae

7

112

Source: Survey 2020
3.1. On Farm Tree Species Diversity, Richness and Evenness
Tree species diversity in the four villages selected for the study area was higher in Nansekese village followed by Nampangala, Nawango and Sapiri, with mean values of 2.97±1.3, 2.90±1.3, 2.82±1.4 and 2.65±1.3 respectively. However, the overall diversity is not significantly different at Kruskal-Wallis (P< 0.05). The lower tree species diversity in Nawango and Sapiri could be as a result of high intensity of logging that affects species diversity. While the higher diversity in Nansekese and Nampangala may be as a result of optimum utilization and conservation of tree species in the villages. This finding agrees with the report of , that lower and higher diversity of tree species in an ecosystem could be due to intensity of logging or optimum utilization of the plant resources and their conservation by the surrounding communities.
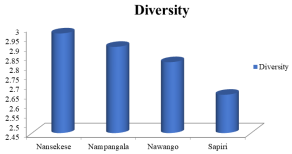
Figure 3. The Diversity of Species Across the Study Area.
3.2. On Farm Tree Species Richness
Tree species richness was higher in Nansekese village followed by Nampangala, Nawango and Sapiri, with mean a value of 26±4.6, 25±4.4, 23±4.7 and 17±4.2 respectively. However, the overall richness is not significantly different at Kruskal-Wallis (P< 0.05). The lower tree species richness in Sapiri and Nawango could be as a result of high utilization pressure that alters species richness. While the higher richness in Nansekese and Nampangala could be as a result of high abundance of tree species compared to other villages. This finding agrees with the report of , that the richness of tree species in an area is due to their relative variety and abundance in an ecosystem.
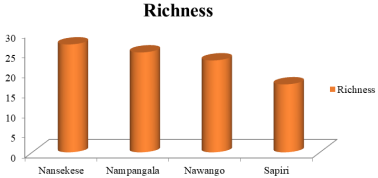
Figure 4. The Richness of Species Across the Study Area.
3.3. On Farm Tree Species Evenness
Tree species evenness was higher in Sapiri, Nansekese, Nampangala and Nawango, with a mean value of 0.94±0.9, 0.91±0.8, and 0.90±0.9, 0.89±0.9 respectively since complete evenness start from the value of 1.0 as stated by but not significantly different at (Kruskal-Wallis P< 0.05) across the four villages under study. The higher high evenness in Sapiri may be attributed to the lower species richness. The result shows complete evenness since the value is close to 1 except in Nawango. This finding agrees with the report of . that tree species evenness is due to their variety and relative abundance in an ecosystem.
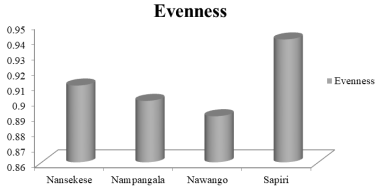
Figure 5. The Evenness of Species Across the Study Area.
Poles are regenerating tree of 4 – 10 DBH (Diameter at Breast Height) and it is clear that the presence of poles in an area mark the possibility of future tree species which are higher in Nawango followed by Nampangala and Nansekese than Sapiri village respectively but not significantly different at Kruskal-Wallis (P< 0.05) across the four villages. This means that more trees will be found in Nawango and Sapiri than in corresponding villages in future. The presence of a higher number of poles in these villages could be attributed to the communities in the area practicing afforestation.
Saplings are regenerating trees of 2 - 4 DBH (Diameter at Breast Height) below pole size and it shows the possibility of having more younger trees in future, which are higher in Sapiri followed by Nansekese, Nampangala and Nawango respectively but it is significantly different at Kruskal-Wallis (P< 0.05) across the four villages. This means that more young trees can be found in Sapiri and Nansekese than the corresponding villages. The least number of saplings in Nawango and Nampangala may be due to cutting down young trees for firewood.
Seedlings is a young developing plant that has been grown from the seed which are higher in Sapiri followed by Nansekese, Nampangala and Nawangorespectively but not significantly different at Kruskal-Wallis (P< 0.05) across the four villages. This means that more young trees can be found in Sapiri and Nansekese than the corresponding villages, the least number of seedlings in Nawango and Nampangala may be due to the presence of heat resulting from the charcoal kilns which alter seedlings composition in an area. This finding agrees with who stated that high fire frequencies kill seedlings and saplings of fire-sensitive species, prevent seedlings and saplings from growing into the over-story, and slowly kill overstory trees, thereby limiting overstory tree species composition to highly fire-resistant species.
Diameter at breast height is a measure that gives an indication of the size and merchantability of trees depending on the uses to determine the number of timber or bags of charcoal produced per tree species. Below are the diameters at breast height of some selected tree species such as Mangifera indica, Ficus natalensis and Senna siamea across the four villages of Budaka Sub County.
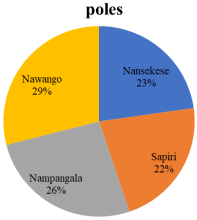
Figure 6. Distribution of Poles Across the Study Area.
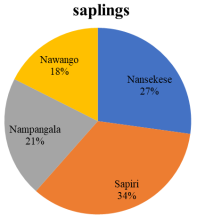
Figure 7. Distribution of Saplings Across the Study Area.
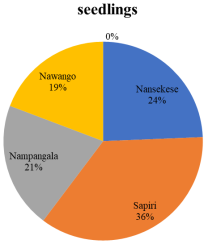
Figure 8. Distribution of Seedlings Across the Study Area.
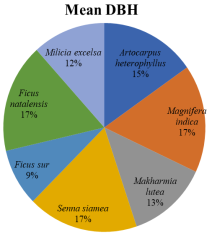
Figure 9. Mean Diameter at Breast Height of Some Selected Trees.
4. Conclusion
The study conducted in Budaka District revealed a total of 28 tree species belonging to 16 families were documented as being used by people in the four surveyed villages of Budaka Sub County. Family Moraceae had the highest number of tree species. The low number of these species is an evidence of the degree of degradation of trees that has been subjected to logging and anthropogenic activities. This calls for an urgent solution so as not to drive some of these tree species particularly those already threatened into extinction. It is therefore suggested that afforestation and re-afforestation programmes should be mandated in the area and the remaining on-farm trees should be protected from further exploitation to give it enough time to regenerate itself by enforcing laws of conservation strictly in the study area.
Abbreviations

DBH

Diameter at Breast Height

Conflicts of Interest
The authors declare no conflicts of interest.
References
[1] Addo-Fordjour, P. and Alexander, A. (2009). “Floristic Composition, Structure and Natural Regeneration in A Moist Semi-Deciduous Forest Following Anthropogenic Disturbances and Plant Invasion”. In: Int. J. Biodvers. Conserv. 1(2): 021–037.
[2] Brown K. and Gurevitch J. (2004). Long-Term Impacts of Logging on Forest Diversity in Madagascar. Proceedings of the National Academy of Sciences of the United States of America (PNAS). 101(16): 6045-6049.
[3] Budaka Local Government District. Budaka Sub-County (2007). The 5 years Investment Plan for 2010/2011- 2014/2015 1-5.
[4] Gary, J. (1995). Ethnobotany. A Methods Manual. McGrow Hill.
[5] Hooper, D. U., Chapin, F. S., Ewel, J. J., Hector, A., Inchausti, P., Lavorel, S., Lawton, J. H., Lodge, D. M., Loreau, M., Naeem, S., Schmid, B., Setala, H., Symstad, A. J., Vandermeer, J. and Wardle, D. A. (2005). Effect of Biodiversity on Ecosystem Functioning: A Consensus of Current Knowledge, Ecological Monograms, 75: 3-35.
[6] Ihenyen J., Okoegwae E. and Mensah J. K. (2009). Composition of Tree Species in Ehor Forest Reserve, Edo State Nigeria. Journal of nature science 7(8): 8-18.
[7] International Plant Index: (2012). [
[8] International Society of Ethnobiology: ISE Code of Ethics (2009).
[9] Magurran, A. (2004). Measuring Biological Diversity. Blackwell Science Ltd, A Blackwell publishing company.
[10] Maroyi A. Semenya S. (2012). Medicinal Plants Used by The Bapedi Traditional Healers to Treat Diarrhoea in The Limpopo Province, South Africa. In: Journal of Ethnopharmacol 144: 395–401.
[11] National Forestry Authority (2005). Strategic Direction for Management of Natural Forests in Central Forest Reserves. National Forestry Authority, Kampala, Uganda.
[12] Peterson, D. and Reich, P. (2001). Prescribed Fire in Oak Savannah: Fire Frequency Effects on Stand Structure and Dynamics. Ecol Appl 11, 914–927.
[13] Spiegelberger T., Matthies, D., Heinz, M. S. and Schaffner, U. (2006). Scale Dependent Effect of Land Use on Plant Specie Richness on Mountain Grassland in the European Alps – Ecography 29: 541-548.
[14] United State Agency for International Development. (2006). Uganda Biodiversity and tropical forest assessment report. International Resources Group 1211 Connecticut Avenue, NW, Suite 700 Washington, DC 20036.
[15] Young, S. and Swiachi, N. (2006). Surveying the Forest Biodiversity of Evansburg State Park: Plant Community Classification and Species Diversity Assessment. International Journal of Botany 2(3).
[16] Ziqian, T., Chen, W., Zhao. C., Chen. Y. and Zheng. B. (2007). Plant Biodiversity and its Conservation Strategy in the Inundation and Resettlement Districts of the Yangtze Three Gorges, China. Acta Ecologica Sinica Volume 27, Issue 8, August 2007.
Cite This Article
  • APA Style

    Shafiu, A. I., Tambari, U., Gobir, Y. S., Dharmendra, S., Naka, K. J., et al. (2024). Community Structures of On-Farm Tree Species in Budaka Sub-County, Budaka District, Eastern Uganda. Ecology and Evolutionary Biology, 9(3), 83-90. https://doi.org/10.11648/j.eeb.20240903.12

    Copy | Download

    ACS Style

    Shafiu, A. I.; Tambari, U.; Gobir, Y. S.; Dharmendra, S.; Naka, K. J., et al. Community Structures of On-Farm Tree Species in Budaka Sub-County, Budaka District, Eastern Uganda. Ecol. Evol. Biol. 2024, 9(3), 83-90. doi: 10.11648/j.eeb.20240903.12

    Copy | Download

    AMA Style

    Shafiu AI, Tambari U, Gobir YS, Dharmendra S, Naka KJ, et al. Community Structures of On-Farm Tree Species in Budaka Sub-County, Budaka District, Eastern Uganda. Ecol Evol Biol. 2024;9(3):83-90. doi: 10.11648/j.eeb.20240903.12

    Copy | Download

  • @article{10.11648/j.eeb.20240903.12,
      author = {Adili Ismaila Shafiu and Umar Tambari and Yusuf Sarkin Gobir and Singh Dharmendra and Keta Jibrin Naka and Mustapha Shehu Wurno and Sadiya Aliyu Waziri},
      title = {Community Structures of On-Farm Tree Species in Budaka Sub-County, Budaka District, Eastern Uganda
    },
      journal = {Ecology and Evolutionary Biology},
      volume = {9},
      number = {3},
      pages = {83-90},
      doi = {10.11648/j.eeb.20240903.12},
      url = {https://doi.org/10.11648/j.eeb.20240903.12},
      eprint = {https://article.sciencepublishinggroup.com/pdf/10.11648.j.eeb.20240903.12},
      abstract = {Tree species population composition and diversity refers to the variety of tree species and their relative abundance in an ecosystem. In most tropical agro-ecosystems where land cover changes are faster than natural restoration, tree species composition, distribution, richness and diversity and the services provided by them are particularly susceptible to change globally from continuous stress factors such as bushfires, logging and cultivation. Data for the study was obtained from trees inventory using a systematic random sampling technique. A quadrant measuring 25m x 25m was laid. A total of sixty quadrants were used in the study. Each quadrant was demarcated using a measuring tape and its boundaries marked using pegs. All tree species encountered in each quadrant were identified and recorded. The unidentified specimens were collected, pressed and taken to Makerere University herbarium for proper identification. The results from the study revealed a total of 28 tree species belonging to 16 families were documented as being used by people in the four surveyed villages of Budaka Sub County, where Family Moraceae had the highest number of tree species with no significance difference in the density, diversity, richness, evenness, poles, saplings and seedlings of tree species across the four villages (Kruskal-Wallis P< 0.05). This indicates that these trees are under threat in the study area. This situation is quite alarming and calls for more resourceful and sustainable management and conservation techniques. Among others, it is suggested that laws should be enacted to protect the resource from further timber and fuel wood exploitation in the area in order to allow it to regenerate fully.
    },
     year = {2024}
    }
    

    Copy | Download

  • TY  - JOUR
    T1  - Community Structures of On-Farm Tree Species in Budaka Sub-County, Budaka District, Eastern Uganda
    
    AU  - Adili Ismaila Shafiu
    AU  - Umar Tambari
    AU  - Yusuf Sarkin Gobir
    AU  - Singh Dharmendra
    AU  - Keta Jibrin Naka
    AU  - Mustapha Shehu Wurno
    AU  - Sadiya Aliyu Waziri
    Y1  - 2024/08/15
    PY  - 2024
    N1  - https://doi.org/10.11648/j.eeb.20240903.12
    DO  - 10.11648/j.eeb.20240903.12
    T2  - Ecology and Evolutionary Biology
    JF  - Ecology and Evolutionary Biology
    JO  - Ecology and Evolutionary Biology
    SP  - 83
    EP  - 90
    PB  - Science Publishing Group
    SN  - 2575-3762
    UR  - https://doi.org/10.11648/j.eeb.20240903.12
    AB  - Tree species population composition and diversity refers to the variety of tree species and their relative abundance in an ecosystem. In most tropical agro-ecosystems where land cover changes are faster than natural restoration, tree species composition, distribution, richness and diversity and the services provided by them are particularly susceptible to change globally from continuous stress factors such as bushfires, logging and cultivation. Data for the study was obtained from trees inventory using a systematic random sampling technique. A quadrant measuring 25m x 25m was laid. A total of sixty quadrants were used in the study. Each quadrant was demarcated using a measuring tape and its boundaries marked using pegs. All tree species encountered in each quadrant were identified and recorded. The unidentified specimens were collected, pressed and taken to Makerere University herbarium for proper identification. The results from the study revealed a total of 28 tree species belonging to 16 families were documented as being used by people in the four surveyed villages of Budaka Sub County, where Family Moraceae had the highest number of tree species with no significance difference in the density, diversity, richness, evenness, poles, saplings and seedlings of tree species across the four villages (Kruskal-Wallis P< 0.05). This indicates that these trees are under threat in the study area. This situation is quite alarming and calls for more resourceful and sustainable management and conservation techniques. Among others, it is suggested that laws should be enacted to protect the resource from further timber and fuel wood exploitation in the area in order to allow it to regenerate fully.
    
    VL  - 9
    IS  - 3
    ER  - 

    Copy | Download

Author Information
  • Department of Environmental Science, Shehu Shagari University of Education, Sokoto, Nigeria

  • Department of Environmental Science, Shehu Shagari University of Education, Sokoto, Nigeria

  • Department of Environmental Science, Shehu Shagari University of Education, Sokoto, Nigeria

  • Department of Plant Science and Biotechnology, Kebbi State University of Science and Techn, Aliero, Nigeria

  • Department of Plant Science and Biotechnology, Kebbi State University of Science and Techn, Aliero, Nigeria

  • Department of Forestry Technology, College of Agriculture and Animal Science Wurno Sokoto, Nigeria

  • Department of Chemical Science, University Sains Malaysia, Palau Penang

  • Abstract
  • Keywords
  • Document Sections

    1. 1. Introduction
    2. 2. Materials and Methods
    3. 3. Result and Discussions
    4. 4. Conclusion
    Show Full Outline
  • Abbreviations
  • Conflicts of Interest
  • References
  • Cite This Article
  • Author Information