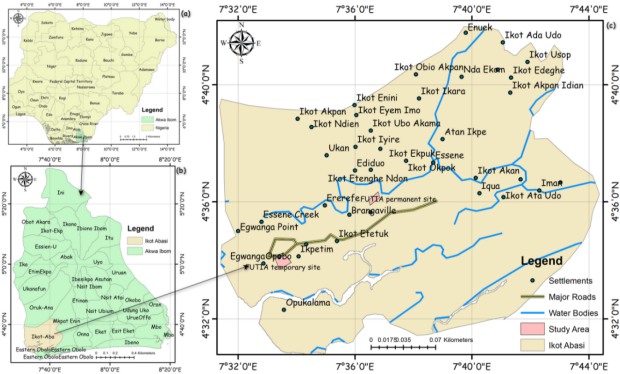
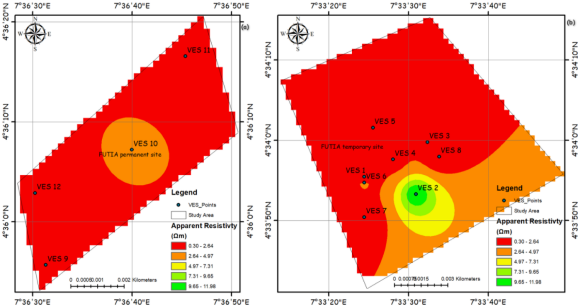
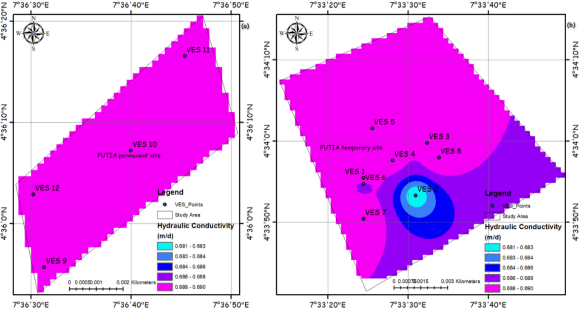
Groundwater demand in Nigeria’s coastal regions is rising, yet subsurface assessment is complicated by heterogeneous sediments and tidal influences. This study applies an integrated approach combining 2D Electrical Resistivity Tomography (ERT), Vertical Electrical Sounding (VES), Geographic Information Systems (GIS), and remote sensing to delineate aquifer zones and assess groundwater quality in Ikot Abasi, Akwa Ibom State. ERT data were collected along three 200 m profiles using a Wenner-Schlumberger array and inverted with Res2Dinv. Twelve VES points provided complementary hydrogeological parameters including transmissivity and hydraulic conductivity. GIS and remote sensing datasets (SRTM DEM, Sentinel-2 imagery, drainage networks, and land cover maps) were used to georeference profiles, analyze terrain influence, and correlate resistivity anomalies with geomorphology. Results revealed three main subsurface units: shallow conductive clayey horizons (<50 Ωm), intermediate silty sands (80-800 Ωm), and deeper resistive aquifer zones (>1000 Ωm) with transmissivity up to 65 m2/d. Water quality analyses showed most parameters within WHO standards, although elevated calcium, magnesium, and iron suggest geogenic enrichment from ferruginous sands. The study demonstrates that integrating ERT with GIS and remote sensing improves interpretation of aquifer distribution and groundwater quality in complex deltaic settings. This multidisciplinary workflow provides a more reliable basis for groundwater development and sustainable resource management in Nigeria’s coastal sedimentary terrains.
| Published in | Earth Sciences (Volume 14, Issue 5) |
| DOI | 10.11648/j.earth.20251405.13 |
| Page(s) | 196-205 |
| Creative Commons |
This is an Open Access article, distributed under the terms of the Creative Commons Attribution 4.0 International License (http://creativecommons.org/licenses/by/4.0/), which permits unrestricted use, distribution and reproduction in any medium or format, provided the original work is properly cited. |
| Copyright |
Copyright © The Author(s), 2025. Published by Science Publishing Group |
2D Electrical Resistivity Tomography (ERT), Coastal Sedimentary Terrain, GIS, Python Geophysics Remote Sensing, Subsurface Characterization
VES Poitns | Apparent Resistivity (Ωm) | Depth (m) | Thickness (m) | Longitudinal Conductance (Ω-1) | Transverse Resistance (Ω·m2) | Hydraulic Conductivity (m/d) | Transmissivity (m2/d) |
|---|---|---|---|---|---|---|---|
VES 1 | 0.497 | 39.500 | 25.400 | 51.107 | 12.624 | 0.691 | 17.545 |
VES 2 | 12.000 | 50.100 | 43.300 | 3.608 | 519.600 | 0.681 | 29.466 |
VES 3 | 1.930 | 109.000 | 95.200 | 49.326 | 183.736 | 0.689 | 65.637 |
VES 4 | 1.480 | 89.600 | 72.200 | 48.784 | 106.856 | 0.690 | 49.809 |
VES 5 | 1.030 | 63.800 | 58.400 | 56.699 | 60.152 | 0.690 | 40.312 |
VES 6 | 3.310 | 49.100 | 24.700 | 7.462 | 81.757 | 0.688 | 16.999 |
VES 7 | 0.263 | 78.400 | 71.100 | 270.342 | 18.699 | 0.691 | 49.128 |
VES 8 | 0.752 | 47.200 | 40.400 | 53.723 | 30.381 | 0.691 | 27.897 |
VES 9 | 2.000 | 58.900 | 47.000 | 23.500 | 94.000 | 0.689 | 32.402 |
VES 10 | 2.940 | 90.800 | 79.700 | 27.109 | 234.318 | 0.689 | 54.878 |
VES 11 | 1.480 | 105.000 | 98.500 | 66.554 | 145.780 | 0.690 | 67.952 |
VES 12 | 1.330 | 113.000 | 96.900 | 72.857 | 128.877 | 0.690 | 66.862 |
S/N | Parameters | A | B | C | D | E | WHO (2017) |
|---|---|---|---|---|---|---|---|
1 | pH | 6.16 | 6.81 | 6.37 | 7.10 | 6.82 | 6.50 - 8.50 |
2 | Electrical conductivity (μs/cm) | 257.00 | 34.70 | 45.70 | 109.00 | 89.50 | 500.00 |
3 | TDS (mg/L) | 168.00 | 18.80 | 23.20 | 77.60 | 46.60 | 500.00 |
4 | Alkalinity (mg/L) | 45.00 | 30.00 | 35.00 | 35.00 | 20.00 | 200.00 |
5 | DO (mg/L) | 3.20 | 3.00 | 3.10 | 3.20 | 3.00 | - |
6 | BOD (mg/L) | 2.64 | 2.82 | 2.42 | 2.18 | 2.62 | 2.00 |
7 | COD (mg/L) | 5.48 | 5.64 | 4.84 | 4.36 | 5.24 | 10.00 |
8 | SO_4^(2-)(mg/L) | 2.13 | 1.24 | 1.42 | 2.02 | 2.12 | 250.00 |
9 | Cl^- (mg/L) | 46.15 | 17.75 | 17.76 | 39.05 | 28.40 | 250.00 |
10 | HCO_3^-(mg/L) | 54.90 | 36.60 | 42.70 | 42.70 | 24.40 | 200.00 |
11 | Na^+(mg/L) | 29.90 | 11.50 | 11.50 | 25.30 | 18.42 | 200.00 |
12 | K^+(mg/L) | 8.218 | 6.32 | 6.32 | 11.35 | 8.15 | 200.00 |
13 | Ca^(2+)(mg/L) | 140.00 | 180.00 | 44.00 | 92.00 | 100.00 | 7.50 |
14 | Mg^(2+)(mg/L) | 85.05 | 65.61 | 26.73 | 55.89 | 60.75 | 50.00 |
15 | Mn^(2+)(mg/L) | 0.32 | 0.25 | 0.42 | 0.632 | 0.38 | 0.50 |
16 | Fe^(2+)(mg/L) | 0.35 | 0.32 | 0.33 | 0.324 | 0.38 | 0.30 |
| [1] | Afolabi, O., & Omotoso, E. J. (2008). Delineation of saltwater intrusion into the freshwater aquifer of Lekki Peninsula, Lagos, Nigeria. Environmental Geology, 56(5), 927-933. |
| [2] | Aizebeokhai, A. P. (2021). Application of electrical resistivity tomography in near-surface investigations: A review. Geosciences, 11(1), 45. |
| [3] | Aizebeokhai, A. P., & Oyeyemi, K. D. (2014). Subsurface characterization using geoelectrical resistivity imaging: A case study of Ota, southwestern Nigeria. Arabian Journal of Geosciences, 7(10), 4493-4506. |
| [4] | Aizebeokhai, A. P. (2021). Advances in 2D and 3D Electrical Resistivity Imaging. Geosciences, 11(7), 279. |
| [5] | Adepelumi, A. A., Ako, B. D., Ajayi, T. R., Afolabi, O., & Omotoso, E. J. (2008). Delineation of saltwater intrusion into the freshwater aquifer of Lekki Peninsula, Lagos, Nigeria. Environmental Geology, 56(5), 927-933. |
| [6] | Akakuru, O. C., Akudinobi, B., Opara, A. I., Onyekuru, S. O., & Akakuru, O. U. (2021). Hydrogeochemical facies and pollution status of groundwater resources of Owerri and environs, Southeastern Nigeria. Environmental Monitoring and Assessment, 193(10). |
| [7] | Avbovbo, A. A. (1978). Tertiary lithostratigraphy of Niger Delta. AAPG Bulletin, 62(2), 295-300. |
| [8] | Environmental Protection Agency (EPA). (2018). Secondary Drinking Water Standards: Guidance for Nuisance Chemicals. |
| [9] | Etu-Efeotor, J. O., & Akpokodje, E. G. (1990). Aquifer systems of the Niger Delta. Journal of Mining and Geology, 26(2), 279-284. |
| [10] | George, J. N., Ibuot, J. C. and Obiora, D. N. (2015a) Geoelectrohydraulic of shallow sandy in Itu, Akwa Ibom State (Nigeria) using geoelectric and hydrogeological measurements. Journal of African Earth Sciences, 110: 52-63. |
| [11] | George, N. J. (2021). Integrating hydrogeological and second-order geo-electric indices in groundwater vulnerability mapping: A case study of alluvial environments. Applied Water Sciences, 11: 123. |
| [12] | George, N. J., Ibanga, J. I. and Ubom, A. I. (George et al., 20215b). Geoelectrohydrogeological indices of evidence of ingress of saline water into freshwater in parts of coastal aquifers of Ikot Abasi, southern Nigeria. Journal of African Earth Sciences 109, 37-46. |
| [13] | Hassan, A., Idris, M., & Bala, A. (2020). Application of remote sensing and GIS in groundwater potential mapping in Nigeria: A review. Environmental Earth Sciences, 79, 1-12. |
| [14] | Ibe, K. M., Sarpong, G. A., & Agbasi, C. C. (2020). Aquifer vulnerability assessment and electrical resistivity method in coastal areas of Nigeria. Environmental Earth Sciences, 79(7), 1-12. |
| [15] | Ibuot, J. C., Aka, M. U., Inyang, N. J. and Agbasi, O. E. (2022). Georesistivity and physicochemical evaluation of hydrogeologic units in parts of Akwa Ibom State, Nigeria. International Journal of Energy and water Resources, 6: |
| [16] | Ibuot, J. C., Akpabio, G. T. & George, N. J. (2013). A survey of the repositories of groundwater potential and distribution using geoelectrical resistivity method in Itu Local Government Area (LGA), Akwa Ibom State, Southern Nigeria. Central European Journal of Geosciences 5 (4), 538-547. |
| [17] | Maiti, S., Prakash, A., & Dutta, S. (2018). Groundwater potential zonation using geoelectrical and geospatial techniques: A case study from India. Environmental Earth Sciences, 77, 1-13. |
| [18] | Olasehinde, P. I., et al. (2022). ERT Applications in Coastal Nigeria. Journal of African Earth Sciences, 189, 104445. |
| [19] | Oteri, A. U., & Atakpo, E. (2020). Hydrogeological Characterization of Akwa Ibom. Nigerian Journal of Geosciences, 15(2), 55-68. |
| [20] | Okolo, C. M., Akudinobi, B. E. B., Obiadi, I. I., Onuigbo, E. N. and Obasi, P. N. 2018 Hydrochemical evaluation of lower Niger drainage area, southern Nigeria. Applied Water Science. 8(201). |
| [21] | Okoroh, D. O. and Ibuot, J. C (2022). Hydrogeochemical assessment of groundwater quality: a case study of Federal College of Education (Technical), Omoku, Rivers State. Water Practice and Technology, 17(7): 1458-1469. |
| [22] | Okoro, O. C., & George, N. J. (2020). Geoelectrical characterization of groundwater potential in part of Akwa Ibom State using 2D Electrical Resistivity Tomography. Journal of Geoscience and Environment Protection, 8(2), 62-79. |
| [23] | Revil, A., Karaoulis, M., Johnson, T., & Kemna, A. (2017). Review: Some low-hanging fruit in electrical resistivity and induced polarization imaging. The Leading Edge, 36(2), 94-102. |
| [24] | Saha, S., Selim Reza, A. H. M. and Roy, M. K. (2019). Hydrochemical evaluation of groundwater quality of the Tista foodplain, Rangpur, Bangladesh. Applied Water Science 9, 198. |
| [25] | Short, K. C., & Stauble, A. J. (1967). Outline of geology of Niger Delta. AAPG Bulletin, 51(5), 761-779. |
| [26] | Suthar, S., Sharma, J., Chabukdhara, M., & Nema, A. K. (2009). Water quality assessment of groundwater resources in Jaipur district, Rajasthan (India). Journal of Environmental Science and Engineering, 51(4), 269-276. |
| [27] | Verma, P., Singh, P. K., Sinha, R. R. and Tiwari, A. K. (2020). Assessment of groundwater quality status by using water quality index (WQI) and geographic information system (GIS) approaches: a case study of the Bokaro district, India. Applied Water Science 10(27), 7. |
| [28] | World Health Organization (WHO), 2017 Drinking Water Standards, Monitoring and reporting, vol. 1 of Recommendations, 2nd edn. WHO, Geneva, Switzerland. |
| [29] | World Health Organization (WHO). (2019). Guidelines for Drinking-water Quality (4th Ed.). Geneva: WHO Press. |
| [30] | Yakubu, J. A., Okwesili, N. A., Ibuot, J. C. and Obiora, D. N. (2022). Assessment of aquifer protective strength and groundwater quality within the University of Nigeria, Nsukka campus using geophysical and laboratory techniques. International Journal of Energy and Water Resources, |
| [31] | Yan, C. A., Zhang, W., Zhang, Z., Liu, Y., Deng, C. and Nie N (2015) Assessment of water quality and identification of polluted risky regions based on field observations and GIS in the Honghe River Watershed, China. PLoS ONE 10(3): 0119130. |
| [32] | Yetiþ, R., Ayþe, D. A., Ayþegül, D. Y., Mehmet, Y. Y. (2019). Hydrogeochemical characteristics and quality assessment of groundwater in Balikligol Basin, Sanliurfa, Turkey. Environmental Earth Sciences 78: 331 |
| [33] | Zhou, Y., Tang, X., & Liu, J. (2021). Integrated use of ERT, remote sensing, and GIS for groundwater prospecting in semi-arid regions. Remote Sensing, 13(5), 933. |
APA Style
Aka, M. U., Agbasi, O. E., Ibuot, J. C. (2025). Groundwater Prospecting in Coastal Sedimentary Terrain Using 2D ERT and GIS: A Case Study of Ikot Abasi, Nigeria. Earth Sciences, 14(5), 196-205. https://doi.org/10.11648/j.earth.20251405.13
ACS Style
Aka, M. U.; Agbasi, O. E.; Ibuot, J. C. Groundwater Prospecting in Coastal Sedimentary Terrain Using 2D ERT and GIS: A Case Study of Ikot Abasi, Nigeria. Earth Sci. 2025, 14(5), 196-205. doi: 10.11648/j.earth.20251405.13
@article{10.11648/j.earth.20251405.13,
  author = {Mfoniso Udofia Aka and Okechukwu Ebuka Agbasi and Johnson Cletus Ibuot},
  title = {Groundwater Prospecting in Coastal Sedimentary Terrain Using 2D ERT and GIS: A Case Study of Ikot Abasi, Nigeria
},
  journal = {Earth Sciences},
  volume = {14},
  number = {5},
  pages = {196-205},
  doi = {10.11648/j.earth.20251405.13},
  url = {https://doi.org/10.11648/j.earth.20251405.13},
  eprint = {https://article.sciencepublishinggroup.com/pdf/10.11648.j.earth.20251405.13},
  abstract = {Groundwater demand in Nigeria’s coastal regions is rising, yet subsurface assessment is complicated by heterogeneous sediments and tidal influences. This study applies an integrated approach combining 2D Electrical Resistivity Tomography (ERT), Vertical Electrical Sounding (VES), Geographic Information Systems (GIS), and remote sensing to delineate aquifer zones and assess groundwater quality in Ikot Abasi, Akwa Ibom State. ERT data were collected along three 200 m profiles using a Wenner-Schlumberger array and inverted with Res2Dinv. Twelve VES points provided complementary hydrogeological parameters including transmissivity and hydraulic conductivity. GIS and remote sensing datasets (SRTM DEM, Sentinel-2 imagery, drainage networks, and land cover maps) were used to georeference profiles, analyze terrain influence, and correlate resistivity anomalies with geomorphology. Results revealed three main subsurface units: shallow conductive clayey horizons (1000 Ωm) with transmissivity up to 65 m2/d. Water quality analyses showed most parameters within WHO standards, although elevated calcium, magnesium, and iron suggest geogenic enrichment from ferruginous sands. The study demonstrates that integrating ERT with GIS and remote sensing improves interpretation of aquifer distribution and groundwater quality in complex deltaic settings. This multidisciplinary workflow provides a more reliable basis for groundwater development and sustainable resource management in Nigeria’s coastal sedimentary terrains.
},
 year = {2025}
}
TY  - JOUR
T1  - Groundwater Prospecting in Coastal Sedimentary Terrain Using 2D ERT and GIS: A Case Study of Ikot Abasi, Nigeria

AU  - Mfoniso Udofia Aka
AU  - Okechukwu Ebuka Agbasi
AU  - Johnson Cletus Ibuot
Y1  - 2025/10/27
PY  - 2025
N1  - https://doi.org/10.11648/j.earth.20251405.13
DO  - 10.11648/j.earth.20251405.13
T2  - Earth Sciences
JF  - Earth Sciences
JO  - Earth Sciences
SP  - 196
EP  - 205
PB  - Science Publishing Group
SN  - 2328-5982
UR  - https://doi.org/10.11648/j.earth.20251405.13
AB  - Groundwater demand in Nigeria’s coastal regions is rising, yet subsurface assessment is complicated by heterogeneous sediments and tidal influences. This study applies an integrated approach combining 2D Electrical Resistivity Tomography (ERT), Vertical Electrical Sounding (VES), Geographic Information Systems (GIS), and remote sensing to delineate aquifer zones and assess groundwater quality in Ikot Abasi, Akwa Ibom State. ERT data were collected along three 200 m profiles using a Wenner-Schlumberger array and inverted with Res2Dinv. Twelve VES points provided complementary hydrogeological parameters including transmissivity and hydraulic conductivity. GIS and remote sensing datasets (SRTM DEM, Sentinel-2 imagery, drainage networks, and land cover maps) were used to georeference profiles, analyze terrain influence, and correlate resistivity anomalies with geomorphology. Results revealed three main subsurface units: shallow conductive clayey horizons (1000 Ωm) with transmissivity up to 65 m2/d. Water quality analyses showed most parameters within WHO standards, although elevated calcium, magnesium, and iron suggest geogenic enrichment from ferruginous sands. The study demonstrates that integrating ERT with GIS and remote sensing improves interpretation of aquifer distribution and groundwater quality in complex deltaic settings. This multidisciplinary workflow provides a more reliable basis for groundwater development and sustainable resource management in Nigeria’s coastal sedimentary terrains.

VL  - 14
IS  - 5
ER  -
Department of Physics, Federal University of Technology, Ikot Abasi, Nigeria
Department of Science Laboratory Technology, Heritage Polytechnic, Eket, Nigeria
Department of Physics and Astronomy, University of Nigeria, Nsukka, Nigeria
Information