Climate change is statistical variations over an extended period in the features of the climate system, such as variations in global temperatures and precipitation, caused by human and natural sources. In this study aimed to measure and examine how streamflow in the Dawa sub-basin, Genale Dawa River basin was affected by climate change. It used the average of five regional climate models from the Coordinated Regional Climate Downscaling Experiment (CORDEX) Africa, under two different scenarios of Representative Concentration Pathways: RCP4.5 and RCP8.5. The baseline scenario was based on the data from 1975 to 2005, while the future scenarios were based on the data from 2020s (2025–2054) and 2050s (2055–2084). The HBV hydrological model used to assess the impact on streamflow. The HBV model showed good statistical performance in simulating the impact of climate change on streamflow, with a coefficient of determination (R2) of 0.88 and Nash-Sutcliffe Efficiency (NSE) of 0.77 for monthly calibration, and R2 of 0.86 and NSE of 0.83 for monthly validation. The impacts quantified using the mean monthly changes in precipitation, maximum and minimum temperatures. The bias-corrected precipitation and temperature showed a reasonable increase in both future periods for both RCP 4.5 and RCP 8.5 scenarios. These changes in climate variables resulted in a decrease in mean annual streamflow by 1.6 and 3.5% for RCP 4.5 and by 4.6 and 4.9% for RCP 8.5 scenarios of the 2020s and 2050s, respectively. Based on the analysis that predicted a drop in precipitation during the months, and seasons and an increase in precipitation during the Belg season, with a corresponding decrease and rise in stream flow throughout the watershed. So to offset the variation in the watershed, community should adopt various; Soil and water conservation technologies, Using drought tolerant crops, Implementing various trees and appropriate design and applying a water harvesting structure like in-situ, internal or micro catchment, external or macro catchment water harvesting and Surface runoff harvesting. This result offers useful information for current and future water resource management in the basin and similar other watershed in the country.
| Published in | American Journal of Water Science and Engineering (Volume 10, Issue 2) |
| DOI | 10.11648/j.ajwse.20241002.12 |
| Page(s) | 36-47 |
| Creative Commons |
This is an Open Access article, distributed under the terms of the Creative Commons Attribution 4.0 International License (http://creativecommons.org/licenses/by/4.0/), which permits unrestricted use, distribution and reproduction in any medium or format, provided the original work is properly cited. |
| Copyright |
Copyright © The Author(s), 2024. Published by Science Publishing Group |
Climate Change, CMhyd, Cordex, Ethiopia, HBV, Streamflow
Months | Jan | Feb | Mar | Apr | May | Jun | Jul | Aug | Sep | Oct | Nov | Dec | Average |
|---|---|---|---|---|---|---|---|---|---|---|---|---|---|
RF (mm) | 17.1 | 24.7 | 74.8 | 147.2 | 109.2 | 22.6 | 14.0 | 15.7 | 37.6 | 119.6 | 61.1 | 0.7 | 644.2 |
Tmax (°C) | 27.7 | 28.4 | 27.6 | 24.7 | 24.4 | 23.2 | 23.0 | 23.9 | 25.3 | 24.7 | 32.6 | 27.0 | 26.0 |
Tmin (oC) | 12.9 | 14.2 | 14.9 | 15.5 | 14.9 | 14.0 | 13.9 | 13.9 | 14.2 | 14.7 | 13.8 | 12.7 | 14.1 |
Flow (M3/s) | 9.7 | 8.1 | 8.7 | 18.4 | 33.5 | 26.9 | 20.3 | 22.1 | 26 | 34.7 | 32.7 | 17.5 | 24.1 |
Institution | GCM | RCM | Resolution (Lat & Log) |
|---|---|---|---|
Canadian Centre for Climate Modelling and Analysis | CCCmaa-CanESM2 | SMHI-RCA4 | 2.8*2.8 |
National Institute for Environmental Studies and Japan Agency for Marine-earth Science and Technology, Japan | MIROC-MIROC5 | SMHI-RCA4 | 1.4*1.4 |
Met Office Hadley Centre, UK | HadGEM2-ES | SMHI-RCA4 | 1.25*1.25 |
CSIRO-QCCCE-CSIRO-MK3-0 | CSIRO-MK3-6-0 | SMHI-RCA4 | 1.9*1.9 |
Max Planck Institute for Meteorology, Germany | MPI-M-MPI-ESM-LR | SMHI-RCA4 | 1*1 |
LULC class 2016 | Proportional area (%) | Soil type | Proportional area (%) | Slope classes (%) | Proportional area (%) |
|---|---|---|---|---|---|
Tree cover areas | 4.29 | Chromic Cambisols | 41.5 | 0 - 4.9 | 47.58 |
Shrubs cover areas | 36.71 | Chromic Luvisols | 36.3 | 4.9 - 10.8 | 46.28 |
Grassland | 46.85 | Lithic Leptosols | 10.4 | 10.8 - 20.1 | 4.7 |
Cropland | 10.55 | Eutric Vertisols | 7.4 | 20.1 - 33.3 | 1.4 |
Flooded | 0.002 | Eutric Leptosols | 4.4 | >33.3 | 0.03 |
Sparse vegetation | 0.03 | ||||
Bare areas | 1.49 | ||||
Build up areas | 0.09 | ||||
Waterbody | 0.013 |
Data Set | Resolution | Parameters |
|---|---|---|
DEM | 12.5m | Topographical data |
Soil map | 1Km | Soil class |
Land use map | 12.5m | Lad cover and use |
Climate | Daily (0.440) | Precipitation and Temperature |
Discharge | Daily | Stream flow data |
Name of indicator perfect | Formula | Simulation value |
|---|---|---|
Coefficient of determination | R2 = 0.88 | 0.86 |
Nash-Sutcliffe Efficiency | NSE = 0.77 | 0.83 |
Time | Mean | SD | CV | Z | P | SS |
|---|---|---|---|---|---|---|
Jan | 17.1 | 23.3 | 136.4 | -0.04 | 0.68 | |
Feb | 24.7 | 34.3 | 139.3 | -0.04 | 0.68 | |
Mar | 74.8 | 79.6 | 106.4 | 0.01 | 0.34 | 0.46 |
Apr | 147.2 | 72.7 | 49.4 | -0.13 | 0.23 | |
May | 109.2 | 74.1 | 67.8 | -0.28 | 0.01 | |
Jun | 22.6 | 26.8 | 118.9 | -0.13 | 0.20 | |
Jul | 14.0 | 14.8 | 105.4 | -0.27 | 0.01 | |
Aug | 15.7 | 21.5 | 136.9 | -0.05 | 0.61 | |
Sep | 37.6 | 33.7 | 89.6 | -0.28 | 0.01 | |
Oct | 119.6 | 87.7 | 73.3 | 0.04 | 0.69 | 0.30 |
Nov | 61.1 | 51.5 | 84.3 | 0.11 | 0.30 | 0.46 |
Dec | 0.7 | 2.7 | 387.5 | -0.41 | 0.00 | |
Kiremt | 89.9 | 55.3 | 61.4 | -0.19 | 0.07 | |
Bega | 198.4 | 121.5 | 61.2 | 0.08 | 0.02 | |
Belg | 355.9 | 151.9 | 42.7 | -0.25 | 0.33 | |
Annual | 644.2 | 222.2 | 34.5 | -0.1 | 0.33 |
CORDEX | Coordinated Regional Climate Downscaling Experiment |
RCP | Representative Concentration Pathways |
R2 | Coefficient of Determination |
NSE | Nash-Sutcliffe Efficiency |
HBV | Hydrologiska Byråns Vattenbalansavdelning |
CMhyd | Climate Model for Hydrology |
HWSD | Harmonized World Soil Database |
MoWE | Ministry of Water and Energy |
| [1] | Ahmed, H., Dejene, B., Bona, Y., Alemayehu, G., Hussein, B., Birhanu, I., Abera, A., Gemechis, L., D., Olani, T. B., Getachew, M., 2011. 'Oromia National Regional State Program of Plan on Adaptation to Climate Change', Finfinnee. |
| [2] | Asadieh, B. & Krakauer, N. Y. 2017 Global change in streamflow extremes under climate change over the 21st century. Hydrol. Earth Syst. Sci. 21(11), 5863–5874. |
| [3] | Basheer, A. K., Lu, H., Omer, A., Ali, A. B., & Abdelgader, A. M. S. (2015). Impacts of climate change under CMIP5 RCP scenarios on the streamflow in the Dinder River and ecosystem habitats in Dinder National Park, Sudan. Hydrology and Earth System Sciences Discussions, 12(10), 10157–10195. |
| [4] | Bekele, D., Alamirew, T., Kebede, A., Zeleke, G., & Melesse, A. M. (2019). Modeling climate change impact on the hydrology of Keleta watershed in the Awash River basin, Ethiopia. Environmental Modeling & Assessment, 24(1), 95–107. |
| [5] | Beyene, T., Lettermaier, D. P., & Kabat, P. (2010). Hydrologic impacts of climate change on the Nile river basin: Implications of the 2007 IPCC scenarios. Climate Change, 100 (3-4), 433–461. |
| [6] | Birhanu, H., Yingjun, C., Zinabu, M., & Miseker, B. (2017). Temperature and precipitation trend analysis over the last 30 years in Southern Tigray regional State. Ethiopia Journal of Atmospheric Pollution, 5, 18–23. |
| [7] | Blöschl, G., Bierkens, M. F., Chambel, A., Cudennec, C., Destouni, G., Fiori, A. & Sivapalan, M. 2019 Twenty-three unsolved problems in hydrology (UPH)–a community perspective. Hydrol. Sci. J. 64(10), 1141–1158. |
| [8] | Clarke, L., Edmonds, J., Jacoby, H., Pitcher, H., Reilly, J., & Richels, R. (2007). Climate change science program and the subcommittee on global change research. p. 154. |
| [9] | Dewitte, O., Jones, A., Spaargaren, O., Breuning-Madsen, H., Brossard, M., Dampha, A., Deckers, J., Gallali, T., Hallett, S., & Jones, R. (2013). Harmonization of the soil map of Africa at the continental scale. Geoderma, 211-212, 138–153. |
| [10] | Elshamy, M. E., Balirira, R., Abdel-Gaffar, E., & Moges, S. A. (2009). Investigating the climate sensitivity of different Nile sub-basins. 13th International Water Technology Conference, IWTC, Hurghada, Egypt. |
| [11] | Fenta, A. A., Yasuda, H., Shimizu, K., & Haregeweyn, N. (2017). Response of streamflow to climate variability and changes in human activities in the semiarid highlands of northern Ethiopia. Regional Environmental Change, 17(4), 1229–1240. |
| [12] | Ficklin, D. L., Luo, Y., Luedeling, E., Gatzke, S. E., & Zhang, M. (2010). Sensitivity of agricultural runoff loads to rising levels of CO2 and climate change in the San Joaquin Valley watershed of California. Environmental Pollution, 158(1), 223–234. |
| [13] | Gan TY, Ito M, Hülsmann S, Qin X, Lu XX, Liong SY, Rutschman P, Disse M, Koivusalo H (2015) Possible climate change/variability and human impacts, vulnerability of drought-prone regions, water resource and capacity building for Africa. J of hydrological sciences, 61. No 7: 1209–1226. |
| [14] | Gizaw, M. S., Biftu, G. F., Gan, T. Y., Moges, S. A. & Koivusalo, H. 2017 Potential impact of climate change on streamflow of major Ethiopian rivers. Clim. Change 143(3–4), 371–383. |
| [15] | Intergovernmental Panel on Climate Change (IPCC). (2013). T. F. Stocker, D. Qin, G. K. Plattner, M. Tignor, S. K. Allen, J. Boschung, A. Nauels, Y. Xia, V. Bex, & P. M. Midgley (Eds.). Climate Change 2013. The Physical Science Basis. Cambridge University Press. |
| [16] | Intergovernmental Panel on Climate Change (IPCC). (2014). V. R. Barros, C. B. Field, D. J. Dokken, M. D. Mastrandrea, K. J. Mach, T. E. Bilir, M. Chatterjee, K. L. Ebi, Y. O. Estrada, R. C. Genova, B. Girma, E. S. Kissel, A. N. Levy, S. MacCracken, P. R. Mastrandrea, & L. L. White (Eds.). Cambridge University Press. |
| [17] | Karanurun, A., Kara, F., 2011. Analysis of spatially distributed annual, seasonal and monthly temperatures in Istanbul from 1975 to 2006. World Applied Sciences Journal, 12 (10), 1662–1675. |
| [18] | Mekonnen, D. F., Duan, Z., Rientjes, T., & Disse, M. (2018). Analysis of combined and isolated effects of land-use and land-cover changes and climate change on the upper Blue Nile river basin’s streamflow. Hydrology and Earth System Sciences, 22(12), 6187 6207. |
| [19] | Muller, C. J., O’Gorman, P. A., Back, I. E., 2011. Intensification of precipitation extremes with warming in a cloud-resolving model. J. Clim. 24, 2784-2800. |
| [20] | Oeurng, C., Cochrane, T. A., Chung, S., Kondolf, M. G., Piman, T. & Arias, M. E. 2019. Assessing climate change impacts on river flows in the Tonle Sap Lake Basin, Cambodia. Water 11(3), 1–27. |
| [21] | Patil, M., Lal, D., Karwariya, S., Bhattacharya, R. K. & Behera, N. R. 2018 Comparative study of different GCM models for streamflow prediction. Curr. J. Appl. Sci. Technol. 26(5), 1–12. |
| [22] | Piao, S., Ciais, P., Huang, Y., Shen, Z., Peng, S., Li, J. & Ding, Y. 2010. The impacts of climate change on water resources and agriculture in China. Nature 467(7311), 43–51. |
| [23] | Saharia, A. M. & Sarma, A. K. 2018 Future climate change impact evaluation on hydrologic processes in the Bharalu and Basistha basins using SWAT model. Nat. Hazards 92(3), 1463–1488. |
| [24] | Sahu, N., Behera, S. K., Yamashiki, Y., Takara, K. and Yamagata, T., 2012. IOD and ENSO Impact the extreme stream-flows of the Citarum River in Indonesia. Climate Dynamics, 39 (7-8), 1673–1680. |
| [25] | Wang, Z., Ficklin, D. L., Zhang, Y. & Zhang, M. 2012. Impact of climate change on streamflow in the arid Shiyang River Basin of northwest China. Hydrol. Process. 26(18), 2733–2744. |
| [26] | 26. Duba, G. W., Demissie, S. T. and Emiru, T. S. 2021 “Gelgelo Wako Duba, Solomon Tekalign Demissie, Tegegne Sishaw Emiru,” 7(1). |
| [27] | Worku, M. A., Feyisa, G. L. and Beketie, K. T. 2022b “Climate trend analysis for a semi-arid Borena zone in southern Ethiopia during 1981 – 2018,” Environmental Systems Research, 7. |
| [28] | Aich V, Liersch S, Vetter T, Huang S, Tecklenburg J, Hoffmann P, Koch H, Fournet S, Krysanova V, Müller EN, Hattermann FF (2014) Comparing impacts of climate change on streamflow in four large African river basins. Hydrol Earth Syst Sci 18: 1305–1321. |
| [29] | Gutowski, J. W., Giorgi, F., Timbal, B., Frigon, A., Jacob, D., Kang, H. S., Raghavan, K., Lee, B., Lennard, & C., Nikulin, G. (2016). WCRP coordinated regional downscaling experiment (CORDEX): A diagnostic MIP for CMIP6. Geoscientific Model Development, 9(11), 4087–4095. |
| [30] | Giorgi, F., Jones, C., & Asrar, G. (2009). Addressing climate information needs at the regional level: The CORDEX framework. World Meteorological Organization Bulletin, 58, 175–183. |
| [31] | Gbobaniyi, E., Sarr, A., Sylla, M. B., Diallo, I., Lennard, C., Dosio, A., Dhiédiou, A., Kamga, A., Klutse, N. A. B., Hewitson, B., Nikulin, G., & Lamptey, B. (2014). Climatology, annual cycle and interannual variability of precipitation and temperature in CORDEX simulations over West Africa. International Journal of Climatology, 34(7), 2241–2257. |
| [32] | Nikulin, G. (2012). Precipitation climatology in an ensemble of CORDEX-Africa regional climate simulations. Journal of Climate, 25(18), 6057–6078. |
| [33] | Nikulin, G. (2018). The effects of 1.5 and 2 degrees of global warming on Africa in the CORDEX ensemble. Environmental Research Letters, 13(6). |
| [34] | Osima, S. (2018). Projected climate over the greater horn of Africa under 1.5°C and 2°C global warming. Environmental Research Letters, 13(6). |
| [35] | Dosio, A. (2017). Projection of temperature and heat waves for Africa with an ensemble of CORDEX regional climate models. Climate Dynamics, 49(1–2), 493–519. |
| [36] | Abebe, E. and Kebede, A. (2017) ‘Assessment of Climate Change Impacts on the Water Resources of Megech River Catchment, Abbay Basin, Ethiopia’, Open Journal of Modern Hydrology, 07(02), pp. 141–152. Available at: |
| [37] | Gizaw, M. S. et al. (2017) ‘Potential impact of climate change on streamflow of major Ethiopian rivers’, Climatic Change, 143(3–4), pp. 371–383. Available at: h |
| [38] | Kankam-yeboah, K. et al. (2013) ‘Impact of climate change on streamflow in selected river basins in Ghana Impact of climate change on streamflow in selected river basins in Ghana’, 6667. Available at: |
| [39] | Strauch, A. M. et al. (2015) ‘Climate driven changes to rainfall and streamflow patterns in a model tropical island hydrological system’, Journal of Hydrology, 523, pp. 160–169. Available at: |
| [40] | Willmott, C. and Matsuura, K.: Advantages of the Mean Absolute Error (MAE) over the Root Mean Square Error (RMSE) in assessing average model performance, Clim. Res., 30, 79–82, 2005. |
| [41] | Piani C, Weedon GP, Best M, Gomes SM, Viterbo P, Hagemann S, Haerter JO (2010) Statistical bias correction of global simulated daily precipitation and temperature for the application of hydrological models. Hydrol. |
| [42] | McCuen, R. H. 1989. Hydrologic Analysis and Design. Prentice-Hall, Inc. Englewood Cliffs, NJ. SCS, 1972 - (Soil Conservation Service). National Engineering Handbook, Section 4, U. S. Department of Agriculture, Washington, D. C. |
| [43] | Subramanian, K. (2008) Engineering Hydrology. Tata McGraw-Hill Publishing Company Limited, New Delhi. |
APA Style
Bulti, A., Abegaz, F. (2024). Impacts of Climate Change on Streamflow on Dawa Sub-watershed, Genale-Dawa River Basin, Southern Ethiopia. American Journal of Water Science and Engineering, 10(2), 36-47. https://doi.org/10.11648/j.ajwse.20241002.12
ACS Style
Bulti, A.; Abegaz, F. Impacts of Climate Change on Streamflow on Dawa Sub-watershed, Genale-Dawa River Basin, Southern Ethiopia. Am. J. Water Sci. Eng. 2024, 10(2), 36-47. doi: 10.11648/j.ajwse.20241002.12
AMA Style
Bulti A, Abegaz F. Impacts of Climate Change on Streamflow on Dawa Sub-watershed, Genale-Dawa River Basin, Southern Ethiopia. Am J Water Sci Eng. 2024;10(2):36-47. doi: 10.11648/j.ajwse.20241002.12
@article{10.11648/j.ajwse.20241002.12,
  author = {Ayana Bulti and Fentaw Abegaz},
  title = {Impacts of Climate Change on Streamflow on Dawa Sub-watershed, Genale-Dawa River Basin, Southern Ethiopia
},
  journal = {American Journal of Water Science and Engineering},
  volume = {10},
  number = {2},
  pages = {36-47},
  doi = {10.11648/j.ajwse.20241002.12},
  url = {https://doi.org/10.11648/j.ajwse.20241002.12},
  eprint = {https://article.sciencepublishinggroup.com/pdf/10.11648.j.ajwse.20241002.12},
  abstract = {Climate change is statistical variations over an extended period in the features of the climate system, such as variations in global temperatures and precipitation, caused by human and natural sources. In this study aimed to measure and examine how streamflow in the Dawa sub-basin, Genale Dawa River basin was affected by climate change. It used the average of five regional climate models from the Coordinated Regional Climate Downscaling Experiment (CORDEX) Africa, under two different scenarios of Representative Concentration Pathways: RCP4.5 and RCP8.5. The baseline scenario was based on the data from 1975 to 2005, while the future scenarios were based on the data from 2020s (2025–2054) and 2050s (2055–2084). The HBV hydrological model used to assess the impact on streamflow. The HBV model showed good statistical performance in simulating the impact of climate change on streamflow, with a coefficient of determination (R2) of 0.88 and Nash-Sutcliffe Efficiency (NSE) of 0.77 for monthly calibration, and R2 of 0.86 and NSE of 0.83 for monthly validation. The impacts quantified using the mean monthly changes in precipitation, maximum and minimum temperatures. The bias-corrected precipitation and temperature showed a reasonable increase in both future periods for both RCP 4.5 and RCP 8.5 scenarios. These changes in climate variables resulted in a decrease in mean annual streamflow by 1.6 and 3.5% for RCP 4.5 and by 4.6 and 4.9% for RCP 8.5 scenarios of the 2020s and 2050s, respectively. Based on the analysis that predicted a drop in precipitation during the months, and seasons and an increase in precipitation during the Belg season, with a corresponding decrease and rise in stream flow throughout the watershed. So to offset the variation in the watershed, community should adopt various; Soil and water conservation technologies, Using drought tolerant crops, Implementing various trees and appropriate design and applying a water harvesting structure like in-situ, internal or micro catchment, external or macro catchment water harvesting and Surface runoff harvesting. This result offers useful information for current and future water resource management in the basin and similar other watershed in the country.
},
 year = {2024}
}
TY  - JOUR
T1  - Impacts of Climate Change on Streamflow on Dawa Sub-watershed, Genale-Dawa River Basin, Southern Ethiopia

AU  - Ayana Bulti
AU  - Fentaw Abegaz
Y1  - 2024/08/20
PY  - 2024
N1  - https://doi.org/10.11648/j.ajwse.20241002.12
DO  - 10.11648/j.ajwse.20241002.12
T2  - American Journal of Water Science and Engineering
JF  - American Journal of Water Science and Engineering
JO  - American Journal of Water Science and Engineering
SP  - 36
EP  - 47
PB  - Science Publishing Group
SN  - 2575-1875
UR  - https://doi.org/10.11648/j.ajwse.20241002.12
AB  - Climate change is statistical variations over an extended period in the features of the climate system, such as variations in global temperatures and precipitation, caused by human and natural sources. In this study aimed to measure and examine how streamflow in the Dawa sub-basin, Genale Dawa River basin was affected by climate change. It used the average of five regional climate models from the Coordinated Regional Climate Downscaling Experiment (CORDEX) Africa, under two different scenarios of Representative Concentration Pathways: RCP4.5 and RCP8.5. The baseline scenario was based on the data from 1975 to 2005, while the future scenarios were based on the data from 2020s (2025–2054) and 2050s (2055–2084). The HBV hydrological model used to assess the impact on streamflow. The HBV model showed good statistical performance in simulating the impact of climate change on streamflow, with a coefficient of determination (R2) of 0.88 and Nash-Sutcliffe Efficiency (NSE) of 0.77 for monthly calibration, and R2 of 0.86 and NSE of 0.83 for monthly validation. The impacts quantified using the mean monthly changes in precipitation, maximum and minimum temperatures. The bias-corrected precipitation and temperature showed a reasonable increase in both future periods for both RCP 4.5 and RCP 8.5 scenarios. These changes in climate variables resulted in a decrease in mean annual streamflow by 1.6 and 3.5% for RCP 4.5 and by 4.6 and 4.9% for RCP 8.5 scenarios of the 2020s and 2050s, respectively. Based on the analysis that predicted a drop in precipitation during the months, and seasons and an increase in precipitation during the Belg season, with a corresponding decrease and rise in stream flow throughout the watershed. So to offset the variation in the watershed, community should adopt various; Soil and water conservation technologies, Using drought tolerant crops, Implementing various trees and appropriate design and applying a water harvesting structure like in-situ, internal or micro catchment, external or macro catchment water harvesting and Surface runoff harvesting. This result offers useful information for current and future water resource management in the basin and similar other watershed in the country.

VL  - 10
IS  - 2
ER  -
Oromia Agricultural Research Institute, Mechara Agricultural Research Center, Department of Irrigation and Drainage Engineering, Mechara, Ethiopia
Independent Scholar, Adama, Ethiopia
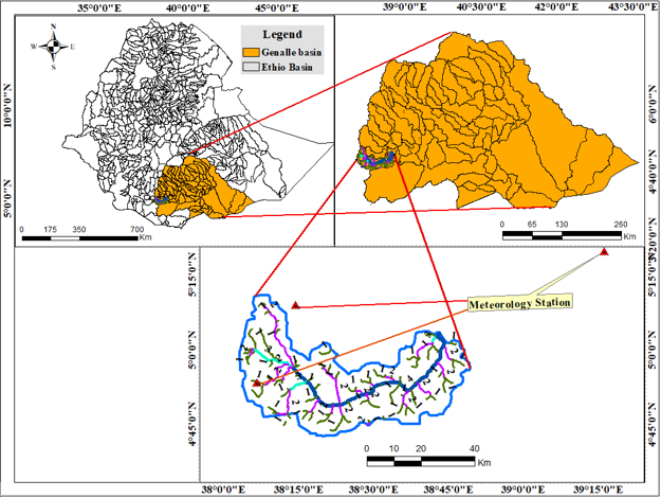
Figure 1. Location Map of the Study area (Source: Ethiopian Geospatial Map, 2016).
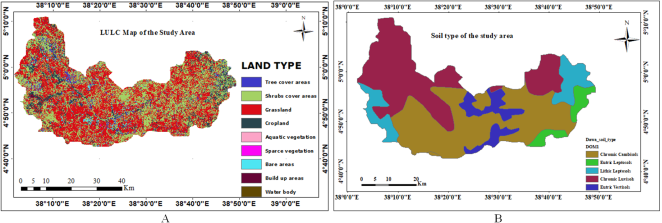
Figure 2. A. Land use land cover (2016) and B. Soil type.
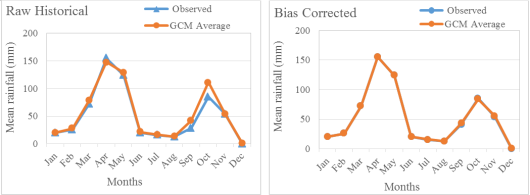
Figure 3. A comparison of the simulated and observed mean monthly rainfall before and after bias adjustment can be seen on the left and right.
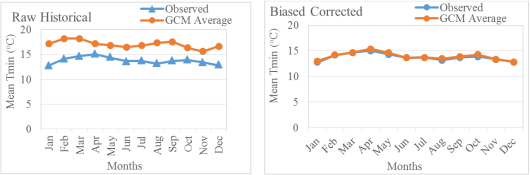
Figure 4. Comparison of bias-corrected mean monthly Tmin before (left side) and after (right side) simulation and observation.
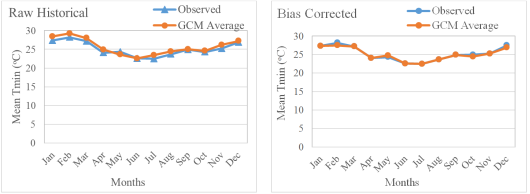
Figure 5. Comparison of bias-corrected simulated and observed mean monthly Tmax before (left side) and after (right side).
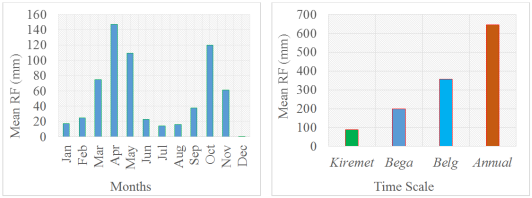
Figure 6. Baseline period areal rainfall observed period.
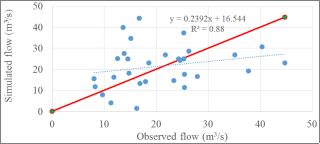
Figure 7. Scatter plot of simulated versus observed flow monthly during the calibration period.
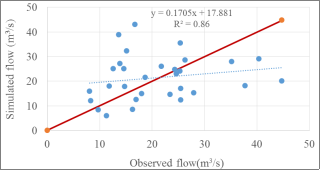
Figure 8. Scatter plot of simulated versus observed flow monthly during the validation period.
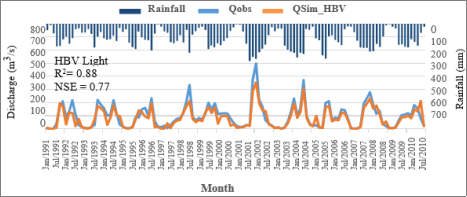
Figure 9. Monthly observed vs. simulated discharge hydrograph for Dawa sub-watershed of calibration period.
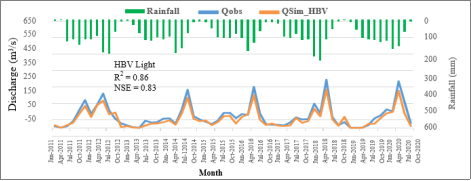
Figure 10. Hydrograph of Dawa sub-watershed monthly observed vs. predicted discharge of validation period.
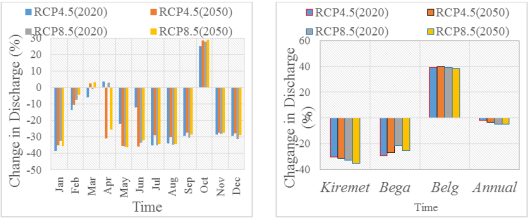
Figure 11. Projected change of mean monthly and seasonal discharge in 2020 and 2050 from the baseline period.
Information

