Abstract
Dhaka's road-safety burden is shaped not only by the number of reported crashes but also by changes in severity, pedestrian involvement, and the number of vehicles participating in each event. This study develops an internally validated annual time series from road-accident, casualty, and vehicle cross-tabulations for Dhaka City for 1998-2015, supplied as data from the Accident Research Institute (ARI), Bangladesh University of Engineering and Technology (BUET). The harmonised record contains 10,959 reported crashes, 12,470 casualty records, and 15,697 involved-vehicle records. Data quality was assessed by reconciling independent table totals and reconstructing crash counts from the vehicle-distribution table. Temporal behaviour was evaluated using descriptive statistics, ordinary least squares with HC3 robust standard errors, Mann-Kendall and Theil-Sen trend estimators, Poisson and negative binomial NB2 count models, grouped binomial logistic models, segmented regression, Spearman correlation, and principal component analysis (PCA). Reported crashes decreased from 1,202 in 1998 to 391 in 2015 (-67.5%), casualty records decreased by 65.2%, and involved-vehicle records decreased by 73.8%. Strong Poisson overdispersion (8.22-27.06) favoured NB2 models; the crash-frequency NB2 incidence-rate ratio was 0.525 per decade (95% CI: 0.459-0.602). However, the fatal-crash share rose from 33.2% to 74.2% (grouped-binomial OR = 3.044 per decade), the pedestrian casualty share rose from 35.9% to 59.4%, and the pedestrian-collision share rose from 41.0% to 71.4%. Conversely, the multi-vehicle crash share fell from 52.8% to 23.8%, and mean vehicles per crash declined from 1.562 to 1.256. The first two principal components explained 84.2% of standardised annual variation. Overall, the findings indicate a transition from a higher-frequency, multi-vehicle crash profile toward a lower-frequency but more fatal- and pedestrian-concentrated reported crash structure. These results support prioritising pedestrian protection, speed management, safer junctions and public-transport interfaces, and stronger integrated crash-data systems in Dhaka. Because exposure denominators and crash-level covariates were unavailable, the results should be interpreted as temporal associations in reported events rather than causal or exposure-adjusted risk estimates.
Keywords
Road Safety, Crash Frequency, Negative Binomial Regression, Pedestrian Crashes, Severity Composition, ARI, BUET
1. Introduction
Road traffic safety is an essential component of sustainable urban transportation because crashes directly affect mobility, public health, economic productivity, and quality of life. Rapid urbanisation and motorisation can intensify these challenges when transport infrastructure, traffic management, enforcement, and facilities for vulnerable road users do not develop at the same pace as travel demand. In densely populated metropolitan areas, interactions among pedestrians, motorcycles, public transport, private vehicles, and non-motorised modes create complex traffic environments in which both crash occurrence and crash severity can become significant concerns.
In highly populated low-income settings, crash occurrence and severity are influenced by traffic-flow conditions, driver behaviour, roadway characteristics, vehicle type, and interactions among heterogeneous road users
| [1] | Imran, M. I. A., Rakib, S., Uddin, M. N., Khan, A., Jannat, S. R., Talukder, E. Traffic Analysis and Driver Behavior Study in Highly Populated City of Low-Income Economies: A Statistical Approach. Transportation Research Interdisciplinary Perspectives. 2026, 36, 101838.
https://doi.org/10.1016/j.trip.2026.101838 |
| [2] | Damene, M. T., Abdullah, M., Al-Ahmadi, H., Basheer, M. A. Modeling Driver-Caused Road Crash Severity Using SHAP-Enhanced Machine Learning. Transportation Research Procedia. 2026, 96, 348–355.
https://doi.org/10.1016/j.trpro.2026.04.002 |
[1, 2]
. These challenges are particularly relevant to Dhaka, where rapid urban growth, chronic congestion, inadequate infrastructure, deficiencies in public transport, school-mobility safety concerns, and increasing private-vehicle use have created substantial operational and road-safety pressures
| [3] | Azad, I. I., Ahmed, A., Rahman, M. S. N. Mobility and Safety in School Transportation: A Case Study of Dhaka. In Proceedings of the 6th Annual Paper Meet of Civil Engineering Division of Institution of Engineers, Bangladesh (APMCE 2026), IEB Headquarters, Ramna, Dhaka, Bangladesh, 11–12 July 2026. |
| [7] | Ali, Y., Rafay, M., Khan, R. D. A., Sorn, M. K., Jiang, H. Traffic Problems in Dhaka City: Causes, Effects, and Solutions (Case Study to Develop a Business Model). Open Access Library Journal. 2023, 10(5), 1–15.
https://doi.org/10.4236/oalib.1109994 |
| [9] | Monia, S. H. Road Safety in Dhaka: Challenge for Sustainable Development. Tourism and Sustainable Development Review. 2021, 2(1), 72–84. https://doi.org/10.31098/tsdr.v2i1.19 |
| [13] | Rahman, A., Hoque, A. K. M. F. Traffic Congestion in Dhaka City: Potential Solutions. European Journal of Social Sciences Studies. 2018, 2(12), 121–136.
https://doi.org/10.46827/ejsss.v0i0.371 |
| [15] | Chowdhury, T. U., Raihan, S. M., Fahim, A., Bhuiyan, M. A. A Case Study on Reduction of Traffic Congestion of Dhaka City: Banani Intersection. In Proceedings of the International Conference on Agricultural, Civil and Environmental Engineering (ACEE-16), Istanbul, Turkey, 18–19 April 2016; pp. 59–65. https://doi.org/10.17758/URUAE.AE0416238 |
| [19] | Siddique, A., Iffat, S., Islam, M. M. Effects of Car Involvement in Congestion and Road Accident in Dhaka City: A Study on Sustainable Solutions. In Proceedings of the 1st International Conference on Civil Engineering for Sustainable Development (ICCESD-2012), KUET, Khulna, Bangladesh, 23–24 March 2012. |
[3, 7, 9, 13, 15, 19]
.
Previous studies consistently show that Dhaka’s road-safety burden is spatially and operationally concentrated. Research has identified severe crash outcomes, pedestrian-dominated collisions, deficiencies in traffic management, and limitations in administrative crash records
| [6] | Dina, F. A., Manik, M. H., Mahmud, S. Urban Road Accident Scenarios in Dhaka Metropolitan Area. Journal of Transportation Systems. 2024, 9(1), 8–23.
https://doi.org/10.46610/JoTS.2024.v09i01.002 |
| [10] | Siraj, M. S. B., Rabbi, F., Islam, M. J., Asma, M. S. Road Accident Analysis: A Case Study Dhaka Metropolitan Area. Journal of Transportation Systems. 2021, 6(3), 48–54. |
| [11] | Uddin, M. I., Raihan, M. A., Mahmud, S. M. S., Pervaz, S. Road Safety Status of Dhaka City: What Does Our Data Tell Us and Priorities for the Way Forward. In Proceedings of the 5th International Conference on Advances in Civil Engineering (ICACE 2020), CUET, Chattogram, Bangladesh, 4–6 March 2021. No publisher DOI identified. |
[6, 10, 11]
. GIS-based studies have identified statistically significant accident hotspots and high-risk corridors, demonstrating the need for location-specific safety interventions and improved geo-referenced crash databases
| [12] | Ahmad, A. U., Hossain, K. T., Hossain, M. A. Identification of Urban Traffic Accident Hotspot Zones Using GIS: A Case Study of Dhaka Metropolitan Area. Journal of Geographical Studies. 2019, 3(1), 36–42.
https://doi.org/10.21523/gcj5.19030104 |
| [18] | Ahmed, I., Ahmed, B., Hainin, M. R. High-Risk Road Accident Corridors in Dhaka, Bangladesh. Jurnal Teknologi. 2013, 65(3), 61–65. https://doi.org/10.11113/jt.v65.2147 |
[12, 18]
. Earlier analyses similarly reported high concentrations of severe crashes on particular road sections and highlighted weaknesses in crash-data collection and reporting
.
Pedestrians remain one of the most vulnerable road-user groups in Dhaka. Field-based and hospital studies have associated pedestrian injuries with inadequate footpaths, unsafe road crossing, roadside activities, weak enforcement, and interactions with buses and other motorised vehicles
| [16] | Ahmad, M., Rahman, F. N., Ali, M., Al-Azad, M. A. S. Road Traffic Injury among Pedestrians in Dhaka City. Journal of Armed Forces Medical College, Bangladesh. 2016, 12(1), 3–7. https://doi.org/10.3329/jafmc.v12i1.39948 |
| [20] | Rahaman, K. R., Hossain, M. Z., Rahman, M. A., Afrin, S. Pedestrian’s Accidents and Awareness: A Study of Dhaka City, Bangladesh. Khulna University Studies. 2008, 9(2), 173–180. https://doi.org/10.53808/KUS.2008.9.2.0813-E |
[16, 20]
. Intersection-level statistical modelling has further shown that pedestrian crashes are influenced by traffic volume, road geometry, traffic control, bus stops, land use, and pedestrian exposure
| [14] | Rifaat, S. M., Tay, R., Raihan, S. M., Fahim, A., Touhidduzzaman, S. M. Vehicle-Pedestrian Crashes at Intersections in Dhaka City. The Open Transportation Journal. 2017, 11, 11–19. https://doi.org/10.2174/1874447801711010011 |
[14]
. Recent forensic evidence also confirms the continued high representation of pedestrians among fatal road-traffic cases in Bangladesh
| [4] | Naher, L., Begum, J., Begum, H., Rahman, M. J. Death Due to Road Traffic Accidents: A Forensic Study in Bangladesh. Community Based Medical Journal. 2026, 15(2), 239–245. https://doi.org/10.3329/cbmj.v15i2.91495 |
[4]
.
Recent research has expanded crash analysis in Dhaka by examining specific vehicle types and severity factors. Studies of unauthorised vehicles have highlighted regulatory and operational influences on fatal crashes
| [8] | Ghani, M., Huq, A. S., Meherin, S. Causative Factors to the Unauthorized Vehicle Fatal Accidents in Dhaka Metropolitan City. In Proceedings of the 6th International Conference on Civil Engineering for Sustainable Development (ICCESD 2022), Khulna University of Engineering & Technology (KUET), Khulna, Bangladesh, 10–12 February 2022. |
[8]
, while motorcycle-severity modelling has identified road class, collision type, junction characteristics, and vehicle-related factors as important determinants
| [5] | Islam, F., Saad, M. E., Raihan, M. A., Hadiuzzaman, M. Assessment of Key Contributing Factors to Motorcycle Crash Severity in Dhaka City Through Comparative Modeling Approach. In Proceedings of the 8th International Conference on Civil Engineering for Sustainable Development (ICCESD 2026), Khulna University of Engineering & Technology (KUET), Khulna, Bangladesh, 5–7 February 2026. |
[5]
. However, much of the existing literature remains focused on specific sites, road-user groups, short study periods, or individual crash characteristics. A broader South Asian comparison shows a similar pattern in megacities such as Delhi and Karachi, where pedestrians, motorcyclists, and other vulnerable road users continue to account for a substantial share of serious road casualties despite reductions in overall crash or fatality counts. These findings reinforce the need to assess long-term changes in crash frequency together with severity composition, casualty patterns, and vehicle involvement.
This paper addresses that gap using annual accident, casualty, and vehicle records for Dhaka City from 1998 to 2015 obtained from the Accident Research Institute (ARI), Bangladesh University of Engineering and Technology (BUET). Seven annual cross-tabulated datasets were harmonised and internally validated, including reconstruction of annual crash totals from vehicle-involvement records. The study separately examines changes in reported crash counts and changes in severity, pedestrian, junction, and vehicle-involvement composition. Descriptive statistics are combined with OLS regression using HC3 robust standard errors, Mann–Kendall tests, Theil–Sen slopes, Poisson and negative binomial NB2 models, grouped binomial logistic regression, segmented regression, Spearman correlation, and principal component analysis to identify robust long-term patterns and their implications for road-safety management in Dhaka.
2. Data and Study Design
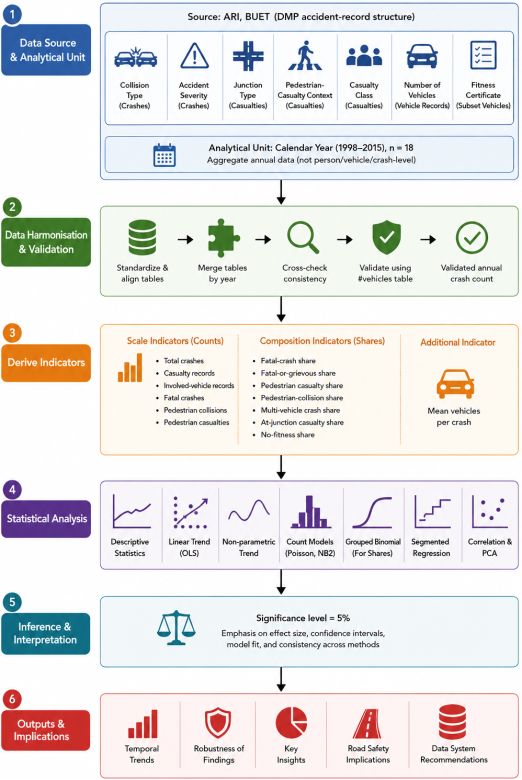
The study followed a structured analytical workflow using annual road-accident data for Dhaka City from 1998 to 2015 obtained from the Accident Research Institute (ARI), BUET. As illustrated in
Figure 1, the methodology begins with seven source tables covering collision type, accident severity, junction characteristics, pedestrian-casualty context, casualty class, number of vehicles involved, and vehicle fitness status. These datasets were harmonised by year, cross-validated for internal consistency, and used to derive count-, proportion-, and vehicle-involvement indicators. The validated indicators were then analysed using descriptive statistics, OLS trend models, non-parametric tests, Poisson and negative binomial count models, grouped binomial models, segmented regression, Spearman correlation, and PCA. The final stage integrates the statistical evidence to identify temporal trends, assess the robustness of findings, and derive road-safety and data-system implications for Dhaka.
2.1. Data Source and Analytical Unit
The source consists (
Table 1) of annual road-accident cross-tabulations for Dhaka City for 1998-2015. The datasets were supplied to the researchers as data from the Accident Research Institute (ARI), Bangladesh University of Engineering and Technology (BUET), and the original tables carry Dhaka Metropolitan Police accident-record structure and terminology. The analysis therefore treats the source as an ARI, BUET-held or supplied administrative road-accident record and does not imply endorsement by the institution.
The unit of analysis is the calendar year (n = 18). The source is not a person-level, vehicle-level or crash-level microdata file. Consequently, the models estimate temporal variation in annual reported counts and grouped shares. They cannot identify individual casualty-severity probabilities, control for crash-level confounders, or estimate exposure-adjusted rates because annual traffic volume, vehicle-kilometres, pedestrian exposure and population denominators are not available.
Table 1. Source tables, analytical units, and role in the study.
Domain | Source table | Unit | Analytical role |
Accident frequency | Collision type | Crashes | Head-on, rear-end, right-angle, side, pedestrian and other collision categories |
Accident severity | Accident severity | Crashes | Fatal, grievous, simple injury and collision-only |
Casualty context | Junction type | Casualty records | Not at junction, cross, T-junction, staggered, roundabout, railway and other |
Casualty context | Pedestrian-casualty context | Casualty records | Annual casualty records grouped by pedestrian-casualty count |
Casualty class | Casualty class | Casualties | Pedestrian, rickshaw, motorcycle, bus, car and other classes |
Vehicle involvement | Number of vehicles | Vehicle records | Vehicle records in crashes involving k vehicles |
Vehicle condition | Fitness certificate | Subset vehicle records | Yes, no and not applicable |
2.2. Data Harmonisation and Cross-Table Validation
Category labels were normalised, years were converted to integer calendar years, and the seven cross-tabulations were required to contain identical year coverage. All tables were then merged one-to-one by year. Missing structural categories were represented as zero only when the source table contained no reported count for that category.
A key validation step used the number-of-vehicles table. A crash involving k vehicles generates k vehicle records in the corresponding category. Therefore, the implied number of crashes in that category is the reported vehicle-record count divided by k. The reconstructed annual crash total is the sum across all vehicle-count categories:
where C_t is the reconstructed number of crashes in year t and V_kt is the number of vehicle records in crashes involving k vehicles. The reconstructed total matched the accident-severity total exactly in every year. The accident-severity total was therefore adopted as the validated annual crash count.
The collision-type total was lower than the validated crash total by one crash in 2000 and one crash in 2002. These two records were retained as unclassified collision type rather than assigned artificially. Small classification gaps were also present in selected casualty cross-tabulations. They were documented and retained as data-quality warnings, not redistributed.
2.3. Derived Indicators
The analysis distinguishes scale indicators from composition indicators. Scale indicators are total crashes, reference casualty records, involved-vehicle records, fatal crashes, pedestrian collisions, and pedestrian casualties. Composition indicators are fatal-crash share, fatal-or-grievous share, pedestrian casualty share, pedestrian-collision share, multi-vehicle crash share, at-junction casualty share, and no-fitness share among known fitness records. Vehicle complexity is additionally represented by mean vehicles per crash.
The reference casualty total was taken from the most complete casualty cross-tabulation. Pedestrian casualty share uses the classified casualty total as its denominator. The multi-vehicle crash count was reconstructed from the vehicle-distribution table and divided by the validated crash total. Mean vehicles per crash equals total involved-vehicle records divided by the reconstructed crash total.
2.4. Statistical Analysis
Descriptive statistics were calculated for each principal indicator, including the mean, standard deviation, range, first and last observed values, absolute change, and relative change. Linear temporal trends were estimated using ordinary least squares (OLS), with time expressed in decades from 1998 and inference based on HC3 heteroskedasticity-consistent standard errors. HC3 was selected because the analysis contains only 18 annual observations and observations at the beginning or end of a short time series may exert relatively high leverage. Compared with the HC0–HC2 estimators, HC3 applies a stronger leverage adjustment and is generally more reliable for finite-sample inference when heteroskedasticity may be present. Because annual series may also be influenced by outlying years and departures from normality, Mann–Kendall tests and Theil–Sen slopes were used as complementary non-parametric checks.
Annual crash counts are non-negative integers. Poisson regression provides a natural baseline model but assumes equality of the conditional mean and variance. Crash-frequency data commonly exhibit overdispersion because of unobserved heterogeneity and other sources of variation. For each count outcome, Poisson and negative binomial NB2 models were therefore estimated using the same log-linear time specification:
log[E(Yt)] = β0+β1Decadet(2)
The exponentiated time coefficient exp (β1) is reported as an incidence-rate ratio (IRR) per decade. Poisson dispersion statistics and Akaike's Information Criterion (AIC) were used to compare model adequacy. This modelling strategy follows established crash-frequency practice, in which negative binomial specifications are preferred when the Poisson mean–variance restriction is not credible.
For annual shares, grouped-binomial generalized linear models were estimated using the annual numbers of successes and trials. The exponentiated time coefficient is reported as an odds ratio (OR) per decade. This approach is appropriate for evaluating changes in aggregate composition but is not a substitute for individual-level severity modelling. When person- or crash-level observations are available, injury-severity studies commonly employ ordered, multinomial, or related discrete-response models.
Exploratory segmented regression was used to identify possible changes in temporal slope. Candidate breakpoints excluded the first and last four observations, and the breakpoint yielding the minimum Bayesian Information Criterion (BIC) was retained. The identified breakpoints around 2002 and 2006 also broadly coincide with potentially relevant changes in the road-safety and urban-transport policy environment. The 2002 period coincided with implementation of the National Road Safety Strategic Action Plan 2002–2004 and associated road-safety and urban traffic-management initiatives, including traffic management, intersection improvements, pedestrian facilities, enforcement, and road-safety measures. The 2006 breakpoint occurred shortly after preparation of the 2005 Strategic Transport Plan for Dhaka, which provided a broader framework for urban transport planning, public transport development, traffic management, and infrastructure improvement. These temporal correspondences are included only to provide institutional context and should not be interpreted as evidence that the identified policy initiatives caused the observed changes. Because the breakpoint was selected from the same 18-year series, the segmented models are interpreted descriptively rather than as causal intervention evaluations.
Spearman rank correlation was used to summarize monotonic co-movement among nine annual indicators. Principal component analysis (PCA) was subsequently applied to their standardized values to characterize the dominant multivariate temporal patterns. PCA scores and loadings were interpreted descriptively, recognizing that component signs are arbitrary. Statistical significance was evaluated at the 5% level; however, effect magnitudes, confidence intervals, model fit, and consistency across complementary analytical methods received greater interpretive weight than p-values alone.
3. Results and Discussion
3.1. Overall Temporal Changes in Crash Frequency and Casualties
The validated dataset contained 10,959 reported crashes, 12,470 casualty records, and 15,697 involved-vehicle records for Dhaka City during 1998–2015.
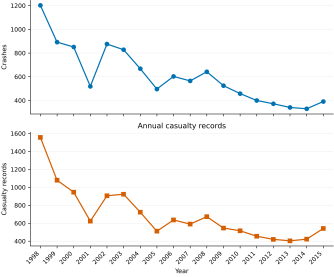
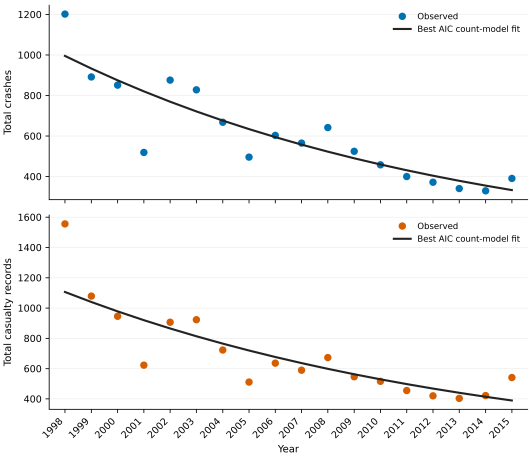
Figure 2 shows a pronounced long-term decline in both reported crash frequency and casualty records. Total crashes decreased from 1,202 in 1998 to 391 in 2015, representing a 67.5% reduction, while casualty records decreased from 1,556 to 541, equivalent to a 65.2% reduction. Involved-vehicle records declined even more sharply, by 73.8% over the same period.
Figure 2. Annual validated crash frequency and casualty records in Dhaka City, 1998–2015.
The decline was not uniform throughout the period. A rapid reduction occurred during the early years, followed by a temporary rebound around 2002 and lower but fluctuating values thereafter. Despite these annual variations, the long-term downward pattern remained statistically strong. As summarised in
Table 2, the reduction in total reported crashes was much greater than the decline in fatal crashes, indicating that the severity composition of the reported crash record changed substantially over time.
Table 2. Descriptive changes in principal indicators, 1998–2015.
Indicator | 1998 | 2015 | Change |
Reported crashes | 1,202 | 391 | −67.5% |
Casualty records | 1,556 | 541 | −65.2% |
Involved-vehicle records | 1,877 | 491 | −73.8% |
Fatal crashes | 399 | 290 | −27.3% |
Fatal-crash share | 33.2% | 74.2% | +41.0 pp |
Pedestrian casualty share | 35.9% | 59.4% | +23.6 pp |
Pedestrian-collision share | 41.0% | 71.4% | +30.3 pp |
Multi-vehicle crash share | 52.8% | 23.8% | −29.0 pp |
Mean vehicles per crash | 1.562 | 1.256 | −0.306 |
The robust trend estimates in
Table 3 confirm the descriptive pattern. Total crashes declined by an estimated 388.6 crashes per decade (95% CI: −536.8 to −240.3;
p < 0.001). The Mann–Kendall statistic was (\tau=-0.778), while the Theil–Sen estimator indicated an annual decline of approximately 38.5 crashes. Similar statistically significant reductions were observed for casualty records and involved-vehicle records.
Table 3. Robust temporal-trend estimates for selected indicators.
Indicator | OLS slope/decade | 95% CI | p | Kendall (\tau) | Theil–Sen slope/year |
Total crashes | −388.6 | −536.8 to −240.3 | <0.001 | −0.778 | −38.5 |
Casualty records | −451.4 | −698.7 to −204.1 | <0.001 | −0.725 | −39.0 |
Vehicle records | −643.0 | −887.6 to −398.5 | <0.001 | −0.817 | −59.7 |
Fatal crashes | −50.1 | −97.2 to −3.0 | 0.037 | −0.388 | −7.4 |
Fatal-crash share | +24.97 pp | +20.98 to +28.97 pp | <0.001 | +0.856 | +2.51 pp |
Pedestrian casualty share | +13.10 pp | +7.47 to +18.74 pp | <0.001 | +0.595 | +1.22 pp |
Pedestrian-collision share | +14.70 pp | +12.00 to +17.40 pp | <0.001 | +0.856 | +1.40 pp |
Multi-vehicle crash share | −13.44 pp | −16.36 to −10.53 pp | <0.001 | −0.843 | −1.33 pp |
Mean vehicles per crash | −0.137 | −0.172 to −0.103 | <0.001 | −0.765 | −0.014 |
The agreement among OLS, Mann–Kendall, and Theil–Sen estimates indicates that the declining frequency pattern is robust and not dependent on a single modelling assumption.
3.2. Collision-Type, Crash-Severity and Casualty-Class Composition
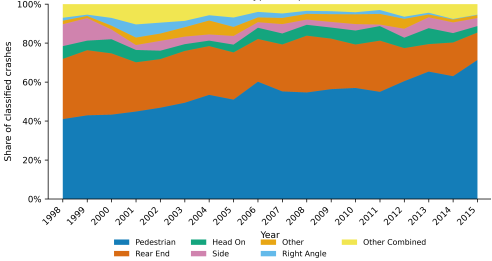
The annual collision-type distribution is presented in
Figure 3. Pedestrian collisions were the dominant category throughout much of the study period and accounted for approximately 51.5% of classified collision records when all years were combined.
Figure 3. Annual collision-type composition in Dhaka City, 1998–2015.
The most important temporal change was the increase in pedestrian-collision share from 41.0% in 1998 to 71.4% in 2015. As shown in
Table 3, the corresponding OLS trend was approximately +14.70 percentage points per decade (
p < 0.001). Thus, although pedestrian collisions declined in absolute number, they declined more slowly than the total crash count and consequently became increasingly dominant in the reported crash record.
Rear-end crashes remained the second-largest collision type, whereas head-on, side, right-angle, and other categories contributed much smaller proportions. This shift indicates that the reduction in reported crashes was not uniform across collision types and that pedestrian-related crashes became increasingly important within the overall crash composition.
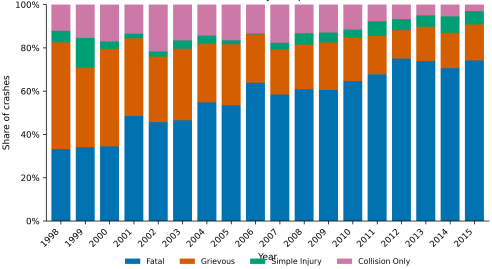
The evolution of crash severity is shown in
Figure 4. Across the entire study period, approximately 5,709 crashes were classified as fatal, accounting for about 52.1% of validated crashes.
Figure 4. Annual crash-severity composition.
Although the absolute number of fatal crashes declined from 399 to 290, the decline was much smaller than the reduction in total crashes. Consequently, fatal-crash share increased sharply from 33.2% in 1998 to 74.2% in 2015. The robust trend estimate in
Table 3 indicates an increase of approximately 24.97 percentage points per decade (
p < 0.001).
The result demonstrates a clear divergence between crash frequency and severity composition. A substantial decline in total reported crashes occurred simultaneously with a marked increase in the proportional representation of fatal crashes. Therefore, the observed reduction in frequency should not be interpreted as equivalent improvement in crash severity.
The annual distribution of casualties by road-user class is presented in
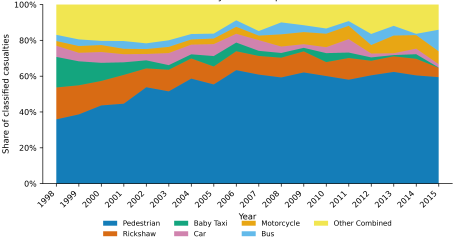
Figure 5. Pedestrians were the dominant casualty group, accounting for approximately 6,490 classified casualties, or about 52.1% of the classified casualty total.
Figure 5. Annual casualty-class composition in Dhaka City, 1998–2015.
Pedestrian casualties decreased in absolute number from 558 in 1998 to 321 in 2015; however, their share increased from 35.9% to 59.4%. As shown in
Table 3, the pedestrian casualty share increased by approximately 13.10 percentage points per decade.
The consistency between the collision-type pattern in
Figure 3 and the casualty-class pattern in
Figure 5 is notable. Both independently indicate increasing pedestrian concentration within the reported road-safety burden. This reinforces the need to interpret pedestrian safety as a central component of long-term road-safety change in Dhaka.
3.3. Junction Context
The annual casualty distribution according to junction type is presented in
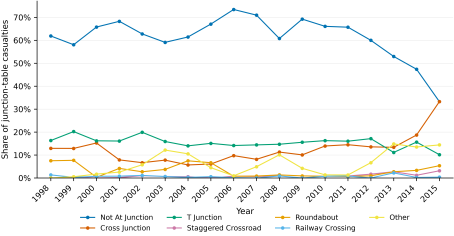
Figure 6. Most casualty records occurred at locations classified as not at a junction. Across the complete period, approximately 7,671 casualty records occurred outside junctions, compared with approximately 1,978 at T-junctions and 1,484 at cross junctions.
Figure 6. Annual casualty distribution by junction type in Dhaka City, 1998–2015.
Although the combined at-junction casualty share increased from approximately 38.1% in 1998 to 52.3% in 2015, the long-term OLS trend was not statistically significant. This suggests that the annual citywide data do not provide evidence of a consistent monotonic shift toward junction-related casualties. However, the result does not imply that individual junctions are unimportant; site-specific geometry, traffic control, exposure, and pedestrian activity cannot be captured adequately by annual citywide aggregation.
3.4. Vehicle Involvement and Vehicle Fitness Status
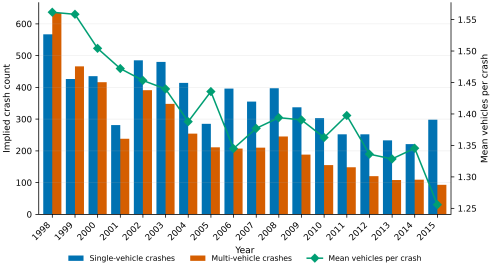
Most The reconstructed distribution of single- and multi-vehicle crashes is shown in
Figure 7. Across the study period, approximately 6,417 single-vehicle crashes and 4,542 multi-vehicle crashes were reconstructed from the vehicle-distribution table. The multi-vehicle crash share declined from 52.8% in 1998 to 23.8% in 2015, while mean vehicles per crash decreased from 1.562 to 1.256.
As shown in
Table 3, multi-vehicle crash share declined by approximately 13.44 percentage points per decade, and mean vehicles per crash declined by approximately 0.137 per decade. Both trends were statistically significant.
This result indicates a structural shift in the reported crash system. Earlier years were characterised by greater multi-vehicle involvement, whereas later years contained a higher proportional representation of crashes involving fewer vehicles, including pedestrian-related events.
Figure 7. Reconstructed single- and multi-vehicle crash involvement.
Figure 8. Fitness-certificate status in the reported subset.
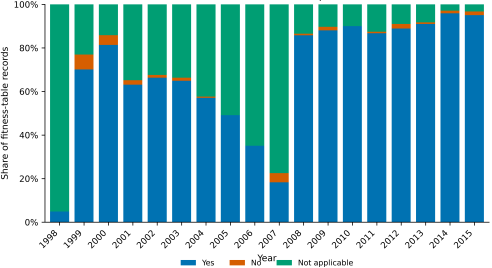
The annual fitness-certificate distribution is shown in
Figure 8.
Figure 8. Fitness-certificate composition of the reported vehicle subset, 1998–2015.
The majority of classified observations were recorded as either having a valid fitness certificate or as not applicable. The proportion coded as having no fitness certificate was comparatively small. However, because the fitness table represents only a subset of involved-vehicle records, the result cannot be interpreted as the prevalence of mechanically unfit vehicles in the entire Dhaka fleet.
Accordingly,
Figure 8 is treated as a descriptive supporting indicator rather than a population-level measure. More complete linkage between crash, registration, inspection, and enforcement databases would be required to assess the effect of vehicle fitness on crash occurrence or severity.
3.5. Collision-Share Heatmap
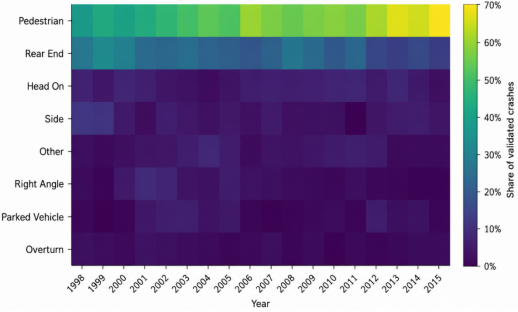
The temporal evolution of the leading collision-type shares is further illustrated in
Figure 9.
The heatmap provides a compact representation of the compositional transition identified in
Figure 3. Pedestrian collisions become progressively more prominent in later years, whereas several vehicle–vehicle collision categories generally account for smaller proportions of the annual total.
Because
Figure 9 presents shares rather than absolute counts, it highlights structural change within the crash record. The increasing pedestrian intensity does not indicate that pedestrian crash counts continuously increased; instead, pedestrian collisions became a larger fraction of a declining overall crash total.
Figure 9. Heatmap of leading collision-type shares.
3.6. Correlation Structure
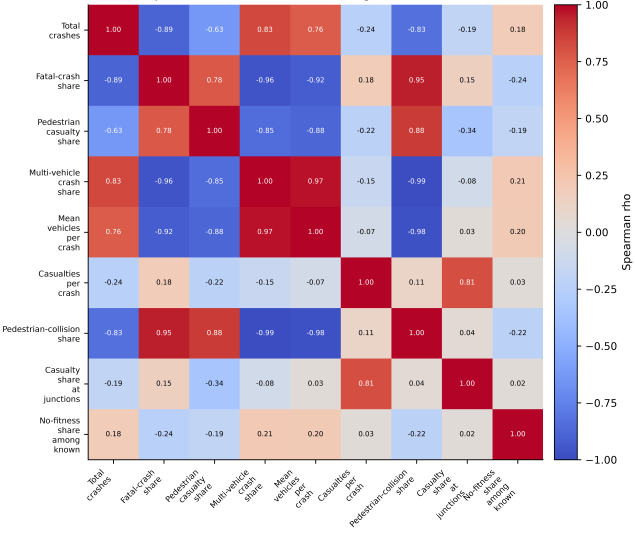
The relationships among the principal annual indicators are shown in
Figure 10, while selected correlation coefficients are summarised in
Table 4.
Table 4. Selected Spearman rank correlations.
Indicator A | Indicator B | (\rho) |
Total crashes | Fatal-crash share | −0.891 |
Total crashes | Pedestrian casualty share | −0.633 |
Total crashes | Multi-vehicle crash share | +0.833 |
Total crashes | Pedestrian-collision share | −0.833 |
Fatal-crash share | Multi-vehicle crash share | −0.957 |
Fatal-crash share | Pedestrian-collision share | +0.948 |
Multi-vehicle crash share | Pedestrian-collision share | −0.990 |
Figure 10. Observed annual counts and best-fitting temporal count-model curves.
Total crashes were strongly negatively associated with fatal-crash share and pedestrian-collision share but positively associated with multi-vehicle crash share. The strongest relationship was observed between multi-vehicle crash share and pedestrian-collision share ((\rho=-0.990)).
These correlations support the interpretation of a common temporal transition: years with lower crash totals and lower multi-vehicle involvement tended to have greater fatal and pedestrian concentration. However, because the indicators share strong time trends, the correlations should be interpreted descriptively rather than causally.
3.7. Count-Model Results
The observed annual counts and fitted Poisson and negative binomial models are presented in
Figure 11. Numerical estimates are summarised in
Table 5.
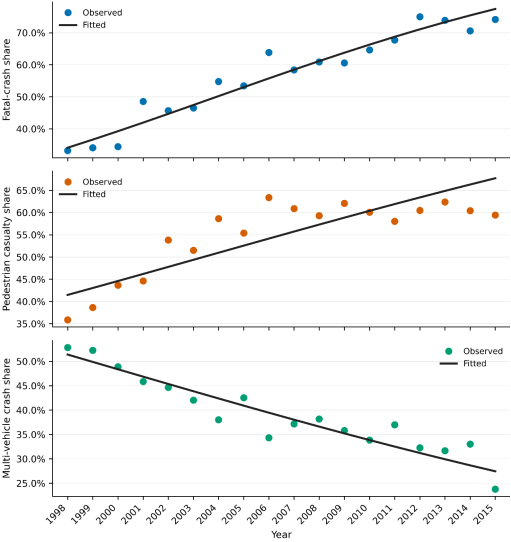
Figure 11. Observed and fitted grouped-binomial temporal shares.
Table 5. Poisson and negative binomial NB2 count-model results.
Outcome | Model | IRR/decade | 95% CI | p | AIC | Poisson dispersion |
Total crashes | Poisson | 0.521 | 0.450–0.602 | <0.001 | 431.4 | 16.65 |
Total crashes | NB2 | 0.525 | 0.459–0.602 | <0.001 | 218.1 | — |
Casualty records | Poisson | 0.513 | 0.412–0.639 | <0.001 | 583.7 | 27.06 |
Casualty records | NB2 | 0.541 | 0.445–0.658 | <0.001 | 228.0 | — |
Vehicle records | Poisson | 0.468 | 0.402–0.544 | <0.001 | 572.8 | 24.65 |
Vehicle records | NB2 | 0.476 | 0.416–0.544 | <0.001 | 230.2 | — |
Fatal crashes | Poisson | 0.854 | 0.755–0.965 | 0.012 | 273.1 | 8.22 |
Fatal crashes | NB2 | 0.848 | 0.747–0.963 | 0.011 | 196.1 | — |
Pedestrian collisions | Poisson | 0.693 | 0.599–0.803 | <0.001 | 298.2 | 9.43 |
Pedestrian collisions | NB2 | 0.694 | 0.598–0.805 | <0.001 | 198.7 | — |
The Poisson dispersion statistics ranged from 8.22 to 27.06, indicating substantial overdispersion. The NB2 specification produced much lower AIC values for every outcome and was therefore preferred.
For total crashes, the NB2 IRR was 0.525 per decade (95% CI: 0.459–0.602), corresponding to an estimated 47.5% decline in the fitted expected reported crash count per decade. The fatal-crash IRR was 0.848, while the pedestrian-collision IRR was 0.694. Therefore, fatal crashes and pedestrian collisions declined considerably more slowly than the total crash count, providing a model-based explanation for their increasing proportional shares.
3.8. Grouped-Binomial Trends
The observed and fitted proportional trends are presented in
Figure 12, with the corresponding model results reported in
Table 6.
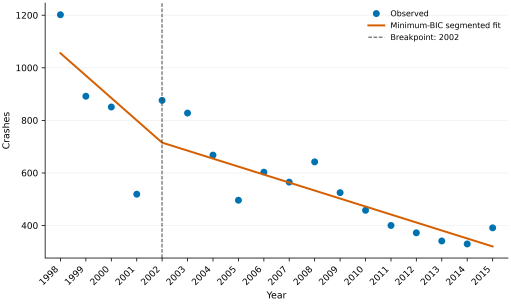
Figure 12. Exploratory segmented regression of annual crash frequency.
Table 6. Grouped-binomial temporal models.
Outcome share | OR/decade | 95% CI | p | Direction |
Fatal-crash share | 3.044 | 2.695–3.437 | <0.001 | Increase |
Fatal-or-grievous share | 1.560 | 1.174–2.075 | 0.002 | Increase |
Pedestrian casualty share | 1.893 | 1.534–2.337 | <0.001 | Increase |
Multi-vehicle crash share | 0.546 | 0.498–0.599 | <0.001 | Decrease |
No-fitness share among known | 0.222 | 0.116–0.427 | <0.001 | Decrease within subset |
As shown in
Figure 12 and
Table 6, the odds that a reported crash was fatal increased by approximately a factor of 3.04 per decade, while the odds that a classified casualty was a pedestrian increased by approximately 1.89 times per decade. In contrast, the odds of a crash being multi-vehicle decreased substantially, with an OR of 0.546 per decade.
These results confirm that absolute and proportional trends moved differently. Fatal and pedestrian-related counts generally declined, but their relative shares increased because the corresponding totals declined more rapidly.
3.9. Exploratory Segmented Regression
The segmented temporal model for total crash frequency is presented in
Figure 13. The minimum-BIC breakpoint for total crashes occurred in 2002. The fitted pre-break slope was approximately −85.1 crashes per year, compared with approximately −30.4 crashes per year after the breakpoint. Although the visual pattern suggests that the rate of decline became less steep after 2002, the estimated slope change was not statistically significant.
For fatal-crash share and pedestrian casualty share, an exploratory breakpoint was identified around 2006. Fatal-crash share continued to rise after this point but at a slower fitted rate, whereas pedestrian casualty share became approximately stable after a strong pre-2006 increase.
These breakpoints should be treated as exploratory. Without information on specific interventions, traffic exposure, reporting-system changes, or enforcement programmes, they cannot be interpreted as causal policy effects.
Figure 13. Spearman rank-correlation matrix for principal annual indicators.
3.10. Exploratory Segmented Regression
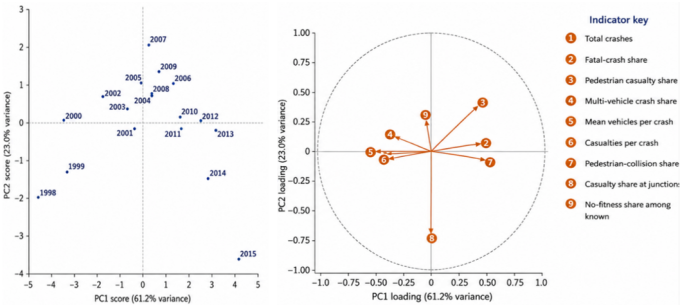
The multivariate structure of the annual indicators is presented in
Figure 14.
Table 7.
PC1 explained 61.2% of the standardised annual variation. Fatal-crash share, pedestrian-collision share, and pedestrian casualty share loaded strongly in one direction, while total crashes, multi-vehicle share, and mean vehicles per crash loaded in the opposite direction.
PC2 explained 23.0% and was primarily associated with casualty intensity and junction context. Together, PC1 and PC2 explained 84.2% of the total standardised variation.
The PCA therefore confirms that the main results do not represent isolated one-variable changes. Instead, the decline in crash frequency, reduction in vehicle complexity, and increasing fatal and pedestrian concentration form a common multivariate temporal pattern.
Figure 14. PCA scores, numbered loading vectors, and indicator key.
The combined evidence from
Figures 2-14 and
Tables 2-6 demonstrates a clear structural transition in Dhaka's reported road-safety profile between 1998 and 2015. The overall scale of the recorded crash problem decreased substantially, as shown by declining crash, casualty, and involved-vehicle counts. However, fatal crashes and pedestrian-related outcomes declined much more slowly than the corresponding totals, resulting in strong increases in their proportional representation.
The reported crash system therefore evolved from an earlier higher-frequency and more multi-vehicle profile toward a later lower-frequency but more fatal- and pedestrian-concentrated profile. This conclusion is supported sequentially by the frequency trends in
Figure 2, collision-type changes in
Figure 3, severity composition in
Figure 4, casualty composition in
Figure 5, junction context in
Figure 6, vehicle involvement in
Figure 7, fitness information in
Figure 8, collision-share structure in
Figure 9, correlation patterns in
Figure 10, count-model evidence in
Figure 11, grouped-binomial trends in
Figure 12, exploratory breakpoint analysis in
Figure 13, and multivariate confirmation in
Figure 14.
Taken together, the results indicate that road-safety performance in Dhaka should not be evaluated solely through total reported crash counts. Greater attention should be directed toward fatal and serious-injury prevention, pedestrian protection, urban speed management, safer junctions and crossings, public-transport interfaces, vehicle safety, and improvement of crash-data quality. A linked geo-referenced database integrating crash, casualty, vehicle, hospital, roadway, and exposure information would allow future analyses to distinguish changes in underlying road-safety risk from changes in reporting completeness.
4. Findings, Policy and Engineering Implications, Limitations and Future Works
4.1. Findings
The results reveal a clear long-term restructuring of Dhaka’s reported road-safety profile rather than a uniform improvement across all indicators. The principal findings are summarised as follows:
1) Strong decline in reported crash frequency
Reported crashes decreased substantially between 1998 and 2015, accompanied by comparable reductions in casualty and involved-vehicle records. The negative binomial models confirmed a statistically significant downward trend and provided substantially better fit than the Poisson models because of pronounced overdispersion. This long-term decline is consistent with earlier Dhaka studies that also reported reductions in police-recorded crash frequency over shorter periods
| [10] | Siraj, M. S. B., Rabbi, F., Islam, M. J., Asma, M. S. Road Accident Analysis: A Case Study Dhaka Metropolitan Area. Journal of Transportation Systems. 2021, 6(3), 48–54. |
| [17] | Ahmed, I., Ahmed, B., Hainin, M. R. Road Traffic Accident Characteristics in Dhaka, Bangladesh. Jurnal Teknologi. 2014, 71(3), 75–82. https://doi.org/10.11113/jt.v71.3763 |
[10, 17]
.
2) Increasing concentration of fatal outcomes
Although the absolute number of fatal crashes declined, it decreased much more slowly than total crash frequency. Consequently, the fatal-crash share increased from 33.2% to 74.2%, and the grouped-binomial model indicated a strong positive temporal trend. The result demonstrates that declining crash frequency did not produce an equivalent reduction in the severity composition of reported crashes.
3) Increasing pedestrian dominance
Pedestrian collisions and pedestrian casualties became increasingly prominent within the annual crash record. Pedestrian-collision share increased from 41.0% to 71.4%, while pedestrian casualty share increased from 35.9% to 59.4%. This finding is consistent with previous Dhaka research identifying pedestrians as a particularly vulnerable road-user group
| [11] | Uddin, M. I., Raihan, M. A., Mahmud, S. M. S., Pervaz, S. Road Safety Status of Dhaka City: What Does Our Data Tell Us and Priorities for the Way Forward. In Proceedings of the 5th International Conference on Advances in Civil Engineering (ICACE 2020), CUET, Chattogram, Bangladesh, 4–6 March 2021. No publisher DOI identified. |
| [14] | Rifaat, S. M., Tay, R., Raihan, S. M., Fahim, A., Touhidduzzaman, S. M. Vehicle-Pedestrian Crashes at Intersections in Dhaka City. The Open Transportation Journal. 2017, 11, 11–19. https://doi.org/10.2174/1874447801711010011 |
| [16] | Ahmad, M., Rahman, F. N., Ali, M., Al-Azad, M. A. S. Road Traffic Injury among Pedestrians in Dhaka City. Journal of Armed Forces Medical College, Bangladesh. 2016, 12(1), 3–7. https://doi.org/10.3329/jafmc.v12i1.39948 |
| [20] | Rahaman, K. R., Hossain, M. Z., Rahman, M. A., Afrin, S. Pedestrian’s Accidents and Awareness: A Study of Dhaka City, Bangladesh. Khulna University Studies. 2008, 9(2), 173–180. https://doi.org/10.53808/KUS.2008.9.2.0813-E |
[11, 14, 16, 20]
.
4) Declining multi-vehicle involvement
Multi-vehicle crash share decreased from 52.8% to 23.8%, while the mean number of vehicles per crash also declined. The strong inverse correlation between multi-vehicle share and pedestrian-collision share suggests a gradual shift from a vehicle–vehicle-dominated crash structure toward a reported crash profile containing a larger proportion of pedestrian-related and lower-vehicle-count events.
5) Consistent evidence across statistical methods
The central findings were supported by descriptive statistics, HC3-robust OLS models, Mann–Kendall tests, Theil–Sen slopes, NB2 count models, grouped-binomial regression, segmented regression, Spearman correlation, and PCA. The first two principal components explained 84.2% of total standardised variation, confirming that declining frequency, decreasing vehicle complexity, and increasing fatal and pedestrian concentration formed a coherent multivariate temporal pattern.
4.2. Policy and Engineering Implications
The findings indicate that road-safety performance in Dhaka should not be evaluated solely on the basis of total reported crash counts. A Safe System-oriented response should prioritise the prevention of fatal and serious injuries, particularly among pedestrians. The principal implications are:
1) Pedestrian protection and safer street design
The increasing pedestrian share supports greater investment in continuous unobstructed footways, safe at-grade crossings, pedestrian refuge islands, improved lighting, shorter crossing distances, protected signal phases, safer access to public-transport stops, and traffic-calmed environments near schools, markets, and activity centres. These measures are consistent with earlier Dhaka studies highlighting inadequate pedestrian infrastructure and intersection-related pedestrian risk
| [14] | Rifaat, S. M., Tay, R., Raihan, S. M., Fahim, A., Touhidduzzaman, S. M. Vehicle-Pedestrian Crashes at Intersections in Dhaka City. The Open Transportation Journal. 2017, 11, 11–19. https://doi.org/10.2174/1874447801711010011 |
| [16] | Ahmad, M., Rahman, F. N., Ali, M., Al-Azad, M. A. S. Road Traffic Injury among Pedestrians in Dhaka City. Journal of Armed Forces Medical College, Bangladesh. 2016, 12(1), 3–7. https://doi.org/10.3329/jafmc.v12i1.39948 |
| [20] | Rahaman, K. R., Hossain, M. Z., Rahman, M. A., Afrin, S. Pedestrian’s Accidents and Awareness: A Study of Dhaka City, Bangladesh. Khulna University Studies. 2008, 9(2), 173–180. https://doi.org/10.53808/KUS.2008.9.2.0813-E |
[14, 16, 20]
.
2) Speed management, junction safety, and public-transport interfaces
The increasing concentration of fatal crashes indicates the need to reduce high-energy conflicts through credible speed limits, self-enforcing street design, speed monitoring, safer junction geometry, improved turning control, and targeted enforcement. High-risk corridors and intersections identified through GIS-based screening should receive detailed road-safety audits and site-specific treatments
| [12] | Ahmad, A. U., Hossain, K. T., Hossain, M. A. Identification of Urban Traffic Accident Hotspot Zones Using GIS: A Case Study of Dhaka Metropolitan Area. Journal of Geographical Studies. 2019, 3(1), 36–42.
https://doi.org/10.21523/gcj5.19030104 |
| [18] | Ahmed, I., Ahmed, B., Hainin, M. R. High-Risk Road Accident Corridors in Dhaka, Bangladesh. Jurnal Teknologi. 2013, 65(3), 61–65. https://doi.org/10.11113/jt.v65.2147 |
[12, 18]
. Public-transport stops should also be designed to reduce conflicts between buses, pedestrians, and through traffic.
3) Integrated vehicle, crash, and exposure data systems
Vehicle inspection and commercial-fleet management should be strengthened, but the fitness-certificate subset used in this study is insufficient for estimating fleet-wide compliance. A modern road-safety database should integrate police, hospital, vehicle-registration, inspection, roadway, and geographic information using unique crash identifiers. Traffic and pedestrian exposure should also be incorporated so that future analysis can estimate risk rather than reported counts alone.
4.3. Limitations
The study has three principal limitations:
1) Aggregated annual data
The analysis is based on 18 annual observations rather than individual crash, vehicle, or casualty records. Consequently, the models cannot estimate person-level injury severity or control for crash-specific characteristics such as age, speed, road geometry, weather, collision mechanism, or driver behaviour.
2) Absence of exposure and reporting-completeness information
Traffic volume, vehicle-kilometres travelled, pedestrian exposure, population, and road-network supply were unavailable. The models therefore estimate trends in reported counts rather than exposure-adjusted crash risk. In addition, administrative reporting may vary over time and by severity; previous Dhaka research has documented under-reporting concerns, particularly for less-severe crashes
.
3) Limited causal interpretation
Time is the primary explanatory variable, and specific infrastructure, enforcement, policy, economic, or institutional interventions are not explicitly modelled. The segmented-regression breakpoints and observed associations should therefore be interpreted as exploratory temporal patterns rather than causal intervention effects.
4.4. Future Works
Three research priorities follow directly from these limitations:
1) Development of crash-level severity and frequency models
Future studies should use linked crash-, vehicle-, and casualty-level data to estimate multinomial, ordered, mixed, or random-parameter severity models. Such analyses could incorporate road class, collision type, junction characteristics, vehicle type, speed, weather, and road-user characteristics, extending recent Dhaka modelling efforts
| [5] | Islam, F., Saad, M. E., Raihan, M. A., Hadiuzzaman, M. Assessment of Key Contributing Factors to Motorcycle Crash Severity in Dhaka City Through Comparative Modeling Approach. In Proceedings of the 8th International Conference on Civil Engineering for Sustainable Development (ICCESD 2026), Khulna University of Engineering & Technology (KUET), Khulna, Bangladesh, 5–7 February 2026. |
| [14] | Rifaat, S. M., Tay, R., Raihan, S. M., Fahim, A., Touhidduzzaman, S. M. Vehicle-Pedestrian Crashes at Intersections in Dhaka City. The Open Transportation Journal. 2017, 11, 11–19. https://doi.org/10.2174/1874447801711010011 |
[5, 14]
.
2) Exposure-based and spatial road-safety analysis
Vehicle and pedestrian volumes, operating speeds, road geometry, land use, traffic control, bus-stop activity, and roadway characteristics should be linked to geo-referenced crash records. This would support segment- and intersection-level frequency models, hotspot identification, and more reliable network screening
| [12] | Ahmad, A. U., Hossain, K. T., Hossain, M. A. Identification of Urban Traffic Accident Hotspot Zones Using GIS: A Case Study of Dhaka Metropolitan Area. Journal of Geographical Studies. 2019, 3(1), 36–42.
https://doi.org/10.21523/gcj5.19030104 |
| [18] | Ahmed, I., Ahmed, B., Hainin, M. R. High-Risk Road Accident Corridors in Dhaka, Bangladesh. Jurnal Teknologi. 2013, 65(3), 61–65. https://doi.org/10.11113/jt.v65.2147 |
[12, 18]
.
3) Under-reporting and intervention-effectiveness assessment
Police crash records should be linked with hospital, emergency-service, insurance, and other independent sources to quantify reporting completeness by severity and road-user type. Once reliable long-term and site-specific data become available, controlled before–after, empirical-Bayes, or interrupted time-series methods should be applied to evaluate the effectiveness of engineering, enforcement, and policy interventions.
5. Conclusions
This study developed a validated long-term statistical assessment of reported road crashes, casualty patterns, and vehicle involvement in Dhaka City using annual aggregated data for 1998–2015 obtained from ARI, BUET. The analysis showed that the scale of the reported crash problem declined substantially over the study period: total crashes fell by 67.5%, casualty records by 65.2%, and involved-vehicle records by 73.8%. Negative binomial NB2 models consistently outperformed Poisson models, confirming substantial overdispersion in the annual count data and providing a more appropriate representation of temporal crash-frequency variation.
Despite the decline in overall frequency, the severity composition changed in the opposite direction. Fatal-crash share increased from 33.2% to 74.2%, pedestrian casualty share increased from 35.9% to 59.4%, and pedestrian-collision share increased from 41.0% to 71.4%. At the same time, multi-vehicle crash share decreased from 52.8% to 23.8%, and the mean number of vehicles per crash declined. The combined evidence therefore indicates a transition from an earlier higher-frequency and more multi-vehicle crash profile toward a later lower-frequency but more fatal- and pedestrian-concentrated reported crash structure.
The consistency of results across OLS with HC3 robust standard errors, Mann–Kendall tests, Theil–Sen slopes, NB2 models, grouped-binomial models, segmented regression, Spearman correlation, and PCA strengthens the reliability of the main temporal findings. In particular, the PCA results showed that the first two principal components explained 84.2% of the standardised annual variation, confirming that declining crash frequency, decreasing vehicle complexity, and increasing fatal and pedestrian concentration formed a coherent multivariate pattern rather than isolated changes.
These findings demonstrate that road-safety performance in Dhaka should not be evaluated solely by total reported crash counts. Greater emphasis is required on fatal and serious-injury prevention, pedestrian protection, urban speed management, safer junctions and crossings, improved public-transport interfaces, vehicle safety, and stronger post-crash response. Equally important is the development of an integrated, geo-referenced crash database linking police, hospital, vehicle, roadway, and exposure information. Such improvements would allow future studies to distinguish genuine changes in road-safety risk from changes in reporting completeness and to support more robust exposure-based and crash-level modelling.
Because the present study is based on annual aggregated records without direct exposure measures or individual crash-level covariates, the results should be interpreted as temporal associations in the reported crash system rather than causal or exposure-adjusted risk estimates. Nevertheless, the analysis provides strong evidence that Dhaka’s road-safety challenge has changed in structure over time and that future policy should focus not only on reducing crash frequency, but also on reducing the concentration of fatal and pedestrian-involved outcomes.
Abbreviations
AIC | Akaike Information Criterion |
ARI | Accident Research Institute |
ARF | Accident Report Form |
BUET | Bangladesh University of Engineering and Technology |
DMP | Dhaka Metropolitan Police |
GLM | Generalized Linear Model |
HC3 | Heteroskedasticity-consistent Covariance Estimator, Type 3 |
IRR | Incidence-Rate Ratio |
NB2 | Negative Binomial Model with Quadratic Variance |
OLS | Ordinary Least Squares |
OR | Odds Ratio |
PCA | Principal Component Analysis |
Acknowledgments
The authors gratefully acknowledge the Accident Research Institute (ARI), Bangladesh University of Engineering and Technology (BUET), for the road-accident data used in this research. The authors also acknowledge the Department of Civil Engineering, Ahsanullah University of Science and Technology (AUST), Dhaka, Bangladesh, for academic and research support. The interpretations and conclusions are those of the authors and do not imply endorsement by the data-providing institutions.
Author Contributions
Md Arif Azad: Conceptualization, Data curation, Formal Analysis, Investigation, Methodology, Software, Validation, Visualization, Writing – original draft, Writing – review & editing
Sree Pradip Kumer Sarker: Conceptualization, Data curation, Formal Analysis, Methodology, Software, Validation, Visualization, Writing – original draft, Writing – review & editing
Md Shahid Mamun: Conceptualization, Interpretation, Methodology, Supervision, Writing – review & editing
Data Availability Statement
The numerical results reported in this article were derived from annual road-accident, casualty and vehicle datasets supplied as ARI, BUET data. The processed analytical dataset and Python code may be shared by the corresponding author subject to the access and redistribution conditions of the original data custodian.
Conflicts of Interest
The authors declare no conflicts of interest.
References
| [1] |
Imran, M. I. A., Rakib, S., Uddin, M. N., Khan, A., Jannat, S. R., Talukder, E. Traffic Analysis and Driver Behavior Study in Highly Populated City of Low-Income Economies: A Statistical Approach. Transportation Research Interdisciplinary Perspectives. 2026, 36, 101838.
https://doi.org/10.1016/j.trip.2026.101838
|
| [2] |
Damene, M. T., Abdullah, M., Al-Ahmadi, H., Basheer, M. A. Modeling Driver-Caused Road Crash Severity Using SHAP-Enhanced Machine Learning. Transportation Research Procedia. 2026, 96, 348–355.
https://doi.org/10.1016/j.trpro.2026.04.002
|
| [3] |
Azad, I. I., Ahmed, A., Rahman, M. S. N. Mobility and Safety in School Transportation: A Case Study of Dhaka. In Proceedings of the 6th Annual Paper Meet of Civil Engineering Division of Institution of Engineers, Bangladesh (APMCE 2026), IEB Headquarters, Ramna, Dhaka, Bangladesh, 11–12 July 2026.
|
| [4] |
Naher, L., Begum, J., Begum, H., Rahman, M. J. Death Due to Road Traffic Accidents: A Forensic Study in Bangladesh. Community Based Medical Journal. 2026, 15(2), 239–245.
https://doi.org/10.3329/cbmj.v15i2.91495
|
| [5] |
Islam, F., Saad, M. E., Raihan, M. A., Hadiuzzaman, M. Assessment of Key Contributing Factors to Motorcycle Crash Severity in Dhaka City Through Comparative Modeling Approach. In Proceedings of the 8th International Conference on Civil Engineering for Sustainable Development (ICCESD 2026), Khulna University of Engineering & Technology (KUET), Khulna, Bangladesh, 5–7 February 2026.
|
| [6] |
Dina, F. A., Manik, M. H., Mahmud, S. Urban Road Accident Scenarios in Dhaka Metropolitan Area. Journal of Transportation Systems. 2024, 9(1), 8–23.
https://doi.org/10.46610/JoTS.2024.v09i01.002
|
| [7] |
Ali, Y., Rafay, M., Khan, R. D. A., Sorn, M. K., Jiang, H. Traffic Problems in Dhaka City: Causes, Effects, and Solutions (Case Study to Develop a Business Model). Open Access Library Journal. 2023, 10(5), 1–15.
https://doi.org/10.4236/oalib.1109994
|
| [8] |
Ghani, M., Huq, A. S., Meherin, S. Causative Factors to the Unauthorized Vehicle Fatal Accidents in Dhaka Metropolitan City. In Proceedings of the 6th International Conference on Civil Engineering for Sustainable Development (ICCESD 2022), Khulna University of Engineering & Technology (KUET), Khulna, Bangladesh, 10–12 February 2022.
|
| [9] |
Monia, S. H. Road Safety in Dhaka: Challenge for Sustainable Development. Tourism and Sustainable Development Review. 2021, 2(1), 72–84.
https://doi.org/10.31098/tsdr.v2i1.19
|
| [10] |
Siraj, M. S. B., Rabbi, F., Islam, M. J., Asma, M. S. Road Accident Analysis: A Case Study Dhaka Metropolitan Area. Journal of Transportation Systems. 2021, 6(3), 48–54.
|
| [11] |
Uddin, M. I., Raihan, M. A., Mahmud, S. M. S., Pervaz, S. Road Safety Status of Dhaka City: What Does Our Data Tell Us and Priorities for the Way Forward. In Proceedings of the 5th International Conference on Advances in Civil Engineering (ICACE 2020), CUET, Chattogram, Bangladesh, 4–6 March 2021. No publisher DOI identified.
|
| [12] |
Ahmad, A. U., Hossain, K. T., Hossain, M. A. Identification of Urban Traffic Accident Hotspot Zones Using GIS: A Case Study of Dhaka Metropolitan Area. Journal of Geographical Studies. 2019, 3(1), 36–42.
https://doi.org/10.21523/gcj5.19030104
|
| [13] |
Rahman, A., Hoque, A. K. M. F. Traffic Congestion in Dhaka City: Potential Solutions. European Journal of Social Sciences Studies. 2018, 2(12), 121–136.
https://doi.org/10.46827/ejsss.v0i0.371
|
| [14] |
Rifaat, S. M., Tay, R., Raihan, S. M., Fahim, A., Touhidduzzaman, S. M. Vehicle-Pedestrian Crashes at Intersections in Dhaka City. The Open Transportation Journal. 2017, 11, 11–19.
https://doi.org/10.2174/1874447801711010011
|
| [15] |
Chowdhury, T. U., Raihan, S. M., Fahim, A., Bhuiyan, M. A. A Case Study on Reduction of Traffic Congestion of Dhaka City: Banani Intersection. In Proceedings of the International Conference on Agricultural, Civil and Environmental Engineering (ACEE-16), Istanbul, Turkey, 18–19 April 2016; pp. 59–65.
https://doi.org/10.17758/URUAE.AE0416238
|
| [16] |
Ahmad, M., Rahman, F. N., Ali, M., Al-Azad, M. A. S. Road Traffic Injury among Pedestrians in Dhaka City. Journal of Armed Forces Medical College, Bangladesh. 2016, 12(1), 3–7.
https://doi.org/10.3329/jafmc.v12i1.39948
|
| [17] |
Ahmed, I., Ahmed, B., Hainin, M. R. Road Traffic Accident Characteristics in Dhaka, Bangladesh. Jurnal Teknologi. 2014, 71(3), 75–82.
https://doi.org/10.11113/jt.v71.3763
|
| [18] |
Ahmed, I., Ahmed, B., Hainin, M. R. High-Risk Road Accident Corridors in Dhaka, Bangladesh. Jurnal Teknologi. 2013, 65(3), 61–65.
https://doi.org/10.11113/jt.v65.2147
|
| [19] |
Siddique, A., Iffat, S., Islam, M. M. Effects of Car Involvement in Congestion and Road Accident in Dhaka City: A Study on Sustainable Solutions. In Proceedings of the 1st International Conference on Civil Engineering for Sustainable Development (ICCESD-2012), KUET, Khulna, Bangladesh, 23–24 March 2012.
|
| [20] |
Rahaman, K. R., Hossain, M. Z., Rahman, M. A., Afrin, S. Pedestrian’s Accidents and Awareness: A Study of Dhaka City, Bangladesh. Khulna University Studies. 2008, 9(2), 173–180.
https://doi.org/10.53808/KUS.2008.9.2.0813-E
|
Cite This Article
-
APA Style
Azad, M. A., Sarker, S. P. K., Mamun, M. S. (2026). Temporal Dynamics and Statistical Modelling of Road Crash Frequency, Severity Composition, and Vehicle Involvement in Dhaka City of Bangladesh. American Journal of Traffic and Transportation Engineering, 11(5), 91-109. https://doi.org/10.11648/j.ajtte.20261105.12
 Copy
|
Copy
|
 Download
ACS Style
Azad, M. A.; Sarker, S. P. K.; Mamun, M. S. Temporal Dynamics and Statistical Modelling of Road Crash Frequency, Severity Composition, and Vehicle Involvement in Dhaka City of Bangladesh. Am. J. Traffic Transp. Eng. 2026, 11(5), 91-109. doi: 10.11648/j.ajtte.20261105.12
Copy
|
Download
AMA Style
Azad MA, Sarker SPK, Mamun MS. Temporal Dynamics and Statistical Modelling of Road Crash Frequency, Severity Composition, and Vehicle Involvement in Dhaka City of Bangladesh. Am J Traffic Transp Eng. 2026;11(5):91-109. doi: 10.11648/j.ajtte.20261105.12
Copy
|
Download
-
@article{10.11648/j.ajtte.20261105.12,
  author = {Md Arif Azad and Sree Pradip Kumer Sarker and Md Shahid Mamun},
  title = {Temporal Dynamics and Statistical Modelling of Road Crash Frequency, Severity Composition, and Vehicle Involvement in Dhaka City of Bangladesh},
  journal = {American Journal of Traffic and Transportation Engineering},
  volume = {11},
  number = {5},
  pages = {91-109},
  doi = {10.11648/j.ajtte.20261105.12},
  url = {https://doi.org/10.11648/j.ajtte.20261105.12},
  eprint = {https://article.sciencepublishinggroup.com/pdf/10.11648.j.ajtte.20261105.12},
  abstract = {Dhaka's road-safety burden is shaped not only by the number of reported crashes but also by changes in severity, pedestrian involvement, and the number of vehicles participating in each event. This study develops an internally validated annual time series from road-accident, casualty, and vehicle cross-tabulations for Dhaka City for 1998-2015, supplied as data from the Accident Research Institute (ARI), Bangladesh University of Engineering and Technology (BUET). The harmonised record contains 10,959 reported crashes, 12,470 casualty records, and 15,697 involved-vehicle records. Data quality was assessed by reconciling independent table totals and reconstructing crash counts from the vehicle-distribution table. Temporal behaviour was evaluated using descriptive statistics, ordinary least squares with HC3 robust standard errors, Mann-Kendall and Theil-Sen trend estimators, Poisson and negative binomial NB2 count models, grouped binomial logistic models, segmented regression, Spearman correlation, and principal component analysis (PCA). Reported crashes decreased from 1,202 in 1998 to 391 in 2015 (-67.5%), casualty records decreased by 65.2%, and involved-vehicle records decreased by 73.8%. Strong Poisson overdispersion (8.22-27.06) favoured NB2 models; the crash-frequency NB2 incidence-rate ratio was 0.525 per decade (95% CI: 0.459-0.602). However, the fatal-crash share rose from 33.2% to 74.2% (grouped-binomial OR = 3.044 per decade), the pedestrian casualty share rose from 35.9% to 59.4%, and the pedestrian-collision share rose from 41.0% to 71.4%. Conversely, the multi-vehicle crash share fell from 52.8% to 23.8%, and mean vehicles per crash declined from 1.562 to 1.256. The first two principal components explained 84.2% of standardised annual variation. Overall, the findings indicate a transition from a higher-frequency, multi-vehicle crash profile toward a lower-frequency but more fatal- and pedestrian-concentrated reported crash structure. These results support prioritising pedestrian protection, speed management, safer junctions and public-transport interfaces, and stronger integrated crash-data systems in Dhaka. Because exposure denominators and crash-level covariates were unavailable, the results should be interpreted as temporal associations in reported events rather than causal or exposure-adjusted risk estimates.},
 year = {2026}
}
Copy
|
Download
-
TY  - JOUR
T1  - Temporal Dynamics and Statistical Modelling of Road Crash Frequency, Severity Composition, and Vehicle Involvement in Dhaka City of Bangladesh
AU  - Md Arif Azad
AU  - Sree Pradip Kumer Sarker
AU  - Md Shahid Mamun
Y1  - 2026/09/15
PY  - 2026
N1  - https://doi.org/10.11648/j.ajtte.20261105.12
DO  - 10.11648/j.ajtte.20261105.12
T2  - American Journal of Traffic and Transportation Engineering
JF  - American Journal of Traffic and Transportation Engineering
JO  - American Journal of Traffic and Transportation Engineering
SP  - 91
EP  - 109
PB  - Science Publishing Group
SN  - 2578-8604
UR  - https://doi.org/10.11648/j.ajtte.20261105.12
AB  - Dhaka's road-safety burden is shaped not only by the number of reported crashes but also by changes in severity, pedestrian involvement, and the number of vehicles participating in each event. This study develops an internally validated annual time series from road-accident, casualty, and vehicle cross-tabulations for Dhaka City for 1998-2015, supplied as data from the Accident Research Institute (ARI), Bangladesh University of Engineering and Technology (BUET). The harmonised record contains 10,959 reported crashes, 12,470 casualty records, and 15,697 involved-vehicle records. Data quality was assessed by reconciling independent table totals and reconstructing crash counts from the vehicle-distribution table. Temporal behaviour was evaluated using descriptive statistics, ordinary least squares with HC3 robust standard errors, Mann-Kendall and Theil-Sen trend estimators, Poisson and negative binomial NB2 count models, grouped binomial logistic models, segmented regression, Spearman correlation, and principal component analysis (PCA). Reported crashes decreased from 1,202 in 1998 to 391 in 2015 (-67.5%), casualty records decreased by 65.2%, and involved-vehicle records decreased by 73.8%. Strong Poisson overdispersion (8.22-27.06) favoured NB2 models; the crash-frequency NB2 incidence-rate ratio was 0.525 per decade (95% CI: 0.459-0.602). However, the fatal-crash share rose from 33.2% to 74.2% (grouped-binomial OR = 3.044 per decade), the pedestrian casualty share rose from 35.9% to 59.4%, and the pedestrian-collision share rose from 41.0% to 71.4%. Conversely, the multi-vehicle crash share fell from 52.8% to 23.8%, and mean vehicles per crash declined from 1.562 to 1.256. The first two principal components explained 84.2% of standardised annual variation. Overall, the findings indicate a transition from a higher-frequency, multi-vehicle crash profile toward a lower-frequency but more fatal- and pedestrian-concentrated reported crash structure. These results support prioritising pedestrian protection, speed management, safer junctions and public-transport interfaces, and stronger integrated crash-data systems in Dhaka. Because exposure denominators and crash-level covariates were unavailable, the results should be interpreted as temporal associations in reported events rather than causal or exposure-adjusted risk estimates.
VL  - 11
IS  - 5
ER  -
Copy
|
Download








 Share This Article
 Twitter
 Linked In
 Facebook