Measurement of Energy Expenditure Using a Triaxial Accelerometer and Estimation of Energy Intake from Dietary Records During Decathlon Competition Days
Background: Energy requirement (ER) for a competition day depends on the amount of energy consumed. Planning energy intake strategies is particularly important for decathlon athletes, who compete in track and field events over two days. However, few studies have reported how decathletes manage their energy intake. The aim of this study was to estimate the total energy intake (TEI) and total energy expenditure (TEE) of decathletes during competition days, considering with specific factors related to energy balance (EB). Methods: Eight athletes were analyzed who completed the decathlon in official track and field events. The TEI was calculated using photographs of all the food and beverages consumed by the athlete. TEE was estimated using a triaxial accelerometer-based method. The EB was calculated by the difference between TEI and TEE. Results: Over the two competition days (48 hours), the TEE for decathlon athletes was 7,984±202 kcal, with a negative EB observed on Day 2. The physical activity level (PAL) exceeded 2.3 on each day of the competition. EB was more strongly associated with TEI/kg than with TEE/kg, and was negative on Day 2. Conclusion: Competition days for decathlon athletes involve high intensity exercise. On Day 2 of the competition and the following competition day, there might be an energy deficiency. It is necessary to focus on strategies for energy intake after the competition ends in the future.
This is an Open Access article, distributed under the terms of the Creative Commons Attribution 4.0 International License (http://creativecommons.org/licenses/by/4.0/), which permits unrestricted use, distribution and reproduction in any medium or format, provided the original work is properly cited.
Tipton KD, Witard OC. Protein requirements and recommendations for athletes: relevance of ivory tower arguments for practical recommendations. Clin Sports Med. 2007; 26(1): 17-36.
. The energy requirements (ER) for training days, competition days, transition periods, and so on varies. Therefore, individual determination is required by utilizing research findings from protocols of sports or exercises relevant to the athlete’s discipline
[3]
Houtkooper L, Abbot JM, Nimmo M; International Association of Athletics Federations. Nutrition for throwers, jumpers, and combined events athletes. J Sports Sci. 2007; 25 Suppl 1: S39-S47.
The ER will change based on the total energy expenditure (TEE). Therefore, to estimate ER accurately, it is necessary to measure TEE objectively. One indicator of ER sufficiency is energy balance (EB). EB is defined as the difference between total energy intake (TEI) and TEE
[4]
Hall KD, Heymsfield SB, Kemnitz JW, Klein S, Schoeller DA, Speakman JR. Energy balance and its components: implications for body weight regulation [published correction appears in Am J Clin Nutr. 2012 Aug; 96(2): 448]. Am J Clin Nutr. 2012; 95(4): 989-994.
, and maintaining this balance is critical for athlete health and performance
[5]
Woods AL, Rice AJ, Garvican-Lewis LA, et al. The effects of intensified training on resting metabolic rate (RMR), body composition and performance in trained cyclists. PLoS One. 2018; 13(2): e0191644. Published 2018 Feb 14.
Heydenreich J, Kayser B, Schutz Y, Melzer K. Total Energy Expenditure, Energy Intake, and Body Composition in Endurance Athletes Across the Training Season: A Systematic Review. Sports Med Open. 2017; 3(1): 8.
. It has been demonstrated that longer periods of negative EB during the day negatively affect the health of athletes
[7]
Fahrenholtz IL, Sjödin A, Benardot D, et al. Within-day energy deficiency and reproductive function in female endurance athletes. Scand J Med Sci Sports. 2018; 28(3): 1139-1146.
Deutz RC, Benardot D, Martin DE, Cody MM. Relationship between energy deficits and body composition in elite female gymnasts and runners. Med Sci Sports Exerc. 2000; 32(3): 659-668.
Energy intake strategies during competitions are also important, not just for the daily life of athletes. This is particularly important for decathlon athletes, who compete in track and field events over the course of nearly two full days
[3]
Houtkooper L, Abbot JM, Nimmo M; International Association of Athletics Federations. Nutrition for throwers, jumpers, and combined events athletes. J Sports Sci. 2007; 25 Suppl 1: S39-S47.
. The decathlon, a track and field event, is contested by men. It combines the three major athletic events of running, jumping, and throwing, and requires speed, explosiveness, and endurance. The decathlon events include the 100 m, long jump (LJ), shot put (SP), high jump (HJ), and 400 m on Day 1, and the 110 m hurdles (110 m H), discus throw (DT), pole vault (PV), javelin throw (JT), and 1,500 m on Day 2. Competitors earn points for their performance in each discipline and the overall winner is the athlete who scores the most points
[9]
International Association of Athletics Federations (2007).
. Recent studies have focused on optimizing energy intake for track and field athletes
[10]
Sygo J, Kendig Glass A, Killer SC, Stellingwerff T. Fueling for the Field: Nutrition for Jumps, Throws, and Combined Events. Int J Sport Nutr Exerc Metab. 2019; 29(2): 95-105.
Burke LM, Castell LM, Casa DJ, et al. International Association of Athletics Federations Consensus Statement 2019: Nutrition for Athletics. Int J Sport Nutr Exerc Metab. 2019; 29(2): 73-84.
. However, these studies have not provided sufficient guidance on energy intake strategies specifically tailored for competition days in the decathlon. Additionally, the dropout rate in international competitions is 22% in the decathlon
[12]
Edouard P, Morin JB, Celli F, Celli Y, Edouard JL. Dropout in international combined events competitions. New Stud Athl. 2009; 24(4): 63-68.
[12]
, suggesting a lack of energy on competition day.
The doubly labeled water method is the gold standard for objectively measuring TEE. However, it is not feasible to analyze such a short timeframe
[13]
Westerterp KR. Doubly labelled water assessment of energy expenditure: principle, practice, and promise. Eur J Appl Physiol. 2017; 117(7): 1277-1285.
as the competition days for the decathlon. Conversely, the accelerometer method enables short-term measurements, such as those taken during competitions
[14]
Oshima Y, Kawaguchi K, Tanaka S, et al. Classifying household and locomotive activities using a triaxial accelerometer. Gait Posture. 2010; 31(3): 370-374.
Ohkawara K, Oshima Y, Hikihara Y, Ishikawa-Takata K, Tabata I, Tanaka S. Real-time estimation of daily physical activity intensity by a triaxial accelerometer and a gravity-removal classification algorithm. Br J Nutr. 2011; 105(11): 1681-1691.
, and the accuracy of metabolic equivalent (METs) estimates obtained from accelerometers has been validated using the Douglas bag method
[15]
Ohkawara K, Oshima Y, Hikihara Y, Ishikawa-Takata K, Tabata I, Tanaka S. Real-time estimation of daily physical activity intensity by a triaxial accelerometer and a gravity-removal classification algorithm. Br J Nutr. 2011; 105(11): 1681-1691.
. Additionally, it enables the analysis of physical activity intensity, making it suitable for studying TEE during decathlon competitions.
Therefore, the purpose of this study was to objectively measure and estimate TEI and TEE during competition days in decathlon using objective indicators. Additionally, the factors related to EB on the day of the competition were also examined.
2. Materials and Methods
2.1. Participants
The participants were 12 healthy male university and graduate students specializing in the decathlon, ranging from beginners to nationally competitive athletes. All participants provided informed consent before participating in the study. Two participants who registered for the competition but did not compete and two participants who did not meet the criteria for accelerometer wear time were excluded from the analysis. The final analysis included eight athletes who participated in the official decathlon competition and competed over two days. This study was conducted in accordance with the Helsinki Declaration and was approved by the Ethics Committee of the University of Tsukuba (Approval No. tai 020-51).
2.2. Experimental Protocol
The study was conducted over a total of four days, coinciding with the official competition days of the decathlon. Athletes wore a triaxial accelerometer (Active Style Pro HJA-750C, Omron Healthcare Co., Ltd. Kyoto, Japan) around their waist from the time they wake up on Day 1 of the competition until bedtime on Day 2.
They were instructed to remove the device if there was a risk of it getting wet, such as during bath times. Activity records were collected to determine wakeup times, bedtimes, and bath times.
Accelerometer data were downloaded to a computer after all measurements were completed. Additionally, athletes photographed and recorded all the food and beverages they consumed from the day before the first competition day until the day after the second competition day.
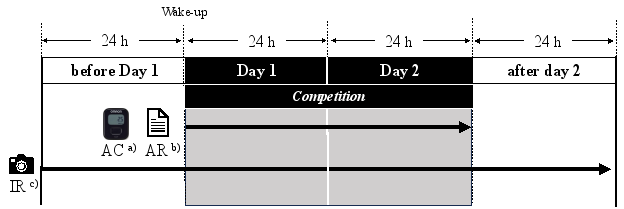
Because the decathlon spans two days, energy expenditure and intake for the sixth and subsequent events continue past midnight on the Day 1 of competition. Therefore, the study defined the two competition days as the 48-hour period starting from when participants woke up on Day 1 of the competition. The first 24 hours were analyzed as Day 1, and the subsequent 24 hours as Day 2. Also, before Day 1 was previously defined as the 24 hours before Day 1, and after Day 2 as the 24 hours following the Day 2. In this study, a protocol was implemented to measure TEE and TEI on competition days. In this study, it was hypothesized energy intake before and after the competition was related with TEE on the day of the competition. Therefore, TEI was assessed from the day before the competition to the day after the competition. The experimental protocol is shown in Figure 1.
a) AC = accelerometer. b) AR = activity record. c) IR = intake record
Energy expenditure was estimated using a triaxial accelerometer (Active Style Pro HJA-750C, Omron Healthcare Co., Ltd. Kyoto, Japan). This device calculates METs every 10 or 60 seconds using synthesized acceleration data measured by the built-in triaxial accelerometer
[14]
Oshima Y, Kawaguchi K, Tanaka S, et al. Classifying household and locomotive activities using a triaxial accelerometer. Gait Posture. 2010; 31(3): 370-374.
Ohkawara K, Oshima Y, Hikihara Y, Ishikawa-Takata K, Tabata I, Tanaka S. Real-time estimation of daily physical activity intensity by a triaxial accelerometer and a gravity-removal classification algorithm. Br J Nutr. 2011; 105(11): 1681-1691.
. Since this study involved measurements of short-duration high intensity exercise, an epoch length of 10 seconds was adopted to allow for more accurate estimation of high intensity movements
[16]
Nakata Y, Ohkawar K, Oshima Y, et al. Effects of Epoch Length on Outcome Measures of Physical Activity with a Triaxial Accelerometer Active Style Pro. Japanese Association of Exercise Epidemiology. 2012; 14(2) [In Japanese, English abstract].
[17]
Gabriel KP, McClain JJ, Schmid KK, et al. Issues in accelerometer methodology: the role of epoch length on estimates of physical activity and relationships with health outcomes in overweight, post-menopausal women. Int J Behav Nutr Phys Act. 2010; 7: 53.
. Nonwear time was defined as any period during which the activity intensity registered zero counts for more than 20 minutes, based on a detection threshold
[18]
Mâsse LC, Fuemmeler BF, Anderson CB, et al. Accelerometer data reduction: a comparison of four reduction algorithms on select outcome variables. Med Sci Sports Exerc. 2005; 37(11 Suppl): S544-S554.
. Only players who wore the device for at least 10 hours per day were included in the study
[18]
Mâsse LC, Fuemmeler BF, Anderson CB, et al. Accelerometer data reduction: a comparison of four reduction algorithms on select outcome variables. Med Sci Sports Exerc. 2005; 37(11 Suppl): S544-S554.
Troiano RP, Berrigan D, Dodd KW, Mâsse LC, Tilert T, McDowell M. Physical activity in the United States measured by accelerometer. Med Sci Sports Exerc. 2008; 40(1): 181-188.
. TEE was estimated from METs recorded every 10 seconds by the device’s algorithm
[14]
Oshima Y, Kawaguchi K, Tanaka S, et al. Classifying household and locomotive activities using a triaxial accelerometer. Gait Posture. 2010; 31(3): 370-374.
Ohkawara K, Oshima Y, Hikihara Y, Ishikawa-Takata K, Tabata I, Tanaka S. Real-time estimation of daily physical activity intensity by a triaxial accelerometer and a gravity-removal classification algorithm. Br J Nutr. 2011; 105(11): 1681-1691.
. A correction factor of 0.91 was applied to account for the slight difference between BMR and resting metabolic rate
[21]
Taguri E, Tanaka S, Ohkawara K, et al. Validity of physical activity indices for adjusting energy expenditure for body size: do the indices depend on body size?. J Physiol Anthropol. 2010; 29(3): 109-117.
Institute of Medicine of the National Academies. Dietary Reference Intakes for Energy, Carbohydrate, Fiber, Fat, Fatty Acids, Cholesterol, Protein, and Amino Acids. The National Academies Press; 2005.
[21, 22]
and diet induced thermogenesis was assumed to account for 10% of TEE. Physical activity level (PAL) is an indicator of physical activity, calculated as TEE divided by BMR. The PAL of Japanese adults is divided into three categories: “low” (1.4 – 1.6), “moderate” (1.6 – 1.9), and “high” (1.9 – 2.2)
[23]
Ishikawa-Takata K, Tabata I, Sasaki S, et al. Physical activity level in healthy free-living Japanese estimated by doubly labelled water method and International Physical Activity Questionnaire. Eur J Clin Nutr. 2008; 62(7): 885-891.
. These categories were used as the basis for calculations in this study. From the METs values obtained from the accelerometer, physical activity intensity was classified into four categories: sedentary behavior (SB) for ≤ 1.5 METs, light physical activity (LPA) for 1.6 – 2.9 METs, moderate physical activity (MPA) for 3 – 5.9 METs, and vigorous physical activity (VPA) for ≥ 6 METs
[24]
Yano S, Koohsari MJ, Shibata A, et al. Comparison of Older and Newer Generation Active Style Pro Accelerometers in Physical Activity and Sedentary Behavior Surveillance under a Free-Living Environment. Int J Environ Res Public Health. 2019; 16(9): 1597. Published 2019 May 7.
The dietary surveys were conducted according to the schedule shown in Figure 1. Continuous dietary records were collected over four consecutive days: Before Day 1, Day 1, Day 2, and after Day 2. All dietary records were made by the athletes themselves, who photographed their food and beverages and kept a dietary diary. The nutritional analysis was conducted using the Excel add-in software (Excel Eiyo Plus; KENPAKUSHA Co., Ltd.), which incorporates the latest 8th edition of the Standard Food Composition Tables in Japan
[25]
Ministry of Education, Culture, Sports, Science and Technology. Standard tables of food composition in Japan. 2020. Available from:
. Regarding the foods for which the weight of condiments was not recorded, it was determined using the supplemental recipe data by Excel Eiyo Plus. For commercially available products, the energy content listed on food labels or manufacturer websites was assumed based on the consumption of the entire product. Energy intake calculations were performed by registered dietitians based on photographs of food and beverages, and the accuracy of these values was confirmed by multiple individuals, including registered dietitians, to minimize errors. In cases where the energy content was uncertain, athletes were interviewed about their food and beverage consumption. Subsequently, TEI was categorized as follows: food and beverages consumed from waking up to the start of the first event of the day (morning), food and beverages consumed from the start of the first event to the end of the fifth event (supplementary food), and food and beverages consumed from the end of the fifth event to bedtime (supper).
2.5. Energy Balance (EB)
EB was calculated by subtracting TEE from TEI
[26]
Lundstrom EA, De Souza MJ, Canil HN, Williams NI. Sex differences and indications of metabolic compensation in within-day energy balance in elite Division 1 swimmers. Appl Physiol Nutr Metab. 2023; 48(1): 74-87.
. In this study, EB was categorized as ± 400 kcal for balanced EB and <− 400 kcal for negative EB (energy deficit). These criteria, commonly used to evaluate EB, are based on principles derived from liver glycogen storage per unit of body weight
[7]
Fahrenholtz IL, Sjödin A, Benardot D, et al. Within-day energy deficiency and reproductive function in female endurance athletes. Scand J Med Sci Sports. 2018; 28(3): 1139-1146.
Deutz RC, Benardot D, Martin DE, Cody MM. Relationship between energy deficits and body composition in elite female gymnasts and runners. Med Sci Sports Exerc. 2000; 32(3): 659-668.
Behrens CE, Delk-Licata A, Benardot D, Bertrand BM, Chandler-Laney PC, Plaisance EP, Fernández JR. The relationship between hourly energy balance and fat mass in female collegiate soccer players. Journal of Human Sport and Exercise.2020; 15(4): 735-746.
All data are presented as the mean ± standard error. The Kolmogorov–Smirnov test was used to assess the normality of the data and was not shown as normal. The daily differences in TEE, TEI, and EB were calculated using the Wilcoxon signed rank test. Spearman’s rank correlation coefficient was used to explore the relationships between average EB and TEI, TEE, and energy intake at different times (morning, supplementary food, supper). All statistical analyses were conducted using SPSS (version 29; IBM Inc., Chicago, IL, USA). The significance level was set at α = 0.05.
3. Results
3.1. Participants
Table 1 presents the maximum, minimum, and average values of the physical characteristics for the eight athletes. Height measurements were obtained using a height meter (NAVIS, YS-OS, Tokyo, Japan), while weight was measured using a bioelectrical impedance analysis scale (TANITA, MC180, Tokyo, Japan). Body fat percentage was determined using dual-energy X-ray absorptiometry (Hologic Horizon, Marlborough, USA: DXA). These measurements were taken during the same competition season as the day of the measurement.
Table 2 presents the minimum, maximum, median, and mean values of TEE, PAL, and physical activity intensity across the two competition days. The average TEE for Day 1 was 4,075 ± 116 kcal, and for Day 2 it was 3,909 ± 97 kcal, with no significant difference observed between the two. On a per kg body weight basis, the average for Day 1 was 54 ± 1 kcal, and for Day 2, it was 52 ± 1 kcal. The average PAL was 2.4 ± 0.0 for Day 1 and 2.3 ± 0.0 for Day 2.
Table 2. Energy expenditure, level of physical activity, and intensity of activity during competition.
Characteristic
Min
Max
Med
Mean ± SE
(kcal/ kg)
p
TEE a) (kcal/d)
Day 1
3596
4498
4196
4075 ± 116
(54 ± 1)
0.069
Day 2
3537
4373
3833
3909 ± 97
(52 ± 1)
Day 1 + Day 2
7207
8870
7993
7984 ± 202
PAL b)
Day 1
2.3
2.5
2.4
2.4 ± 0.0
Day 2
2.2
2.5
2.3
2.3 ± 0.0
PAI c) (min/d)
SB d)
Day 1
773
929
819
835 ± 16
Day 2
757
1001
896
884 ± 27
LPA e)
Day 1
227
394
362
340 ± 20
Day 2
200
426
339
322 ± 27
MPA f)
Day 1
203
263
235
234 ± 8
Day 2
166
227
208
204 ± 8
VPA g)
Day 1
24
41
30
32 ± 2
Day 2
26
38
29
31 ± 1
a) TEE = total energy expenditure. b) PAL = physical activity level. c) PAI = physical activity intensity, TEE / BMR. d) SB = sedentary behavior (≤1.5 METs). e) LPA = light physical activity (1.6-2.9 METs). f) MPA = moderate physical activity (3-5.9 METs). g) VPA = vigorous physical activity (≥6 METs). Wilcoxon signed-rank sum test. n = 8.
3.3. Energy Intake
Table 3 shows the TEI over the four-day period, including the two competition days, along with the energy intake from each energy intake. On a daily basis, the average TEI was 2,650 ± 271 kcal the day before the competition, 4,064 ± 157 kcal on Day 1 of the competition, 3,447 ± 186 kcal on Day 2 of the competition, and 2,026 ± 195 kcal on after Day 2. On a per kg body weight basis, the average intake was 35 ± 4 kcal on before Day 1, 55 ± 3 kcal on Day 1 of the competition, 46 ± 3 kcal on Day 2 of the competition, and 27 ± 3 kcal on after Day 2.
Table 3. Total energy intake and individual energy intake.
Characteristic
Min
Max
Med
Mean ± SE
(kcal/ kg)
p
TEI a) (kcal/d)
before Day 1
1407
3844
2637
2650 ± 271
(35 ± 4)
*
*
*
Day 1
3581
4996
3907
4064 ± 157
(55 ± 3)
Day 2
2615
4106
3428
3447 ± 186
(46 ± 3)
Day 1 + Day 2
6569
9084
7341
7511 ± 300
after Day 2
1261
2776
1972
2026 ± 195
(27 ± 3)
mng b) (kcal)
before Day 1
356
1089
644
693 ± 93
(9 ± 1)
Day 1
398
975
621
626 ± 64
(8 ± 1)
0.401
Day 2
245
719
568
538 ± 50
(7 ± 1)
after Day 2
0
881
373
410 ± 97
(6 ± 1)
suppl c) (kcal)
before Day 1
484
1220
1030
931 ± 101
(12 ± 1)
Day 1
1157
2891
2144
2100 ± 213
(28 ± 3)
0.889
Day 2
1378
2756
1966
2013 ± 168
(27 ± 3)
after Day 2
152
1437
712
796 ± 172
(11 ± 2)
spr d) (kcal)
before Day 1
495
1925
920
1026 ± 152
(14 ± 2)
Day 1
811
1910
1351
1340 ± 162
(18 ± 2)
*
Day 2
302
1418
966
897 ± 120
(12 ± 2)
after Day 2
518
1264
780
820 ± 82
(11 ± 1)
a) TEI = total energy intake. b) mng = morning. c) suppl = supplementary food. d) spr = supper. Day 1 and Day 2 were divided into three periods of energy intake: “morning,” from waking until the start of the first event of the day; “supplementary food,” from the start of the first event until the end of the fifth event; and “supper,” from the end of the fifth event until bedtime. On days other than the competition day, the periods before and after Day 1 were categorized into three energy intake periods: “morning” for breakfast, “supplementary food” for lunch and snacks combined, and “supper” for dinner until bedtime. Wilcoxon signed-rank sum test. *p < 0.05. n = 8.
3.4. EB and Related Factors
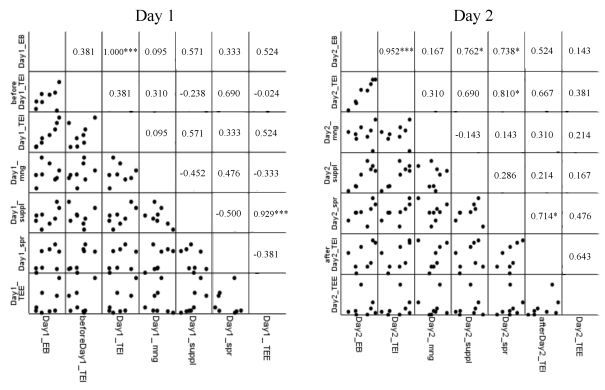
The average EB on Day 1 and Day 2 of the decathlon competition was −11 ± 200 kcal and −462 ± 256 kcal. The EB on Day 1 was significantly higher than on Day 2 (p < 0.05).
Figure 2 shows the results of EB and factors related to energy intake. There was a significant positive correlation between EB and TEI/kg on both Day 1 and Day 2 (r = 1 and r = 0.952, p < 0.001). However, there was no significant correlation between EB on Day 1 and TEE/kg, or between EB on Day 2 and TEE/kg (r = 0.524, p = 0.183, and r = 0.143, p = 0.736).
When energy intake on Day 1 was categorized into three periods: morning (from waking to the start of the first event), supplementary food (from the start of the first event to the end of the fifth event), and supper (from the end of the fifth event to bedtime), there was a significant positive correlation between EB on Day 2 and both supplementary food and supper on Day 2 (r = 0.762, p < 0.05 for supplementary food; r = 0.738, p < 0.05 for supper). Additionally, there was a significant positive correlation between supper on Day 2 and TEI/kg on after Day 2 (r = 0.714, p < 0.05).
Figure 2. Relationship between EB and individual energy intake.
This figure is a scatterplot matrix illustrating the relationship between EB and energy intake on Days 1 and 2 of the competition. Each scatterplot represents individual data points, and the numbers indicate the Spearman’s rank correlation coefficient. *p < 0.05, ***p < 0.001. n = 8.
4. Discussion
This is the first study to clarify the EB by objectively calculating TEE and TEI during decathlon competition. This is crucial for gaining deeper insights into strategies for energy intake before, during, and after competitions. The purpose of this study was to objectively measure and estimate TEI and TEE during competition days in decathlon using objective indicators. Additionally, the factors related to EB on the day of the competition were also examined. As a result, the TEE over the two days (48 hours) of the decathlon was 7,984 ± 202 kcal. It was evident that EB was more strongly associated with TEI than with TEE. Also, on Day 2 of the competition and the following competition day, there might be a lack of energy. In a review that estimated energy requirements for track and field jumping events and the decathlon, it was reported to be 3,500–4,200 kcal/day
[10]
Sygo J, Kendig Glass A, Killer SC, Stellingwerff T. Fueling for the Field: Nutrition for Jumps, Throws, and Combined Events. Int J Sport Nutr Exerc Metab. 2019; 29(2): 95-105.
. This result differed from the TEE measured in this study, which was objectively recorded on competition days. Despite the different events on each day—100 m, LJ, SP, HJ, and 400 m on Day 1, and 110 m H, DT, PV, JT, and 1,500 m on Day 2—there was no significant difference in TEE (p = 0.069). This suggests that the TEEs were similar, even though the events on the two days differed. PAL is one of the factors that contributes to high TEE, and a high PAL leads to a high TEE. This study showed that the PAL for the decathlon exceeded 2.3 on both days, classifying them as “high” according to Japanese standards. The PAL for other activities has been reported in previous studies as 1.9 ± 0.3
[28]
Rafamantanantsoa HH, Ebine N, Yoshioka M, et al. The eff ectiveness of three‒day dietary records with advanced photo system camera for measuring energy intake in Japanese men as determined by doubly labeled water technique. J Clin Biochem Nutr 2003; 33: 33‒8.
Ebine N, Rafamantanantsoa HH, Nayuki Y, et al. Measurement of total energy expenditure by the doubly labelled water method in professional soccer players. J Sports Sci. 2002; 20(5): 391-397.
in professional male soccer players during the competitive season. This suggests that the intensity of physical activity for decathletes is exceptionally high over a two-day period.
While there was no correlation between TEE and EB, a positive correlation was observed between TEI/kg and EB. This suggests that TEI has a greater impact on EB than TEE does. Additionally, TEI/kg on Day 1 was higher than on Day 2, and since EB was within the normal range, this suggests an appropriate energy intake. The TEI/kg on Day 2 of the competition was lower than on Day 1, and the EB was negative. This may have been related to insufficient energy intake from the end of the final event (1,500 m) until bedtime. Indeed, there was a significant correlation between TEI/kg on Day 2 and supper intake on the same day (r = 0.81, p < 0.05). Additionally, there was a correlation between EB on Day 2 and both the complementary food and supper on the same day (r = 0.762, p < 0.05; r = 0.738, p < 0.05). There is some evidence that exercise at higher intensities for longer durations can suppresses acylated ghrelin and appetite
[30]
Broom DR, Stensel DJ, Bishop NC, Burns SF, Miyashita M. Exercise-induced suppression of acylated ghrelin in humans. J Appl Physiol (1985). 2007; 102(6): 2165-2171.
Broom DR, Batterham RL, King JA, Stensel DJ. Influence of resistance and aerobic exercise on hunger, circulating levels of acylated ghrelin, and peptide YY in healthy males. Am J Physiol Regul Integr Comp Physiol. 2009; 296(1): R29-R35.
, a similar phenomenon was likely observed in the decathlon where high intensity exercise was repeated more than 20 times over 2 days.
Additionally, the energy intake from the end of the competition to bedtime was related to the TEI/kg the following competition day. Therefore, decathletes who consume low amounts of energy from the end of the competition until bedtime may continue to have low energy intake the following competition day. Since this study focused on EB on the day of the competition, EB on the day following the competition was not considered. However, athletes with low energy intake at dinner after the final event (1,500 m) may have a negative EB the following competition day. Furthermore, a trend was observed in the correlation between TEI/kg on Day 2 and energy intake from the supplementary food (r = 0.690, p = 0.058). Thus, it is possible that the energy intake from supplementary food during the competition was also inadequate. Decathlon is a physically and mentally demanding event
[10]
Sygo J, Kendig Glass A, Killer SC, Stellingwerff T. Fueling for the Field: Nutrition for Jumps, Throws, and Combined Events. Int J Sport Nutr Exerc Metab. 2019; 29(2): 95-105.
, and athletes often need several days to recover before resuming normal training. Carbohydrate intake during exercise promotes recovery of skeletal muscle glycogen after exercise
[32]
Kuo CH, Hunt DG, Ding Z, Ivy JL. Effect of carbohydrate supplementation on postexercise GLUT-4 protein expression in skeletal muscle. J Appl Physiol (1985). 1999; 87(6): 2290-2295.
. Therefore, increasing energy intake after each event, from the 110 m hurdles to the 1,500 m race, may promote rapid recovery post competition and enhance the potential for improved performance. Moreover, although EB was negative on Day 2, the energy intake up to the end of the 1,500 m event was similar to that on Day 1. It is essential to consider hourly EB variability to suggest energy intake strategies tailored to the duration of the competition
[7]
Fahrenholtz IL, Sjödin A, Benardot D, et al. Within-day energy deficiency and reproductive function in female endurance athletes. Scand J Med Sci Sports. 2018; 28(3): 1139-1146.
Behrens CE, Delk-Licata A, Benardot D, Bertrand BM, Chandler-Laney PC, Plaisance EP, Fernández JR. The relationship between hourly energy balance and fat mass in female collegiate soccer players. Journal of Human Sport and Exercise.2020; 15(4): 735-746.
This study has several limitations. First, TEE was estimated using accelerometers. Since this device cannot measure activities exceeding 18 METs, it may underestimate high intensity exercise. Second, the estimated energy intake may have been affected by errors in the dietary recording method
[33]
Archundia Herrera MC, Chan CB. Narrative Review of New Methods for Assessing Food and Energy Intake. Nutrients. 2018; 10(8): 1064.
. Third, this study had limitations due to its small sample size and limited measurement opportunities. Conducting measurements over an extended period and evaluating performance could provide more detailed insights in the future.
5. Conclusions
This study revealed previously undisclosed energy expenditure and intake over the two competition days of the decathlon. Decathlon is a high intensity sport, and it was shown that athletes expended 7,984 ± 202 kcal and consumed 7,511 ± 300 kcal over the two days of competition. Furthermore, a negative EB is observed on Day 2 of the competition, especially from Day 2 to the following competition day, which may lead to energy deficiency.
Abbreviations
ER
Energy Requirement
TEI
Total Energy Intake
TEE
Total Energy Expenditure
EB
Energy Balance
METs
Metabolic Equivalents
LJ
Long Jump
SP
Shot Put
HJ
High Jump
110 m H
110 m Hurdles
DT
Discus Throw
PV
Pole Vault
JT
Javelin Throw
BMR
Basal Metabolic Rate
PAL
Physical Activity Level
SB
Sedentary Behavior
LPA
Light Physical Activity
MPA
Moderate Physical Activity
VPA
Vigorous Physical Activity
BMI
Body Mass Index
Acknowledgments
We would like to thank the decathletes and staff of the track and field team for their heartwarming support of this study. The authors also express sincere gratitude to Nao Koizumi for carrying out a critical reading of the manuscript and providing advice. We thank MARUZEN-YUSHODO Co., Ltd. (https://kw.maruzen.co.jp/kousei-honyaku/) for the English language editing.
Author Contributions
Rikako Yoshitake: Conception and design of study, acquisition of data, analysis and/or interpretation of data, Drafting the manuscript.
Ayako Yamagami: Conception and design of study, Drafting the manuscript.
Taro Obayashi: Acquisition of data, analysis and/or interpretation of data, revising the manuscript critically for important intellectual content.
Hitomi Ogata: Conception and design of study, analysis and/or interpretation of data, revising the manuscript critically for important intellectual content.
Naomi Omi: Conception and design of study, analysis and/or interpretation of data, revising the manuscript critically for important intellectual content.
All authors approved the final version of the manuscript prior to submission.
Funding
This study was funded by Education and Research Expenses of University of Tsukuba (2020–2022).
Data Availability Statement
The data supporting the outcome of this research work has been reported in this manuscript.
Conflicts of Interest
The authors declare no conflicts of interest.
References
[1]
Burke LM, Kiens B, Ivy JL. Carbohydrates and fat for training and recovery. J Sports Sci. 2004; 22(1): 15-30.
Tipton KD, Witard OC. Protein requirements and recommendations for athletes: relevance of ivory tower arguments for practical recommendations. Clin Sports Med. 2007; 26(1): 17-36.
Houtkooper L, Abbot JM, Nimmo M; International Association of Athletics Federations. Nutrition for throwers, jumpers, and combined events athletes. J Sports Sci. 2007; 25 Suppl 1: S39-S47.
Hall KD, Heymsfield SB, Kemnitz JW, Klein S, Schoeller DA, Speakman JR. Energy balance and its components: implications for body weight regulation [published correction appears in Am J Clin Nutr. 2012 Aug; 96(2): 448]. Am J Clin Nutr. 2012; 95(4): 989-994.
Woods AL, Rice AJ, Garvican-Lewis LA, et al. The effects of intensified training on resting metabolic rate (RMR), body composition and performance in trained cyclists. PLoS One. 2018; 13(2): e0191644. Published 2018 Feb 14.
Heydenreich J, Kayser B, Schutz Y, Melzer K. Total Energy Expenditure, Energy Intake, and Body Composition in Endurance Athletes Across the Training Season: A Systematic Review. Sports Med Open. 2017; 3(1): 8.
Fahrenholtz IL, Sjödin A, Benardot D, et al. Within-day energy deficiency and reproductive function in female endurance athletes. Scand J Med Sci Sports. 2018; 28(3): 1139-1146.
Deutz RC, Benardot D, Martin DE, Cody MM. Relationship between energy deficits and body composition in elite female gymnasts and runners. Med Sci Sports Exerc. 2000; 32(3): 659-668.
Sygo J, Kendig Glass A, Killer SC, Stellingwerff T. Fueling for the Field: Nutrition for Jumps, Throws, and Combined Events. Int J Sport Nutr Exerc Metab. 2019; 29(2): 95-105.
Burke LM, Castell LM, Casa DJ, et al. International Association of Athletics Federations Consensus Statement 2019: Nutrition for Athletics. Int J Sport Nutr Exerc Metab. 2019; 29(2): 73-84.
Oshima Y, Kawaguchi K, Tanaka S, et al. Classifying household and locomotive activities using a triaxial accelerometer. Gait Posture. 2010; 31(3): 370-374.
Ohkawara K, Oshima Y, Hikihara Y, Ishikawa-Takata K, Tabata I, Tanaka S. Real-time estimation of daily physical activity intensity by a triaxial accelerometer and a gravity-removal classification algorithm. Br J Nutr. 2011; 105(11): 1681-1691.
Nakata Y, Ohkawar K, Oshima Y, et al. Effects of Epoch Length on Outcome Measures of Physical Activity with a Triaxial Accelerometer Active Style Pro. Japanese Association of Exercise Epidemiology. 2012; 14(2) [In Japanese, English abstract].
[17]
Gabriel KP, McClain JJ, Schmid KK, et al. Issues in accelerometer methodology: the role of epoch length on estimates of physical activity and relationships with health outcomes in overweight, post-menopausal women. Int J Behav Nutr Phys Act. 2010; 7: 53.
Mâsse LC, Fuemmeler BF, Anderson CB, et al. Accelerometer data reduction: a comparison of four reduction algorithms on select outcome variables. Med Sci Sports Exerc. 2005; 37(11 Suppl): S544-S554.
Troiano RP, Berrigan D, Dodd KW, Mâsse LC, Tilert T, McDowell M. Physical activity in the United States measured by accelerometer. Med Sci Sports Exerc. 2008; 40(1): 181-188.
Taguri E, Tanaka S, Ohkawara K, et al. Validity of physical activity indices for adjusting energy expenditure for body size: do the indices depend on body size?. J Physiol Anthropol. 2010; 29(3): 109-117.
Institute of Medicine of the National Academies. Dietary Reference Intakes for Energy, Carbohydrate, Fiber, Fat, Fatty Acids, Cholesterol, Protein, and Amino Acids. The National Academies Press; 2005.
[23]
Ishikawa-Takata K, Tabata I, Sasaki S, et al. Physical activity level in healthy free-living Japanese estimated by doubly labelled water method and International Physical Activity Questionnaire. Eur J Clin Nutr. 2008; 62(7): 885-891.
Yano S, Koohsari MJ, Shibata A, et al. Comparison of Older and Newer Generation Active Style Pro Accelerometers in Physical Activity and Sedentary Behavior Surveillance under a Free-Living Environment. Int J Environ Res Public Health. 2019; 16(9): 1597. Published 2019 May 7.
Lundstrom EA, De Souza MJ, Canil HN, Williams NI. Sex differences and indications of metabolic compensation in within-day energy balance in elite Division 1 swimmers. Appl Physiol Nutr Metab. 2023; 48(1): 74-87.
Behrens CE, Delk-Licata A, Benardot D, Bertrand BM, Chandler-Laney PC, Plaisance EP, Fernández JR. The relationship between hourly energy balance and fat mass in female collegiate soccer players. Journal of Human Sport and Exercise.2020; 15(4): 735-746.
Rafamantanantsoa HH, Ebine N, Yoshioka M, et al. The eff ectiveness of three‒day dietary records with advanced photo system camera for measuring energy intake in Japanese men as determined by doubly labeled water technique. J Clin Biochem Nutr 2003; 33: 33‒8.
Ebine N, Rafamantanantsoa HH, Nayuki Y, et al. Measurement of total energy expenditure by the doubly labelled water method in professional soccer players. J Sports Sci. 2002; 20(5): 391-397.
Broom DR, Batterham RL, King JA, Stensel DJ. Influence of resistance and aerobic exercise on hunger, circulating levels of acylated ghrelin, and peptide YY in healthy males. Am J Physiol Regul Integr Comp Physiol. 2009; 296(1): R29-R35.
Yoshitake, R., Yamagami, A., Obayashi, T., Ogata, H., Omi, N. (2024). Measurement of Energy Expenditure Using a Triaxial Accelerometer and Estimation of Energy Intake from Dietary Records During Decathlon Competition Days. American Journal of Sports Science, 12(3), 28-36. https://doi.org/10.11648/j.ajss.20241203.11
Yoshitake, R.; Yamagami, A.; Obayashi, T.; Ogata, H.; Omi, N. Measurement of Energy Expenditure Using a Triaxial Accelerometer and Estimation of Energy Intake from Dietary Records During Decathlon Competition Days. Am. J. Sports Sci.2024, 12(3), 28-36. doi: 10.11648/j.ajss.20241203.11
Yoshitake R, Yamagami A, Obayashi T, Ogata H, Omi N. Measurement of Energy Expenditure Using a Triaxial Accelerometer and Estimation of Energy Intake from Dietary Records During Decathlon Competition Days. Am J Sports Sci. 2024;12(3):28-36. doi: 10.11648/j.ajss.20241203.11
@article{10.11648/j.ajss.20241203.11,
  author = {Rikako Yoshitake and Ayako Yamagami and Taro Obayashi and Hitomi Ogata and Naomi Omi},
  title = {Measurement of Energy Expenditure Using a Triaxial Accelerometer and Estimation of Energy Intake from Dietary Records During Decathlon Competition Days
},
  journal = {American Journal of Sports Science},
  volume = {12},
  number = {3},
  pages = {28-36},
  doi = {10.11648/j.ajss.20241203.11},
  url = {https://doi.org/10.11648/j.ajss.20241203.11},
  eprint = {https://article.sciencepublishinggroup.com/pdf/10.11648.j.ajss.20241203.11},
  abstract = {Background: Energy requirement (ER) for a competition day depends on the amount of energy consumed. Planning energy intake strategies is particularly important for decathlon athletes, who compete in track and field events over two days. However, few studies have reported how decathletes manage their energy intake. The aim of this study was to estimate the total energy intake (TEI) and total energy expenditure (TEE) of decathletes during competition days, considering with specific factors related to energy balance (EB). Methods: Eight athletes were analyzed who completed the decathlon in official track and field events. The TEI was calculated using photographs of all the food and beverages consumed by the athlete. TEE was estimated using a triaxial accelerometer-based method. The EB was calculated by the difference between TEI and TEE. Results: Over the two competition days (48 hours), the TEE for decathlon athletes was 7,984±202 kcal, with a negative EB observed on Day 2. The physical activity level (PAL) exceeded 2.3 on each day of the competition. EB was more strongly associated with TEI/kg than with TEE/kg, and was negative on Day 2. Conclusion: Competition days for decathlon athletes involve high intensity exercise. On Day 2 of the competition and the following competition day, there might be an energy deficiency. It is necessary to focus on strategies for energy intake after the competition ends in the future.
},
 year = {2024}
}
TY  - JOUR
T1  - Measurement of Energy Expenditure Using a Triaxial Accelerometer and Estimation of Energy Intake from Dietary Records During Decathlon Competition Days

AU  - Rikako Yoshitake
AU  - Ayako Yamagami
AU  - Taro Obayashi
AU  - Hitomi Ogata
AU  - Naomi Omi
Y1  - 2024/07/31
PY  - 2024
N1  - https://doi.org/10.11648/j.ajss.20241203.11
DO  - 10.11648/j.ajss.20241203.11
T2  - American Journal of Sports Science
JF  - American Journal of Sports Science
JO  - American Journal of Sports Science
SP  - 28
EP  - 36
PB  - Science Publishing Group
SN  - 2330-8540
UR  - https://doi.org/10.11648/j.ajss.20241203.11
AB  - Background: Energy requirement (ER) for a competition day depends on the amount of energy consumed. Planning energy intake strategies is particularly important for decathlon athletes, who compete in track and field events over two days. However, few studies have reported how decathletes manage their energy intake. The aim of this study was to estimate the total energy intake (TEI) and total energy expenditure (TEE) of decathletes during competition days, considering with specific factors related to energy balance (EB). Methods: Eight athletes were analyzed who completed the decathlon in official track and field events. The TEI was calculated using photographs of all the food and beverages consumed by the athlete. TEE was estimated using a triaxial accelerometer-based method. The EB was calculated by the difference between TEI and TEE. Results: Over the two competition days (48 hours), the TEE for decathlon athletes was 7,984±202 kcal, with a negative EB observed on Day 2. The physical activity level (PAL) exceeded 2.3 on each day of the competition. EB was more strongly associated with TEI/kg than with TEE/kg, and was negative on Day 2. Conclusion: Competition days for decathlon athletes involve high intensity exercise. On Day 2 of the competition and the following competition day, there might be an energy deficiency. It is necessary to focus on strategies for energy intake after the competition ends in the future.

VL  - 12
IS  - 3
ER  -