Performance evaluation is crucial for companies to monitor their efficiency and economic status. In the context of the natural gas marketing companies in Bangladesh, their profitability has declined, leading to challenges in meeting demand. The main objective of the study is to measure the efficiency and total factor productivity changes. For five natural gas marketing companies, 10 years of data were analyzed to measure efficiency. Both non-financial indicators (input purchase units, workforce, No. of customers, length of distribution network, output- sales units) and financial indicators (input capital, cost of goods sold, operating expenses, total assets, output- profit) are used to measure efficient by applying Data envelopment analysis (DEA) and Malmquist DEA. Based on the result, newly established companies are more efficient, and the total factor productivity growth is better. To become more productive and move up to the position of an efficient company, the inefficient one should cut down on its excessive input components. The management should optimize employee use and renovate the distribution network with new technology. Innovation in technology and infrastructure development, such as AI systems for operation, leakage findings and maintenance, pressure control, online metering, and metering for all types of customers, can improve technological efficiency and reduce system loss.
| Published in | American Journal of Operations Management and Information Systems (Volume 10, Issue 1) |
| DOI | 10.11648/j.ajomis.20251001.11 |
| Page(s) | 1-12 |
| Creative Commons |
This is an Open Access article, distributed under the terms of the Creative Commons Attribution 4.0 International License (http://creativecommons.org/licenses/by/4.0/), which permits unrestricted use, distribution and reproduction in any medium or format, provided the original work is properly cited. |
| Copyright |
Copyright © The Author(s), 2025. Published by Science Publishing Group |
Efficiency, Performance Evaluation, Economic Status, Malmquist DEA
Particulars | Sales (MMCM) | Purchase (MMCM) | Workforce | Customers | Length of Pipeline (K. M.) |
|---|---|---|---|---|---|
Sales (MMCM) | 1 | 1.00** | 0.99** | 0.97** | 0.97** |
Purchase (MMCM) | 1.00** | 1 | 0.99** | 0.97** | 0.97** |
Workforce | 0.99** | 0.99** | 1 | 0.95** | 0.97** |
Customers | 0.97** | 0.97** | 0.95** | 1 | 0.96** |
Length of Pipeline | 0.97** | 0.97** | 0.97** | 0.96** | 1 |
Cost of Sales | Operating expenses | Total assets | Total equity capital |
|---|---|---|---|
0.33* | 0.51** | 0.41** | 0.57** |
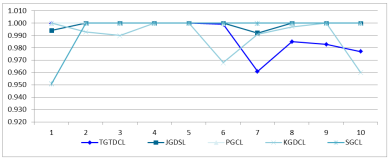
Particulars | Distribution Companies | ||||
|---|---|---|---|---|---|
TGTDCL | JGTDSL | PGCL | KGDCL | SGCL | |
2013-2014 | 1.000 | 0.994 | 1.000 | 1.000 | 0.951 |
2014-2015 | 1.000 | 1.000 | 1.000 | 0.993 | 1.000 |
2015-2016 | 1.000 | 1.000 | 1.000 | 0.990 | 1.000 |
2016-2017 | 1.000 | 1.000 | 1.000 | 1.000 | 1.000 |
2017-2018 | 1.000 | 1.000 | 1.000 | 1.000 | 1.000 |
2018-2019 | 0.999 | 1.000 | 1.000 | 0.968 | 1.000 |
2019-2020 | 0.961 | 0.992 | 1.000 | 0.991 | 1.000 |
2020-2021 | 0.985 | 1.000 | 1.000 | 0.997 | 1.000 |
2021-2022 | 0.983 | 1.000 | 1.000 | 1.000 | 1.000 |
2022-2023 | 0.977 | 1.000 | 1.000 | 0.960 | 1.000 |
Times of efficiency | 5 | 8 | 10 | 4 | 9 |
Mini | 0.961 | 0.992 | 1.000 | 0.960 | 0.951 |
Max | 1.000 | 1.000 | 1.000 | 1.000 | 1.000 |
Mean | 0.991 | 0.999 | 1.000 | 0.990 | 0.995 |
S. D | 0.014 | 0.003 | - | 0.014 | 0.015 |
C. V | 1.37% | 0.30% | 0.00% | 1.45% | 1.56% |
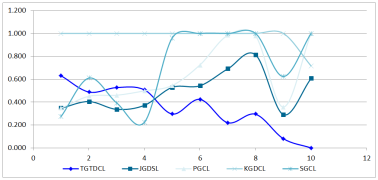
Particulars | Distribution Companies | ||||
|---|---|---|---|---|---|
TGTDCL | JGTDSL | PGCL | KGDCL | SGCL | |
2013-2014 | 0.630 | 0.347 | 0.347 | 1.000 | 0.275 |
2014-2015 | 0.488 | 0.405 | 0.451 | 1.000 | 0.610 |
2015-2016 | 0.527 | 0.337 | 0.460 | 1.000 | 0.393 |
2016-2017 | 0.507 | 0.372 | 0.498 | 1.000 | 0.225 |
2017-2018 | 0.296 | 0.529 | 0.545 | 1.000 | 0.961 |
2018-2019 | 0.424 | 0.543 | 0.725 | 1.000 | 1.000 |
2019-2020 | 0.220 | 0.690 | 0.983 | 1.000 | 1.000 |
2020-2021 | 0.294 | 0.813 | 0.979 | 1.000 | 1.000 |
2021-2022 | 0.081 | 0.291 | 0.357 | 1.000 | 0.624 |
2022-2023 | 0.000 | 0.606 | 1.000 | 0.716 | 1.000 |
Time of efficient | 0 | 0 | 1 | 9 | 4 |
Mini | 0.000 | 0.291 | 0.347 | 0.716 | 0.225 |
Max | 0.630 | 0.813 | 1.000 | 1.000 | 1.000 |
Mean | 0.347 | 0.493 | 0.635 | 0.972 | 0.709 |
S. D | 0.205 | 0.172 | 0.265 | 0.090 | 0.323 |
C. V | 59.00% | 34.89% | 41.78% | 9.24% | 45.64% |
Particulars | Distribution Companies | Mean | ||||
|---|---|---|---|---|---|---|
TGTDCL | JGTDSL | PGCL | KGDCL | SGCL | ||
Technical Efficiency change (EC) | 0.283 | 1.064 | 1.125 | 0.964 | 1.154 | 0.823 |
Technological Efficiency change (TEC) | 0.924 | 0.912 | 0.872 | 0.879 | 0.949 | 0.907 |
Pure efficiency change (PEC) | 0.730 | 1.084 | 1.000 | 1.000 | 1.000 | 0.954 |
Scale efficiency change (SEC) | 0.388 | 0.981 | 1.125 | 0.964 | 1.154 | 0.862 |
Total factor productivity change (TFPC) | 0.261 | 0.970 | 0.981 | 0.847 | 1.095 | 0.746 |
Year | Efficiency change | ||||
|---|---|---|---|---|---|
EC | TEC | PEC | SEC | TFPC | |
2014-2015 | 1.211 | 0.926 | 1.009 | 1.201 | 1.121 |
2015-2016 | 0.900 | 0.772 | 0.991 | 0.908 | 0.694 |
2016-2017 | 0.920 | 0.776 | 0.997 | 0.923 | 0.714 |
2017-2018 | 1.312 | 1.019 | 0.802 | 1.636 | 1.337 |
2018-2019 | 1.153 | 0.996 | 1.282 | 0.899 | 1.148 |
2019-2020 | 0.978 | 1.093 | 0.788 | 1.241 | 1.069 |
2020-2021 | 1.093 | 0.864 | 1.141 | 0.959 | 0.945 |
2021-2022 | 0.468 | 2.468 | 0.663 | 0.706 | 1.154 |
2022-2023 | 0.228 | 0.316 | 1.076 | 0.211 | 0.072 |
Mini | 0.228 | 0.316 | 0.663 | 0.211 | 0.072 |
Max | 1.312 | 2.468 | 1.282 | 1.636 | 1.337 |
Mean | 0.823 | 0.907 | 0.954 | 0.862 | 0.746 |
Rank | Company | TFP change | Company | TE change | Company | TEC change |
|---|---|---|---|---|---|---|
1 | SGCL | 1.095 | SGCL | 1.154 | SGCL | 0.949 |
2 | PGCL | 0.981 | PGCL | 1.125 | TGTDCL | 0.924 |
3 | JGTDSL | 0.970 | JGTDSL | 1.064 | JGTDSL | 0.912 |
4 | KGDCL | 0.847 | KGDCL | 0.964 | KGDCL | 0.879 |
5 | TGTDCL | 0.261 | TGTDCL | 0.283 | PGCL | 0.872 |
TGTDCL | Titas Gas Transmission and Distribution Company Limited |
JGTDSL | Jalalabad Gas Transmission and Distribution System Limited |
PGCL | Pashchimanchal Gas Company Limited |
KGDCL | Karnaphuli Gas Distribution Company Limited |
SGCL | Sundarban Gas Company Limited |
| [1] | Dissanayake, C. K., J. A. Cross, and S. Torabzadehkhorasani. Application of DEA vs. PLSPM in organizational performance measurement. in IIE Annual Conference. Proceedings. 2017. Institute of Industrial and Systems Engineers (IISE). |
| [2] | Fenyves, V., T. Tarnóczi, and K. Zsidó, Financial Performance Evaluation of agricultural enterprises with DEA Method. Procedia Economics and Finance, 2015. 32: p. 423-431. |
| [3] | Borodin, A., et al., Factor Analysis of the Efficiency of Russian Oil and Gas Companies. International Journal of Energy Economics and Policy, 2023. 13(1): p. 172-188. |
| [4] | Borodin, A. and I. Mityushina, Evaluating the effectiveness of companies using the DEA method. Naukovyi Visnyk Natsionalnoho Hirnychoho Universytetu, 2020. 6: p. 187-193. |
| [5] | Moiseeva, I. and D. Tormyshev, Methodological aspects of assessing the effectiveness of the enterprise. Socio Economic Phenomena and Processes, 2018. 13(104): p. 198-206. |
| [6] | Alkhateeb, T. T. Y. and H. Mahmood, Oil price and energy depletion nexus in GCC countries: Asymmetry analyses. Energies, 2020. 13(12): p. 3058. |
| [7] | Islam, S. Z., Auditor's Report& Financial Statement-2023. 2023, Titas Gas Transmission and Distribution Company: Dhaka. |
| [8] | Hemmasi, A., et al., Using DEA Window Analysis for Performance Evaluation of Iranian Wood Panels Industry. African Journal of Agricultural Research, 2011. 6(7): p. 1802-1806. |
| [9] | Halkos, G. E. and N. G. Tzeremes, Industry Performance Evaluation with the Use of Financial Ratios: An Application of Bootstrapped DEA. Expert Systems with Applications, 2012. 39(5): p. 5872-5880. |
| [10] | Tehrani, R., M. R. Mehragan, and M. R. Golkani, A Model for Evaluating Financial Performance of Companies by Data Envelopment Analysis - A Case Study of 36 Corporations Affiliated with a Private Organization. International Business Research, 2012. 5(8). |
| [11] | Yardımcı, O. and M. B. Karan, Efficiency and Service Quality Analyses of the Natural Gas Distribution Companies: A Case Study of Turkey. Energy Technology and Valuation Issues, 2015: p. 165-198. |
| [12] | Majumdar, S. and B. Asgari, Performance Analysis of Listed Companies in the UAE-Using DEA Malmquist Index Approach. American Journal of Operations Research, 2017. 07(02): p. 133-151. |
| [13] | Maradin, D., B. O. Drazenovic, and S. Benkovic, Performance Evaluation of Banking Sector by Using DEA Method. Economic and Social Development: Book of Proceedings, 2018: p. 684-690. |
| [14] | Lin, Y., L. Yan, and Y.-M. Wang, Performance Evaluation and Investment Analysis for Container Port Sustainable Development in China: An Inverse DEA Approach. Sustainability, 2019. 11(17): p. 4617. |
| [15] | Lee, H. S. and Y. Choi, Environmental Performance Evaluation of the Korean Manufacturing Industry Based on Sequential DEA. Sustainability, 2019. 11(3): p. 874. |
| [16] | Sueyoshi, T. and Y. Ryu, Performance Assessment of the Semiconductor Industry: Measured by DEA Environmental Assessment. Energies, 2020. 13(22): p. 5998. |
| [17] | Karakitsiou, A., et al., Regional Efficiency Evaluation by Input-Oriented Data Envelopment Analysis of Hotel and Restaurant Sector. Operational Research, 2020. 20: p. 2041-2058. |
| [18] | Liang, S., J. Yang, and T. Ding, Performance Evaluation of AI Driven Low Carbon Manufacturing Industry in China: An Interactive Network DEA Approach. Computers & Industrial Engineering, 2022. 170: p. 108248. |
| [19] | Raheman, A., et al., Efficiency dynamics of sugar industry of Pakistan [with comments]. The Pakistan Development Review, 2022. 48(4II): p. 921-938. |
| [20] | Hossain, H., et al., Comparative Efficiency Measurement of the Selected Garments Factories in Bangladesh: An Application of Data Envelopment Analysis (DEA). International Journal of Research -GRANTHAALAYAH, 2023. 11(1). |
| [21] | Odeyale, S., Efficiency evaluation of a safety department in a construction company-A case study: A DEA approach. Management Science Letters, 2015. 5(1): p. 39-50. |
| [22] | Sujakhu, S. and W. Li, Public Transit Performance Evaluation Using Data Envelopment Analysis and Possibilities of Enhancement. Journal of Transportation Technologies, 2020. 10(02): p. 89-109. |
| [23] | Coelli, T. J., et al., An introduction to efficiency and productivity analysis. 2nd ed. 2005: springer science & business media. 341. |
| [24] | Fethi, M. D. and F. Pasiouras, Assessing bank efficiency and performance with operational research and artificial intelligence techniques: A survey. European journal of operational research, 2010. 204(2): p. 189-198. |
| [25] | Afjal, M. and M. I. Ahmad, An Efficiency Analysis of Selected Indian Oil and Gas Companies: A Window DEA Approach. IUP Journal of Applied Economics, 2018. 17(4). |
| [26] | Squires, D. and C. Reid, Using Malmquist indices to measure changes in total factor productivity of purse-seine vessels while accounting for changes in capacity utilisation, the resource stock and the environment. 2004. p. 1-15. |
| [27] | Ertürk, M. and S. Türüt-Aşık, Efficiency analysis of Turkish natural gas distribution companies by using data envelopment analysis method. Energy Policy, 2011. 39(3): p. 1426-1438. |
| [28] | Zhou, P., K. L. Poh, and B. W. Ang, Data envelopment analysis for measuring environmental performance. Handbook of operations analytics using data envelopment analysis, 2016: p. 31-49. |
| [29] | Rashidi, K. and R. F. Saen, Measuring eco-efficiency based on green indicators and potentials in energy saving and undesirable output abatement. Energy Economics, 2015. 50: p. 18-26. |
| [30] | Shafiee, M., M. Sangi, and M. Ghaderi, Bank Performance Evaluation Using Dynamic DEA A Slacks-Based Measure Approach. Data Envelopment Analysis and Decision Science, 2013. 2013: p. 1-12. |
| [31] | Woo, C., et al., The static and dynamic environmental efficiency of renewable energy: A Malmquist index analysis of OECD countries. Renewable and Sustainable Energy Reviews, 2015. 47: p. 367-376. |
| [32] | Yasar, M., V. Asker, and E. Ozdemir, Efficiency Measurement at Airlines City-pair Markets with Data Envelopment Analysis and Malmquist Productivity Index. Procedia 2018. 7: p. 228-232. |
| [33] | Kieso, D. E., J. J. Weygandt, and T. D. Warfield, Intermediate Accounting: IFRS edition. Third ed. 2018, Singapore: John Wiley & Sons Inc. |
| [34] | Hermanson, R. H., J. D. Edwards, and M. Maher, Accounting: A Business Perspective. 7th ed. (No Title). 1998: McGreaw-Hill, New York. |
| [35] | Subramanyam, K. R. and J. J. Wild, Financial Statement Analysis. 10e ed. 2014, Chennai: McGraw Hill Education(India) Private Limited. |
| [36] | Kieso, D. E., J. J. Weygandt, and T. D. Warfield, Intermediate accounting. 2016: John Wiley & Sons. |
| [37] | Memon, M. A. and I. M. Tahir, Size and operational performance of manufacturing companies in Pakistan using data envelopment analysis. Journal of Information Engineering and Applications, 2012. 2(4): p. 39-49. |
| [38] | Dia, M., P. M. Takouda, and A. Golmohammadi, Efficiency measurement of Canadian oil and gas companies. International Journal of Operational Research, 2021. 40(4): p. 460-488. |
| [39] | Bandyopadhyay, A., Predicting Probability of Default of Indian Corporate Bonds: Logistic and Z-Score Model Approaches. The Journal of Risk Finance, 2006. 7(3): p. 255-272. |
APA Style
Huda, M. N., Sabur, M. A. (2025). Efficiency Measurement: An Application of Data Envelopment Analysis (DEA) on Natural Gas Marketing Companies in Bangladesh. American Journal of Operations Management and Information Systems, 10(1), 1-12. https://doi.org/10.11648/j.ajomis.20251001.11
ACS Style
Huda, M. N.; Sabur, M. A. Efficiency Measurement: An Application of Data Envelopment Analysis (DEA) on Natural Gas Marketing Companies in Bangladesh. Am. J. Oper. Manag. Inf. Syst. 2025, 10(1), 1-12. doi: 10.11648/j.ajomis.20251001.11
@article{10.11648/j.ajomis.20251001.11,
  author = {Md. Nazmul Huda and Md. Abdus Sabur},
  title = {Efficiency Measurement: An Application of Data Envelopment Analysis (DEA) on Natural Gas Marketing Companies in Bangladesh
},
  journal = {American Journal of Operations Management and Information Systems},
  volume = {10},
  number = {1},
  pages = {1-12},
  doi = {10.11648/j.ajomis.20251001.11},
  url = {https://doi.org/10.11648/j.ajomis.20251001.11},
  eprint = {https://article.sciencepublishinggroup.com/pdf/10.11648.j.ajomis.20251001.11},
  abstract = {Performance evaluation is crucial for companies to monitor their efficiency and economic status. In the context of the natural gas marketing companies in Bangladesh, their profitability has declined, leading to challenges in meeting demand. The main objective of the study is to measure the efficiency and total factor productivity changes. For five natural gas marketing companies, 10 years of data were analyzed to measure efficiency. Both non-financial indicators (input purchase units, workforce, No. of customers, length of distribution network, output- sales units) and financial indicators (input capital, cost of goods sold, operating expenses, total assets, output- profit) are used to measure efficient by applying Data envelopment analysis (DEA) and Malmquist DEA. Based on the result, newly established companies are more efficient, and the total factor productivity growth is better. To become more productive and move up to the position of an efficient company, the inefficient one should cut down on its excessive input components. The management should optimize employee use and renovate the distribution network with new technology. Innovation in technology and infrastructure development, such as AI systems for operation, leakage findings and maintenance, pressure control, online metering, and metering for all types of customers, can improve technological efficiency and reduce system loss.
},
 year = {2025}
}
TY  - JOUR
T1  - Efficiency Measurement: An Application of Data Envelopment Analysis (DEA) on Natural Gas Marketing Companies in Bangladesh

AU  - Md. Nazmul Huda
AU  - Md. Abdus Sabur
Y1  - 2025/03/11
PY  - 2025
N1  - https://doi.org/10.11648/j.ajomis.20251001.11
DO  - 10.11648/j.ajomis.20251001.11
T2  - American Journal of Operations Management and Information Systems
JF  - American Journal of Operations Management and Information Systems
JO  - American Journal of Operations Management and Information Systems
SP  - 1
EP  - 12
PB  - Science Publishing Group
SN  - 2578-8310
UR  - https://doi.org/10.11648/j.ajomis.20251001.11
AB  - Performance evaluation is crucial for companies to monitor their efficiency and economic status. In the context of the natural gas marketing companies in Bangladesh, their profitability has declined, leading to challenges in meeting demand. The main objective of the study is to measure the efficiency and total factor productivity changes. For five natural gas marketing companies, 10 years of data were analyzed to measure efficiency. Both non-financial indicators (input purchase units, workforce, No. of customers, length of distribution network, output- sales units) and financial indicators (input capital, cost of goods sold, operating expenses, total assets, output- profit) are used to measure efficient by applying Data envelopment analysis (DEA) and Malmquist DEA. Based on the result, newly established companies are more efficient, and the total factor productivity growth is better. To become more productive and move up to the position of an efficient company, the inefficient one should cut down on its excessive input components. The management should optimize employee use and renovate the distribution network with new technology. Innovation in technology and infrastructure development, such as AI systems for operation, leakage findings and maintenance, pressure control, online metering, and metering for all types of customers, can improve technological efficiency and reduce system loss.

VL  - 10
IS  - 1
ER  -
Department of Accounting and Information Systems, Faculty of Business Administration, Islamic University, Kushtia, Bangladesh
Biography: Md. Nazmul Huda is an Assistant Professor at Islamic University in Bangladesh's Department of Accounting and Information Systems. He has been an instructor at a Bangladeshi public university for almost six years. Mr. Huda worked in various fields, including banking in the foreign exchange department, teaching at a private university, and serving as deputy manager of a natural gas distribution company in Bangladesh for nearly ten years. Without that, it should be noted that Mr. Huda earned his BBA and MBA with a major in Accounting and Information Systems from the Department of Accounting and Information Systems at Islamic University in Bangladesh, where he also placed first in the faculty and department for the MBA program and received a gold medal. The Institute of Bankers Bangladesh awarded him a JAIBB banking diploma as well. Additionally, He was successfully admitted to the National Board of Revenue of Bangladesh as an Income Tax Practitioner (ITP). He entered as a fellow under the Ph.D. fellowship program 2021–2022, of the University Grants Commission of Bangladesh, and is currently a Ph.D. fellow in the Department of Accounting and Information Systems, Islamic University, Bangladesh under the supervision of Prof. Dr. Md. Abdus Sabur. More than 20 national and international train-ing/seminar programs have been attended, and more than 19 research articles have already been published in national and international journals.

Department of Accounting and Information Systems, Faculty of Business Administration, Islamic University, Kushtia, Bangladesh
Biography: At the Islamic University in Bangladesh, Dr. Md. Abdus Sabur holds a position as a professor in the Department of Accounting and Information Systems. He has been a professor for almost 19 years at a public University in Bangladesh. Without that, Dr. Sabur worked as a government officer (teacher) for the Ministry of Education in Bangladesh for almost 14 years. It should be noted that Prof. Sabur earned both his bachelor's and master's degrees in mathematics with a first-class grade from the Department of Mathematics at Jahangirnagar University in Bangladesh. He also received a Bachelor of Education in educational pedagogy from the University of Rajshahi in Bangladesh. Additionally, He received his PhD (Doctor of Philosophy) from the Department of Accounting and Information Systems, Islamic University, Bangladesh on the topic of "Input-Output Measurements of Sugar Industries in Bangladesh: An Econometric Analysis." In addition, he has been supervising M. Phil. and Ph.D. scholars in various disciplines, including accounting, management, operations management, and economics. In addition to participating in various national and international training, workshops, and seminar programs, more than 30 research publications have already been published in national and international journals.

Information