The spectral properties of the silver–3-anisidine–cyclodextrin (Ag: 3AS: CD) inclusion complex nanomaterials in solution were investigated using UV–visible, steady-state fluorescence, time-resolved fluorescence, SEM, DSC, FTIR, XRD, 1H NMR, and molecular modeling methods. The distinct spectral changes observed for 3AS upon the addition of CDs at different pH values indicate that the geometries of the resulting inclusion complexes vary with pH. While 3AS exhibits a single emission maximum in solvents and in α-CD, a dual emission is observed in β-CD. The lifetimes of the inclusion complexes were longer than that of the free 3AS molecule. The relatively narrow cavity of α-CD likely restricts the free rotation of the amino or methoxy groups of 3AS, inhibiting ICT-state formation and thereby enhancing the normal emission. The calculated HOMO–LUMO energy gap, total energy, free energy, enthalpy, entropy, dipole moment, and zero-point vibrational energy of the CD: 3AS complex differed significantly from those of the isolated 3AS, α-CD and β-CD molecules, and both the vertical and horizontal bond lengths between the amino and methoxy groups are smaller than the β-CD cavity size confirming the formation of an inclusion complex. SEM images and EDX analysis confirm the presence of silver in the Ag: 3AS: β-CD nanomaterials. In the FTIR spectra, most characteristic peaks diminish or disappear, accompanied by a marked decrease in intensity for the Ag: 3AS: CD nanocomplexes, suggesting strong interactions between 3AS and nano silver. The 1H NMR chemical shifts of 3AS protons move both upfield and downfield indicating restricted mobility and strong host–guest interactions within the nano Ag–CD matrix.
| Published in | American Journal of Nanosciences (Volume 10, Issue 2) |
| DOI | 10.11648/j.ajn.20261002.11 |
| Page(s) | 41-51 |
| Creative Commons |
This is an Open Access article, distributed under the terms of the Creative Commons Attribution 4.0 International License (http://creativecommons.org/licenses/by/4.0/), which permits unrestricted use, distribution and reproduction in any medium or format, provided the original work is properly cited. |
| Copyright |
Copyright © The Author(s), 2026. Published by Science Publishing Group |
3-Anisidine, Cyclodextrin, Silver Nano, Inclusion Complex, Nanomaterials
Concentration of α-CD x10-3 M | pH - 2 | pH - 7 | pH - 11 | |||||||||
|---|---|---|---|---|---|---|---|---|---|---|---|---|
abs | log | flu | τ | abs | log | flu | τ | abs | log | flu | τ | |
3AS only (without CD) | 270 219 | 3.24 | 297 | 0.34 | 282 230 215 | 3.23 | 336 297sh | 0.35 | 282 231 215 | 3.23 | 337 | 0.24 |
0.2 M α-CD | 270 219 | 3.23 | 297 | 0.41 | 282 230 215 | 3.22 | 338 297sh | 0.43 | 282 231 215 | 3.21 | 337 | 0.28 |
1.0 M α-CD | 270 219 | 3.17 | 298 | 0.50 | 282 230 215 | 3.17 | 338 297sh | 0.53 | 282 231 215 | 3.17 | 337 435 | 0.32 |
K (1: 1) x105 M-1 | 56 | 356 | 62 | 367 | 74 | 451 | ||||||
G (kcalmol-1) | -10.1 | -14.7 | -10.3 | -14.8 | -10.8 | -15.4 | ||||||
0.2 β-CD | 270 218 | 3.17 | 298 | 0.43 | 279 230 213 | 3.20 | 435 333 297sh | 0.46 | 282 230 213 | 3.20 | 339 | 0.31 |
1.0 β-CD | 270 220 | 3.08 | 304 | 0.55 | 272 230 220 | 2.96 | 442 332 297sh | 0.57 0.27 | 282 230 217 | 3.18 | 356 438 | 0.34 0.22 |
Excitation wavelength (nm) | 260 | 260 | 280 | |||||||||
K (1: 1) x105 M-1 | 85 | 416 | 104 | 428 | 112 | 514 | ||||||
G (kcalmol-1) | -11.1 | -15.1 | -11.7 | -15.2 | -11.8 | -15.7 | ||||||
Properties | 3AS | α-CD | β-CD | 3AS: α-CD | 3AS: β-CD |
|---|---|---|---|---|---|
EHOMO (eV) | -8.47 | -10.37 | -10.35 | -8.18 | -8.29 |
ELUMO (eV) | 0.54 | 1.26 | 1..23 | 0.69 | 0.76 |
EHOMO – ELUMO (eV) | -9.01 | -11.63 | -11.58 | -8.87 | -9.05 |
Dipole moment (D) | 1.19 | 11.34 | 12.29 | 11.63 | 11.84 |
E* | -21.36 | -1247.62 | -1457.63 | -1253.99 | -1467.84 |
E* | -14.99 | -1254.30 | |||
G* | 65.05 | -676.37 | -789.52 | -586.17 | -695.92 |
ΔG* | -25.15 | -28.55 | |||
H* | 92.11 | -570.84 | -667.55 | -524.19 | -628.94 |
ΔH | -45.41 | -53.5 | |||
S** | 0.090 | 0.353 | 0.409 | 0.452 | 0.461 |
ΔS** | 0.009 | 0.038 | |||
ZPE* | 68.39 | 635.09 | 740.56 | 708.32 | 811.36 |
Mullikan charge | 0.00 | 0.00 | 0.00 | 0.00 | 0.00 |
Protons | 3AS (δ) | Ag: 3AS: α-CD (Δδ) | Ag: 3AS: β-CD (Δδ) |
|---|---|---|---|
Ha- meta to NH2, OCH3 | 7.03 | 7.38w | 7.4w |
Hb- para to NH2 | 6.30 | 7.18w | 7.2w |
Hc- para to OCH3 | 6.24 | 6.78w | 6.80w |
Hd- in between to NH2, OCH3 | 6.21 | 4.81 | 4.84 |
He -OCH3 | 3.72 | 2.46 | 2.49 |
Hf - NH2 | 3.59 | 2.06 | 2.08 |
FTIR | Fourier Transform Infrared Spectroscopy |
DTA | Differential Thermal Analysis |
XRD | X-ray Diffraction |
SEM | Scanning Electron Microscopy |
HOMO | Highest Occupied Molecular Orbital |
LUMO | Lowest Unoccupied Molecular Orbital |
3AS | 3-Anisidine |
Ag NPs | Silver Nanoparticles |
α-CD | Alpha Cyclodextrin |
β-CD | Beta Cyclodextrin |
PM3 | Parametric Method 3 |
ΔE | Iinternal Energy Change |
ΔH | Enthalpy Change |
ΔG | Free Energy Change |
ΔS | Entropy Change |
| [1] | T. Cserhati, E. Forgacs, Cyclodextrins in chromatography, The Royal Society of Chemistry, Cambridge (2003). |
| [2] | K. Bhattacharya, M. Chowdhury, Environmental and magnetic field effects on exciplex and twisted charge transfer emission, Chem. Rev. 93(1993) 507. |
| [3] | M. J. Jozwiakowski, K. A. Connors, Aqueous solubility behavior of three cyclodextrins, Carbohydr. Res.143 (1985) 51. |
| [4] | J. Szejtli, Introduction and general overview of cyclodextrin chemistry, Chem. Rev. 98(1998) 1743. |
| [5] | A. Berthod, Chiral recognition mechanisms, Anal. Chem. 78 (2006) 2093. |
| [6] | Mohamad A.Chouker, Hiba Abdallah, Ali Zeiz, Mohammad H.El-Dakdouki, Host-quest inclusion complex of quinoxaline-1,4-dioxide derivative with 2-hydroxypropyl-β-cyclodextrin: Preparation, characterization, and antibacterial activity, J Mol. Struc. 1235 (2021) 130273. |
| [7] | Marzena Jamrógiewicz, Karolina Milewska, Studies on the influence of β-cyclodextrin derivatives on the physical stability of famotidine, Spectrochim. Acta Part A: 219 (2019) 346. |
| [8] | Hiba Mohamed Ameen, Sándor Kunsági-Máté, Lajos Szente, Beáta Lemli, Encapsulation of sulfamethazine by native and randomly methylated β-cyclodextrins: The role of the dipole properties of guests, Spectrochim. Acta (A): 225 (2020) 117475. |
| [9] | Y. Yuan, T. Nie, Y. Fang, X. You, H. Huang, J. Wu, Stimuli-responsive cyclodextrin-based supramolecular assemblies as drug carriers, J. Mater. Chem. B 10 (2022) 2077-2096. |
| [10] | S. Yi, R. Liao, W. Zhao, Y. Huang, Y. He, Multifunctional co-transport carriers based on cyclodextrin assembly for cancer synergistic therapy, Theranostics 12 (2022) 2560-2579. |
| [11] | C. Xia, X. Dong, H. Li, M. Cao, D. Sun, S. He, et al., Cancer statistics in China and United States, 2022: Profiles, trends, and determinants, Chin. Med. J. 135 (2022) 584-590. |
| [12] | C. Wen, R. Cheng, T. Gong, Y. Huang, D. Li, X. Zhao, et al., β-Cyclodextrin-cholic acid-hyaluronic acid polymer coated Fe3O₄-graphene oxide nanohybrids as local chemo-photothermal synergistic agents for enhanced liver tumor therapy, Colloids Surf. B Biointerfaces 199 (2021) 111510. |
| [13] | M. Vij, P. Wadhwa, Impacts of nanotechnology on pharmaceutical sciences, in: Smart Nanotechnology with Applications, CRC Press, London, 2020, pp. 273-278. |
| [14] | K. Soleimani, E. Arkan, H. Derakhshankhah, B. Haghshenas, R. Jahanban-Esfahlan, M. Jaymand, A novel bioreducible and pH-responsive magnetic nanohydrogel based on β-cyclodextrin for chemo/hyperthermia therapy of cancer, Carbohydr. Polym. 252 (2021) 117229. |
| [15] | T. M. Sheng, P. V. Kumar, A new approach for β-cyclodextrin conjugated drug delivery system in cancer therapy, Curr. Drug Deliv. 19 (2022) 266-300. |
| [16] | N.Rajendiran, T.Mohandoss, G.Venkatesh, Investigation of inclusion complexes of sulfamerazine with α- and β-cyclodextrins: An experimental and theoretical study, Spectrochimica Acta A, 124(2014) 441-450. |
| [17] | G.Venkatesh, A. Antony Muthu Prabhu, N.Rajendiran, Azonium-Ammonium Tautomerism and Inclusion Complexation of 1-(2,4-diamino phenylazo) naphthalene and 4-Amino azobenzene, J.Fluorescence, 21(2011) 1485-1497. |
| [18] | G.Venkatesh, R. K.Sankara narayanan, A. Antony Muthu Prabhu, N.Rajendiran, Absorption and fluorescence spectral characteristics of norepinephrine, epinephrine, isoprenaline, methyldopa, terbutaline and orciprenaline drugs, Physics and Chemistry of Liquids, 50(2012) 434-452. |
| [19] | T.Stalin, R.Anithadevi, N.Rajendiran, Spectral characteristics of ortho, meta and para-dihydroxybenzenes in different solvents, pH and β-CD. Spectrochimica Acta, 61A (2005) 2495-2504. |
| [20] | T.Stalin, P. Vasantharani, B.Shanthi, A.Sekar, N.Rajendiran, Inclusion complex of 1,2,3-trihydroxybenzene with α- and β-cyclodextrins, Indian J Chemistry, 45A (2006) 1113-1120. |
| [21] | K.Sivakumar, T.Stalin, N.Rajendiran, Dual fluorescence of diphenyl carbazide and benzanilide: Effect of solvents and pH on electronic spectra, Spectrochimica Acta, 62A (2005) 991-999. |
| [22] | J.Prema Kumari, A. Antony Muthu Prabhu, G. Venkatesh, V. K. Subramanian, N.Rajendiran, Effect of solvents and pH on β-CD Inclusion complexation of 2,4-dihydroxyazobenzene and 4-hydroxy azobenzene, J.Solution Chemistry, 40(2011) 327-347. |
| [23] | J. Thulasidhasan, N. Rajendiran, Host-guest inclusion complexes of propafenone hydrochloride with α- and β-cyclodextrins: Spectral and molecular modeling study, Spectrochim Acta, 115A (2013) 559-567. |
| [24] | J.Prema Kumari, A. Antony Muthu Prabhu, G.Venkatesh, V. K.Subramanian, N. Rajendiran, Spectral characteristics of sulfadiazine, sulfisomidine: Effect of solvents, pH and β-CD, Physics and Chemistry of Liquids, 49(2011) 108-132. |
| [25] | N.Rajendiran, T.Balasubramanian, Dual fluorescence of syringaldazine, Spectrochim Acta, 68A (2007) 894-904, |
| [26] | A. Mani, P. Ramasamy, A. Antony Muthu Prabhu, N. Rajendiran, Investigation of Ag and Ag/Co bimetallic nanoparticles with naproxen-cyclodextrin inclusion complex. J.Molecular Structure, 1284 (2023) 135301-10. |
| [27] | A. Mani, G. Venkatesh, P. Senthilraja, N. Rajendiran, Synthesis and Characterisation of Ag-Co-Venlafaxine-Cyclodextrin Nanorods, European J Advanced Chemistry Research, 5 (2024) 9-16. |
| [28] | A. Mani, P. Ramasamy, A. Antony Muthu Prabhu, P. Senthilraja, N. Rajendiran, Synthesis and Analysis of Ag/Olanzapine /Cyclodextrin and Ag/Co/Olanzapine /Cyclodextrin Inclusion Complex Nanorods. Physics and Chemistry of Liquids, 62(2024) 196-209. |
| [29] | A.Mani, P.Ramasamy, A.Antony Muthu Prabhu, P.Senthilraja, N.Rajendiran, Synthesis and Characterisation of Ag/Co/Chloroquine/ Cyclodextrin Inclusion Complex Nanomaterials. J Sol-Gel Science and Technology 115 (2025) 844-856. |
| [30] | N. Rajendiran, A. Mani, M. Venkatesan, B. Sneha, E. Nivetha, P. Senthilraja, Spectral, Microscopic, Antibacterial and Anticancer Activity of Pyrimethamine drug with Ag nano, DNA, RNA, BSA, Dendrimer, and Cyclodextrins, J Solution Chem, In press. |
| [31] | R. S. Sarpal, S. K.Dogra, Prototropism in aminophenols and anisidines: a reinvestigation, J.Photochem., 38(1987) 263-276. |
| [32] | Z. R. Grabowski, K. Rotkiewicz, W. Rettig, Structural changes accompanying intramolecular electron transfer: focus on twisted intramolecular charge-transfer states and structures, Chem.Rev. 103(2003) 3899. |
| [33] | E. Lippert, W. Luder, H. Boose, In Advances in Molecular Spectroscopy, A. Mangini (Eds.), Pergamon Press, Oxford, UK, (1962) p. 443. |
| [34] | M. Jude Jenita, T. Mohandoss, N. Rajendiran, Spectral and molecular modeling studies on hydroxy benzaldehydes with native and modified cyclodextrins, J. Fluorescence, 24 (2014) 695-707. |
| [35] | N. Rajendiran, M. Jude Jenita, Encapsulation of 4-hydroxy-3-methoxy benzoic acid and 4-hydroxy-3,5-dimethoxy benzoic acid by native and modified cyclodextrins, Spectrochimica Acta, 136 (2015) 1349-1357. |
| [36] | N.Rajendiran, T.Balasubramanian, Dual fluorescence of N-phenylanthranilic acid: Effect of solvents, pH and β-CD, Spectrochimica Acta, 68A (2007) 867-876, |
| [37] | R.K.Sankaranarayanan, A.Antony Muthu Prabhu, N.Rajendiran, Inclusion complexation of 3,5-dihydroxy benzoic acid with β-CD at different pH. Indian J. Chemistry, 48A (2009) 1515-1521. |
| [38] | R. K.Sankaranarayanan, A.Antony Muthu Prabhu, N.Rajendiran, A Study on the inclusion complexation of 3,4,5-trihydroxybenzoic acid with β-CD at different pH. J.Inclusion Phenomena and Macrocyclic Chemistry, 67(2010)461-470. |
| [39] | P Ramasamy, A Mani, B Sneha, E Nivetha, M Venkatesan, N Rajendiran, Azo-hydrazo tautomerism in Sudan Red-B and Cyclodextrin/ Sudan Red-B doped ZnO nanomaterials. J Molecular Structure 1329 (2025) 141423-32. |
| [40] | P. Ramasamy, A. Mani, B. Sneha, E. Nivetha, A. Antony Muthu Prabhu, G. Venkatesh, N. Rajendiran,* Synthesis and Characterisation of Sudan Red-G/Cyclodextrin doped ZnO Nanocrystals. American J Physical Chemistry 14(2025) 23-32, |
| [41] | P. Ramasamy, A. Mani, B.Sneha, E.Nivetha, A. Antony Muthu Prabhu, G.Venkatesh, P. Senthilraja, N. Rajendiran*, Synthesis and Characterisation of Cyclodextrin /Methyl Violet doped ZnO Nanocrystals. Colloid and Surface Science 9 (2025) 19-30, |
| [42] | P. Ramasamy, A. Mani, B.Sneha, E.Nivetha, A. Antony Muthu Prabhu, G.Venkatesh, P. Senthilraja, N. Rajendiran*, Synthesis and Characterisation of Cyclodextrin/ Sudan Black-B Caped ZnO/ Nanocrystals. American J Quantum Chemistry and Molecular Spectroscopy 9(2025) 1-11, |
| [43] | P. Ramasamy, A. Mani, A. Antony Muthu Prabhu, G.Venkatesh, N. Rajendiran* Azo-Imino Tautomerism in Sudan Red 7B/Cyclodextrin Coated ZnO Nanocomposites: Evidence by Spectral and Microscopic Perspectives. Science Journal of Chemistry 13(2025) 65 - 75, |
| [44] | P. Ramasamy, A. Mani, A. Antony Muthu Prabhu, G.Venkatesh, P. Senthilraja, N. Rajendiran* PICT Effects and Anticancer Potential on Rosaniline and Spectral Characterisation of Rosaniline/Cyclodextrin Covered ZnO/ Nanocrystals. International J. Pure and Applied Chemistry 26 (2025) 107-121, |
| [45] | P. Ramasamy, A. Mani, P.Senthilraja, N. Rajendiran Keto-Enol Tautomerism and Anticancer Potential on Sudan Blue II and Synthesis and Characterisation of Sudan Blue II/ Cyclodextrin doped ZnO Nanocrystals, J. Materials Science and Nanotechnology, 13(2025) 1-16. |
| [46] | P. Ramasamy, A. Mani, P.Senthilraja, N.Rajendiran, Spectral, Microscopic and Anticancer Activity Investigation on Dimethyl Yellow/Cyclodextrin Doped ZnO Nanocomposites Journal of Chemical and Pharmaceutical Sciences (JCHPS) 18(3) (2025) 33-43. |
| [47] | P. Ramasamy, A. Mani, P.Senthilraja, N.Rajendiran, Spectral Characteristics of ZnO/Mordent Yellow 12/ Cyclodextrin Nanomaterials, J Chemical Health Risks, (JCHR) 15(2025) 542-553 |
| [48] | P. Ramasamy, A. Mani, P. Senthilraja, S. Senthilmurugan, N. Rajendiran, Spectral, Microscopic and Anticancer Activity of 1,8-Diaminonaphthalene Doped ZnO Nanocrystals, VVIJOURNAL 14 (2026) 135-147, |
APA Style
Rajendiran, N., Mani, A., Ramasamy, P., Senthilmurugan, S. (2026). Preparation of 3-Anisidine–Cyclodextrin Doped Silver Nanomaterials and Investigation of 3AS–CD Inclusion Complex at Different pH. American Journal of Nanosciences, 10(2), 41-51. https://doi.org/10.11648/j.ajn.20261002.11
ACS Style
Rajendiran, N.; Mani, A.; Ramasamy, P.; Senthilmurugan, S. Preparation of 3-Anisidine–Cyclodextrin Doped Silver Nanomaterials and Investigation of 3AS–CD Inclusion Complex at Different pH. Am. J. Nanosci. 2026, 10(2), 41-51. doi: 10.11648/j.ajn.20261002.11
@article{10.11648/j.ajn.20261002.11,
  author = {Narayanasamy Rajendiran and Ayyadurai Mani and Palanichamy Ramasamy and Sengamalai Senthilmurugan},
  title = {Preparation of 3-Anisidine–Cyclodextrin Doped Silver Nanomaterials and Investigation of 3AS–CD Inclusion Complex at Different pH},
  journal = {American Journal of Nanosciences},
  volume = {10},
  number = {2},
  pages = {41-51},
  doi = {10.11648/j.ajn.20261002.11},
  url = {https://doi.org/10.11648/j.ajn.20261002.11},
  eprint = {https://article.sciencepublishinggroup.com/pdf/10.11648.j.ajn.20261002.11},
  abstract = {The spectral properties of the silver–3-anisidine–cyclodextrin (Ag: 3AS: CD) inclusion complex nanomaterials in solution were investigated using UV–visible, steady-state fluorescence, time-resolved fluorescence, SEM, DSC, FTIR, XRD, 1H NMR, and molecular modeling methods. The distinct spectral changes observed for 3AS upon the addition of CDs at different pH values indicate that the geometries of the resulting inclusion complexes vary with pH. While 3AS exhibits a single emission maximum in solvents and in α-CD, a dual emission is observed in β-CD. The lifetimes of the inclusion complexes were longer than that of the free 3AS molecule. The relatively narrow cavity of α-CD likely restricts the free rotation of the amino or methoxy groups of 3AS, inhibiting ICT-state formation and thereby enhancing the normal emission. The calculated HOMO–LUMO energy gap, total energy, free energy, enthalpy, entropy, dipole moment, and zero-point vibrational energy of the CD: 3AS complex differed significantly from those of the isolated 3AS, α-CD and β-CD molecules, and both the vertical and horizontal bond lengths between the amino and methoxy groups are smaller than the β-CD cavity size confirming the formation of an inclusion complex. SEM images and EDX analysis confirm the presence of silver in the Ag: 3AS: β-CD nanomaterials. In the FTIR spectra, most characteristic peaks diminish or disappear, accompanied by a marked decrease in intensity for the Ag: 3AS: CD nanocomplexes, suggesting strong interactions between 3AS and nano silver. The 1H NMR chemical shifts of 3AS protons move both upfield and downfield indicating restricted mobility and strong host–guest interactions within the nano Ag–CD matrix.},
 year = {2026}
}
TY  - JOUR
T1  - Preparation of 3-Anisidine–Cyclodextrin Doped Silver Nanomaterials and Investigation of 3AS–CD Inclusion Complex at Different pH
AU  - Narayanasamy Rajendiran
AU  - Ayyadurai Mani
AU  - Palanichamy Ramasamy
AU  - Sengamalai Senthilmurugan
Y1  - 2026/04/13
PY  - 2026
N1  - https://doi.org/10.11648/j.ajn.20261002.11
DO  - 10.11648/j.ajn.20261002.11
T2  - American Journal of Nanosciences
JF  - American Journal of Nanosciences
JO  - American Journal of Nanosciences
SP  - 41
EP  - 51
PB  - Science Publishing Group
SN  - 2575-4858
UR  - https://doi.org/10.11648/j.ajn.20261002.11
AB  - The spectral properties of the silver–3-anisidine–cyclodextrin (Ag: 3AS: CD) inclusion complex nanomaterials in solution were investigated using UV–visible, steady-state fluorescence, time-resolved fluorescence, SEM, DSC, FTIR, XRD, 1H NMR, and molecular modeling methods. The distinct spectral changes observed for 3AS upon the addition of CDs at different pH values indicate that the geometries of the resulting inclusion complexes vary with pH. While 3AS exhibits a single emission maximum in solvents and in α-CD, a dual emission is observed in β-CD. The lifetimes of the inclusion complexes were longer than that of the free 3AS molecule. The relatively narrow cavity of α-CD likely restricts the free rotation of the amino or methoxy groups of 3AS, inhibiting ICT-state formation and thereby enhancing the normal emission. The calculated HOMO–LUMO energy gap, total energy, free energy, enthalpy, entropy, dipole moment, and zero-point vibrational energy of the CD: 3AS complex differed significantly from those of the isolated 3AS, α-CD and β-CD molecules, and both the vertical and horizontal bond lengths between the amino and methoxy groups are smaller than the β-CD cavity size confirming the formation of an inclusion complex. SEM images and EDX analysis confirm the presence of silver in the Ag: 3AS: β-CD nanomaterials. In the FTIR spectra, most characteristic peaks diminish or disappear, accompanied by a marked decrease in intensity for the Ag: 3AS: CD nanocomplexes, suggesting strong interactions between 3AS and nano silver. The 1H NMR chemical shifts of 3AS protons move both upfield and downfield indicating restricted mobility and strong host–guest interactions within the nano Ag–CD matrix.
VL  - 10
IS  - 2
ER  -
Department of Chemistry, Annamalai University, Annamalai Nagar, India
Department of Chemistry, Annamalai University, Annamalai Nagar, India
Molecular Biophysics Unit, Indian Institute of Science, Bangalore, India
Department of Zoology, Annamalai University, Annamalai Nagar, India
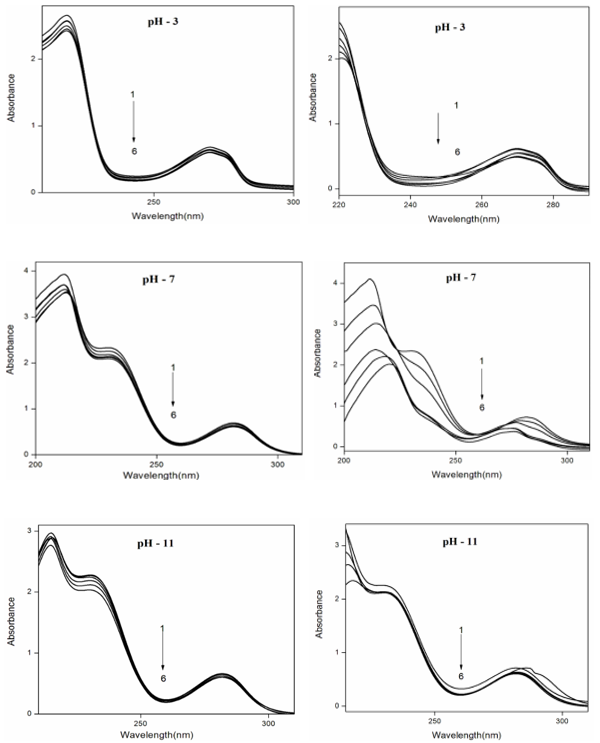
Figure 1. Absorbance spectra of 3AS in different α-CD and β-CD concentrations (M): (1) 0, (2) 0.002, (3) 0.004, (4) 0.006, (5) 0.008 and (6) 0.01.
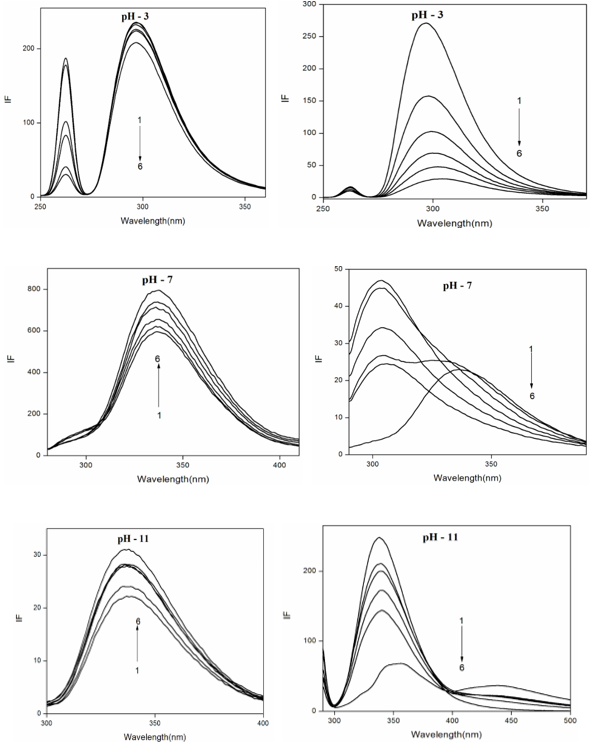
Figure 2. Fluorescence spectra of 3AS in different α-CD and β-CD concentrations (M): (1) 0, (2) 0.002, (3) 0.004, (4) 0.006, (5) 0.008 and (6) 0.01.
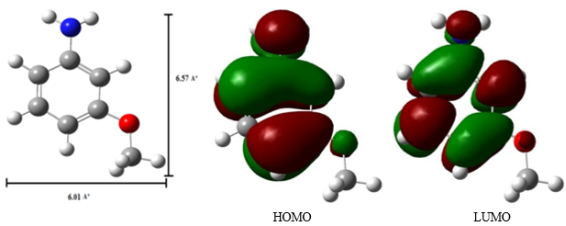
Figure 3. PM3 optimized structures of (a, b) 3AS (c, d) HOMO, LUMO of 3AS.
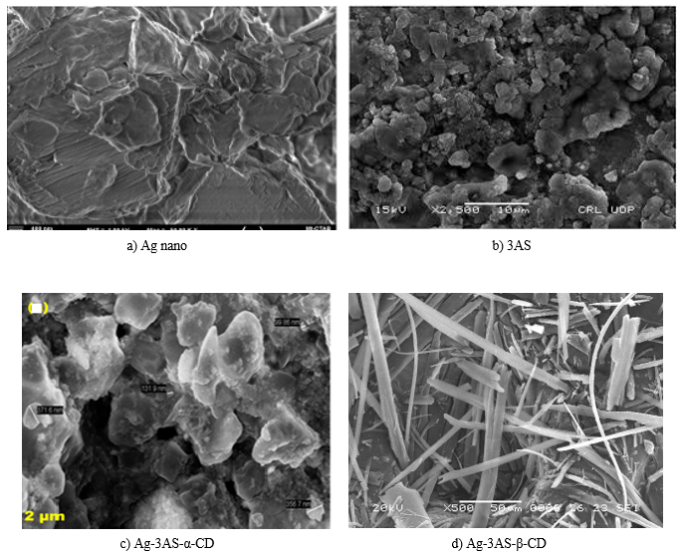
Figure 4. SEM photographs of (a) 3AS, (b) nano Ag: 3AS: α-CD, (b) nano Ag: 3AS: β-CD.
Information

