Controlling heat input (HI) in welding is critical for ensuring joint quality and preventing defects, yet existing models often fail to account for the complex interactions between current, voltage, and welding speed. This study addresses this gap by developing a predictive model to optimize HI, focusing on gas metal arc welding (GMAW) of low-carbon steel. The aim was to establish precise parameter combinations that balance thermal input with weld integrity, particularly for industrial applications requiring controlled heat management. A central composite design (CCD) within Response Surface Methodology (RSM) was employed, systematically varying current (180–240 A), voltage (18–24 V), and welding speed (70–100 mm/min). Heat input was calculated using the standard HI formula, and a quadratic regression model was developed and validated through ANOVA, lack-of-fit tests, and diagnostic metrics. The model's robustness was confirmed with R² = 0.9933 and Adeq. Precision = 46.561, ensuring reliability for industrial use. The results identified voltage as the most influential parameter (p < 0.0001), with optimal conditions (200 A, 21.07 V, 70 mm/min) achieving HI = 1.24 kJ/mm and 87.5% desirability. The study demonstrates that controlled voltage-speed interactions are key to minimizing HI while maintaining joint quality. These findings provide actionable insights for welding optimization, recommending future expansion to high-alloy materials and real-time HI monitoring for broader industrial adoption.
| Published in | American Journal of Mechanical and Materials Engineering (Volume 10, Issue 1) |
| DOI | 10.11648/j.ajmme.20261001.12 |
| Page(s) | 8-17 |
| Creative Commons |
This is an Open Access article, distributed under the terms of the Creative Commons Attribution 4.0 International License (http://creativecommons.org/licenses/by/4.0/), which permits unrestricted use, distribution and reproduction in any medium or format, provided the original work is properly cited. |
| Copyright |
Copyright © The Author(s), 2026. Published by Science Publishing Group |
Heat Input (HI), Gas Metal Arc Welding (GMAW), Welding Optimization, Response Surface Methodology (RSM)
S/N | Input | Response | ||
|---|---|---|---|---|
Current (ampere) | Voltage (voltage) | Welding speed (mm/min) | Heat input Kj/mm | |
1 | 170 | 20 | 100 | 2.04 |
2 | 200 | 20 | 70 | 3.43 |
3 | 159.77 | 21.5 | 85 | 2.42 |
4 | 200 | 23 | 70 | 3.94 |
5 | 170 | 23 | 100 | 2.34 |
6 | 210.23 | 21.5 | 85 | 3.19 |
7 | 185 | 21.5 | 85 | 2.81 |
8 | 185 | 18.98 | 85 | 2.48 |
9 | 200 | 23 | 100 | 2.76 |
10 | 185 | 21.5 | 85 | 2.81 |
11 | 185 | 21.5 | 85 | 2.81 |
12 | 185 | 21.5 | 85 | 2.81 |
13 | 185 | 21.5 | 85 | 2.81 |
14 | 170 | 23 | 70 | 3.35 |
15 | 200 | 20 | 100 | 2.40 |
16 | 185 | 21.5 | 85 | 2.81 |
17 | 185 | 21.5 | 110.23 | 2.17 |
18 | 185 | 21.5 | 59.77 | 3.99 |
19 | 185 | 24.02 | 85 | 3.14 |
20 | 170 | 20 | 70 | 2.91 |
Source | Sum of | Df | Mean | F | p-value | |
|---|---|---|---|---|---|---|
Squares | Square | Value | Prob > F | |||
Mean vs Total | 217.67 | 1 | 217.67 | |||
Linear vs Mean | 14.15 | 3 | 4.72 | 1.03 | 0.4059 | |
2FI vs Linear | 28.60 | 3 | 9.53 | 2.77 | 0.0836 | |
Quadratic vs 2FI | 44.12 | 3 | 14.71 | 251.18 | < 0.0001 | Suggested |
Cubic vs Quadratic | 0.58 | 4 | 0.14 | 110.34 | < 0.0001 | Aliased |
Residual | 7.853E-003 | 6 | 1.309E-003 | |||
Total | 305.13 | 20 | 15.26 |
Source | Sum of | Df | Mean | F | p-value | |
|---|---|---|---|---|---|---|
Squares | Square | Value | Prob > F | |||
Linear | 73.31 | 11 | 6.66 | |||
2FI | 44.71 | 8 | 5.59 | 9.73 | 0.0096 | |
Quadratic | 0.59 | 5 | 0.12 | 4.56 | 0.0616 | |
Cubic | 7.853E-003 | 1 | 7.853E-003 | 0.55 | 0.8012 | Suggested |
Pure Error | 0.000 | 5 | 0.000 | 0.65 | 0.5614 | Aliased |
Linear | 73.31 | 11 | 6.66 |
Source | Sum of | Df | Mean | F | p-value | |
|---|---|---|---|---|---|---|
Squares | Square | Value | Prob > F | |||
Model | 86.87 | 9 | 9.65 | 164.86 | < 0.0001 | Significant |
A-current | 0.026 | 1 | 0.026 | 0.45 | 0.5193 | |
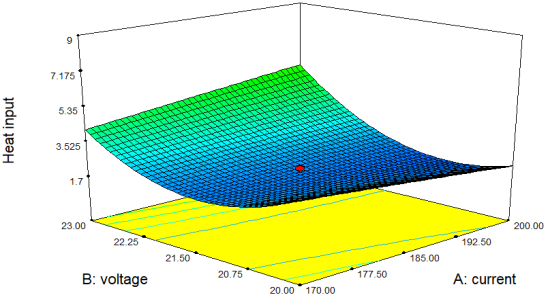
B-voltage | 13.80 | 1 | 13.80 | 235.66 | < 0.0001 | |
C-welding speed | 0.33 | 1 | 0.33 | 5.57 | 0.0399 | |
AB | 3.13 | 1 | 3.13 | 53.37 | < 0.0001 | |
AC | 10.35 | 1 | 10.35 | 176.79 | < 0.0001 | |
BC | 15.13 | 1 | 15.13 | 258.32 | < 0.0001 | |
A^2 | 1.950E-004 | 1 | 1.950E-004 | 3.330E-003 | 0.9551 | |
B^2 | 43.24 | 1 | 43.24 | 738.59 | < 0.0001 | |
C^2 | 2.941E-003 | 1 | 2.941E-003 | 0.050 | 0.8272 | |
Residual | 0.59 | 10 | 0.059 | 8.13 | 0.0122 | |
Lack of Fit | 0.59 | 5 | 0.12 | 16.93 | 0.0616 | not significant |
Pure Error | 0.000 | 5 | 0.000 | 51.52 | ||
Cor Total | 87.46 | 19 | 8.24 |
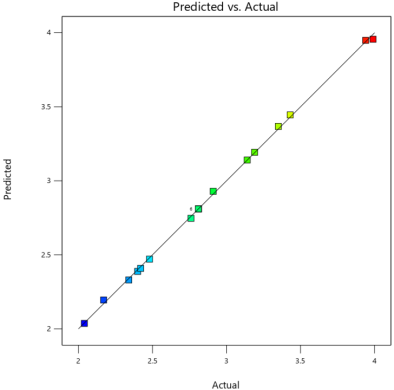
Std. Dev. | 0.24 | R-Squared | 0.9933 |
Mean | 3.30 | Adj R-Squared | 0.9873 |
C.V.% | 7.33 | Pred R-Squared | 0.9469 |
PRESS | 4.64 | Adeq Precision | 46.561 |
Run Order | Actual Value | Predicted Value | Residual | Leverage | Internally Studentized Residuals | Externally Studentized Residuals | Cook's Distance | Influence on Fitted Value DFFITS | Standard Order |
|---|---|---|---|---|---|---|---|---|---|
1 | 2.04 | 2.04 | 0.0031 | 0.67 | 0.292 | 0.278 | 0.017 | 0.396 | 2 |
2 | 3.43 | 3.45 | -0.0155 | 0.67 | -1.466 | -1.57 | 0.436 | -2.236⁽¹⁾ | 14 |
3 | 2.42 | 2.41 | 0.0114 | 0.607 | 0.992 | 0.991 | 0.152 | 1.233 | 19 |
4 | 3.94 | 3.95 | -0.009 | 0.67 | -0.852 | -0.839 | 0.147 | -1.195 | 17 |
5 | 2.34 | 2.33 | 0.0096 | 0.67 | 0.906 | 0.897 | 0.166 | 1.278 | 7 |
6 | 3.19 | 3.19 | -0.0031 | 0.607 | -0.266 | -0.253 | 0.011 | -0.315 | 11 |
7 | 2.81 | 2.81 | -0.0002 | 0.166 | -0.014 | -0.014 | 0 | -0.006 | 4 |
8 | 2.48 | 2.47 | 0.0089 | 0.607 | 0.775 | 0.759 | 0.093 | 0.942 | 18 |
9 | 2.76 | 2.75 | 0.0132 | 0.67 | 1.246 | 1.286 | 0.315 | 1.832 | 5 |
10 | 2.81 | 2.81 | -0.0002 | 0.166 | -0.014 | -0.014 | 0 | -0.006 | 8 |
11 | 2.81 | 2.81 | -0.0002 | 0.166 | -0.014 | -0.014 | 0 | -0.006 | 10 |
12 | 2.81 | 2.81 | -0.0002 | 0.166 | -0.014 | -0.014 | 0 | -0.006 | 12 |
13 | 2.81 | 2.81 | -0.0002 | 0.166 | -0.014 | -0.014 | 0 | -0.006 | 16 |
14 | 3.35 | 3.37 | -0.0176 | 0.67 | -1.665 | -1.858 | 0.563 | -2.647⁽¹⁾ | 1 |
15 | 2.4 | 2.39 | 0.0117 | 0.67 | 1.105 | 1.119 | 0.248 | 1.594 | 3 |
16 | 2.81 | 2.81 | -0.0002 | 0.166 | -0.014 | -0.014 | 0 | -0.006 | 20 |
17 | 2.17 | 2.2 | -0.0251 | 0.607 | -2.182 | -2.861 | 0.737 | -3.559⁽¹⁾ | 15 |
18 | 3.99 | 3.96 | 0.0335 | 0.607 | 2.909 | 7.034⁽²⁾ | 1.309⁽¹⁾ | 8.750⁽¹⁾ | 9 |
19 | 3.14 | 3.14 | -0.0006 | 0.607 | -0.048 | -0.046 | 0 | -0.057 | 6 |
20 | 2.91 | 2.93 | -0.0191 | 0.67 | -1.806 | -2.087 | 0.662 | -2.973⁽¹⁾ | 13 |
Number | current | voltage | welding speed | Heat input | Desirability |
|---|---|---|---|---|---|
1 | 200.00 | 21.07 | 70.00 | 1.24071 | 0.875 |
2 | 199.93 | 21.02 | 70.01 | 1.27637 | 0.874 |
3 | 200.00 | 21.30 | 70.00 | 1.16754 | 0.872 |
4 | 199.75 | 20.93 | 70.00 | 1.34624 | 0.870 |
5 | 200.00 | 20.26 | 70.00 | 2.15025 | 0.838 |
6 | 170.00 | 20.79 | 99.80 | 0.357955 | 0.686 |
ANN | Artificial Neural Networks |
CCD | Central Composite Design |
DF | Degree of Freedom |
GMAW | Gas Metal Arc Welding |
HAZ | Heat-affected Zone |
HI | Heat Input |
RSM | Response Surface Methodology |
| [1] | Murugan, V. V., Gunaraj, V., 2005. Effects of Process Parameters on Angular Distortion of Gas Metal Arc Welded Structural Steel Plates. Welding Journal, Research Supplement, (November), p. 165s–171s. |
| [2] | Biswas, P., Mandal, N. R., Vasu, P., Padasalag, S. B. 2011. A study on port plug distortion caused by narrow gap combined GTAW & SMAW and Electron Beam Welding. Fusion Engineering and Design, 86(1), pp. 99–105. |
| [3] | Ganesh, K. C., Vasudevan, M., Balasubramanian, K. R., Chandrasekhar, N., Mahadevan, S., Vasantharaja, P., Jayakumar, T., 2014. Modeling, Prediction and Validation of Thermal Cycles, Residual Stresses and Distortion in Type 316 LN Stainless Steel Weld Joint made by TIG Welding Process. Procedia Engineering, 86, pp. 767–774. |
| [4] | Guo, Y., Wu, D., Ma, G., Guo, D., 2014. Trailing heat sink effects on residual stress and distortion of pulsed laser welded Hastelloy C-276 thin sheets. Journal of Materials Processing Technology, 214(12), pp. 2891–2899. |
| [5] | Colegrove, P. A., Ikeagu, C., ThistlethWait, A., Williams, S., Nagy, T., Suder, W., Steuwer, A., Pirling, T., 2009. Welding process impact on residual stress and distortion. 14(8), pp. 717–726. |
| [6] | Fu, G., Lourenco, M. I., Duan, M., Estefan, S. F., 2014. Effect of boundary conditions on residual stress and distortion in T-joint welds 3D Finite Element Model a b. JCSR, 102, pp. 121–135. |
| [7] | Adak, M., Guedes Soares, C., 2014. Effects of different restraints on the weld-induced residual deformations and stresses in a steel plate. International Journal of Advanced Manufacturing Technology, 71, pp. 699–710. |
| [8] | Otimeyin, A. W., Achebo, J. I., & Frank, U. (2025). Advanced Modeling and Optimization of Weldment Responses Using Statistical and Metaheuristic Techniques. American Journal of Mechanical and Materials Engineering, 9(1), 25-36. |
| [9] | Achebo, J. I., 2009. Computational analysis of erosion wear rate in a pipeline using the drift flux models based on Eulerian continuum equations. Proceedings of the World Congress on Engineering, 1, pp. 1–3. |
| [10] | Achebo, J. I., 2011. Optimization of GMAW protocols and parameters for improving weld strength quality applying the Taguchi method. Proceedings of the World Congress on Engineering, 1, pp. 6–8. |
| [11] | Odinikuku, W. E., Achebo, J., 2015. Optimization of gas metal arc welding process parameters using standard deviation (SDV) and multi-objective optimization on the basis of ratio analysis (MOORA). Journal of Minerals and Materials Characterization and Engineering, 3(4), pp. 298–304. |
| [12] | Achebo, J. and Omoregie, M., 2015. Application of multi-criteria decision making optimization tool for determining mild steel weld properties and process parameters using the TOPSIS. International Journal of Materials Science and Applications, 4(3), pp. 149–158. |
| [13] | Abhulimen, I. U. and Achebo, J. I., 2014. Application of artificial neural network in predicting the weld quality of a tungsten inert gas welded mild steel pipe joint. International Journal of Scientific & Technology Research, 3(1), pp. 277–285. |
| [14] | Sada, S. O. O. and Achebo, J., 2022. Optimisation and prediction of the weld bead geometry of a mild steel metal inert gas weld. Advances in Materials and Processing Technologies, 8(2), pp. 1625–1634. |
| [15] | Achebo, J. I., 2012. Complex behavior of forces influencing molten weld metal flow based on static force balance theory. Physics Procedia, 25, pp. 317–324. |
| [16] | Kastelic, S., Medved, J., Mrvar, P., 2010. Prediction of Numerical Distortion after Welding with Various Welding Sequences and Clampings. 49(4), pp. 301–305. |
APA Style
Oruowho, O. B., Ifeanyi, A. J., Kessington, O., Frank, U., Collins, E., et al. (2026). Optimization of Welding Parameters for Controlled Heat Input Using Response Surface Methodology: A Multivariate Analysis of Current, Voltage, and Speed Interactions. American Journal of Mechanical and Materials Engineering, 10(1), 8-17. https://doi.org/10.11648/j.ajmme.20261001.12
ACS Style
Oruowho, O. B.; Ifeanyi, A. J.; Kessington, O.; Frank, U.; Collins, E., et al. Optimization of Welding Parameters for Controlled Heat Input Using Response Surface Methodology: A Multivariate Analysis of Current, Voltage, and Speed Interactions. Am. J. Mech. Mater. Eng. 2026, 10(1), 8-17. doi: 10.11648/j.ajmme.20261001.12
AMA Style
Oruowho OB, Ifeanyi AJ, Kessington O, Frank U, Collins E, et al. Optimization of Welding Parameters for Controlled Heat Input Using Response Surface Methodology: A Multivariate Analysis of Current, Voltage, and Speed Interactions. Am J Mech Mater Eng. 2026;10(1):8-17. doi: 10.11648/j.ajmme.20261001.12
@article{10.11648/j.ajmme.20261001.12,
  author = {Odio Benjamin Oruowho and Achebo Joseph Ifeanyi and Obahiagbon Kessington and Uwoghiren Frank and Etin-Osa Collins and Aliyegbenoma Cyril Omamuzo},
  title = {Optimization of Welding Parameters for Controlled Heat Input Using Response Surface Methodology: A Multivariate Analysis of Current, Voltage, and Speed Interactions},
  journal = {American Journal of Mechanical and Materials Engineering},
  volume = {10},
  number = {1},
  pages = {8-17},
  doi = {10.11648/j.ajmme.20261001.12},
  url = {https://doi.org/10.11648/j.ajmme.20261001.12},
  eprint = {https://article.sciencepublishinggroup.com/pdf/10.11648.j.ajmme.20261001.12},
  abstract = {Controlling heat input (HI) in welding is critical for ensuring joint quality and preventing defects, yet existing models often fail to account for the complex interactions between current, voltage, and welding speed. This study addresses this gap by developing a predictive model to optimize HI, focusing on gas metal arc welding (GMAW) of low-carbon steel. The aim was to establish precise parameter combinations that balance thermal input with weld integrity, particularly for industrial applications requiring controlled heat management. A central composite design (CCD) within Response Surface Methodology (RSM) was employed, systematically varying current (180–240 A), voltage (18–24 V), and welding speed (70–100 mm/min). Heat input was calculated using the standard HI formula, and a quadratic regression model was developed and validated through ANOVA, lack-of-fit tests, and diagnostic metrics. The model's robustness was confirmed with R² = 0.9933 and Adeq. Precision = 46.561, ensuring reliability for industrial use. The results identified voltage as the most influential parameter (p ), with optimal conditions (200 A, 21.07 V, 70 mm/min) achieving HI = 1.24 kJ/mm and 87.5% desirability. The study demonstrates that controlled voltage-speed interactions are key to minimizing HI while maintaining joint quality. These findings provide actionable insights for welding optimization, recommending future expansion to high-alloy materials and real-time HI monitoring for broader industrial adoption.},
 year = {2026}
}
TY  - JOUR
T1  - Optimization of Welding Parameters for Controlled Heat Input Using Response Surface Methodology: A Multivariate Analysis of Current, Voltage, and Speed Interactions
AU  - Odio Benjamin Oruowho
AU  - Achebo Joseph Ifeanyi
AU  - Obahiagbon Kessington
AU  - Uwoghiren Frank
AU  - Etin-Osa Collins
AU  - Aliyegbenoma Cyril Omamuzo
Y1  - 2026/02/14
PY  - 2026
N1  - https://doi.org/10.11648/j.ajmme.20261001.12
DO  - 10.11648/j.ajmme.20261001.12
T2  - American Journal of Mechanical and Materials Engineering
JF  - American Journal of Mechanical and Materials Engineering
JO  - American Journal of Mechanical and Materials Engineering
SP  - 8
EP  - 17
PB  - Science Publishing Group
SN  - 2639-9652
UR  - https://doi.org/10.11648/j.ajmme.20261001.12
AB  - Controlling heat input (HI) in welding is critical for ensuring joint quality and preventing defects, yet existing models often fail to account for the complex interactions between current, voltage, and welding speed. This study addresses this gap by developing a predictive model to optimize HI, focusing on gas metal arc welding (GMAW) of low-carbon steel. The aim was to establish precise parameter combinations that balance thermal input with weld integrity, particularly for industrial applications requiring controlled heat management. A central composite design (CCD) within Response Surface Methodology (RSM) was employed, systematically varying current (180–240 A), voltage (18–24 V), and welding speed (70–100 mm/min). Heat input was calculated using the standard HI formula, and a quadratic regression model was developed and validated through ANOVA, lack-of-fit tests, and diagnostic metrics. The model's robustness was confirmed with R² = 0.9933 and Adeq. Precision = 46.561, ensuring reliability for industrial use. The results identified voltage as the most influential parameter (p ), with optimal conditions (200 A, 21.07 V, 70 mm/min) achieving HI = 1.24 kJ/mm and 87.5% desirability. The study demonstrates that controlled voltage-speed interactions are key to minimizing HI while maintaining joint quality. These findings provide actionable insights for welding optimization, recommending future expansion to high-alloy materials and real-time HI monitoring for broader industrial adoption.
VL  - 10
IS  - 1
ER  -
Department of Production Engineering, University of Benin, Benin City, Nigeria
Department of Production Engineering, University of Benin, Benin City, Nigeria
Department of Production Engineering, University of Benin, Benin City, Nigeria
Department of Production Engineering, University of Benin, Benin City, Nigeria
Department of Production Engineering, University of Benin, Benin City, Nigeria
Department of Production Engineering, University of Benin, Benin City, Nigeria
Information