Abstract
This article describes a method for predicting the values of track’s geometric characteristics during the period between two consecutive measurements. As is known, track condition analysis is based on periodic measurements of geometric parameters. Changes in track condition manifest as an increase in the size of “large” defects and a decrease in “small” ones. This process is non-stationary, dependent on the physical properties of the track and axle load, and is not linked to the measurement schedule. Therefore, there may be situations where defects (irregularities) of critical or near-critical size emerge between measurements, which can lead to undesirable consequences. The issue of predicting the emergence of new defects, larger than those recorded in the most recent measurement, during the period between measurements, has not been explored. Naturally, such defects should be addressed without waiting for the next measurement cycle. It should be noted that in reliability theory, this process corresponds to the concept of an unexpected failure. Our approach addresses the problem of preventive track maintenance by providing information on defects whose sizes exceed the maximum sizes registered during the most recent measurement, prior to the next measurement cycle (1-2 months). The method also allows to identify sudden spontaneous deterioration of the track, which does not follow from a regular trend. The method is based on using the homogeneity (compactness) property of the results from successive measurements of the geometric characteristics of the track. Calculations are performed using the Irregularity Size Distribution Function (ISDF). For the analysis, we use exponential approximation of this function. Classification of the results and decision-making regarding the occurrence of a defect larger than the maximum size before the next measurement is made using the k-nearest neighbors’ method, which is commonly used in artificial intelligence tasks. According to the results of the experiment, for defects of the surface type, the probability of correctly predicting the spontaneous increase in the maximum defect size before the next measurement is 0.89, while the probability of a false positive is 0.11.
Keywords
Rail Track, Degradation, Track Condition Prediction
1. Introduction
Track degradation significantly impacts traffic safety. Therefore, predicting track degradation is crucial to ensure a high level of track technical condition, optimize maintenance plans, and reduce maintenance costs. A large number of studies have been dedicated to analyzing the process of changes in the sizes of defects recorded on the track.
| [1] | Najawae et al. Degradation prediction of rail tracks: a review of the existing literature. The open transportation journal, 2018, 12, 88-104. |
| [2] | R. Dekker et al. (Erasmus University Rotterdam), Predicting rail geometry deterioration by regression models” – (advances in safety, reliability and risk management - Berenguer, Clarr & Guedes Soares, London ISBN 978-0-415-6837901). |
| [3] | Chen. X. M. et. al Intergreting factor method for predicting the developing trend of railway track irregularity, China railway science, vol 27, no 6. 2006. |
[1-3]
. It should be noted that all predictive models described in well-known publications represent the behavior of the track with some degree of inaccuracy, the magnitude of which depends on axle loads, structural characteristics of the track, environmental factors, etc. The use of this approach is problematic due to the large number of track parameters and the wide range of values for each parameter.
A more realistic approach to solving this problem is considered in study
| [4] | G. Krug, Adaptive Multipoint Method for Predicting Geometric parameters on the Railway track Based on Convergence Theory. American Journal of Mechanical and Industrial Engineering, vol. 7, N1, 2022. |
[4]
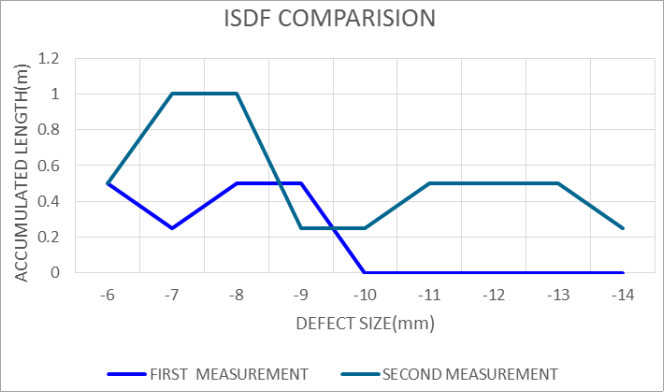
. As analysis of the condition of 100 randomly selected track segments has shown, defects with a size Smax(n+1)>Smax(n), where n is the measurement cycle number, arise between measurements in 10-15% of segments. An example of this phenomenon is shown in
Figure 1.
Figure 1. Comparison of ISDF values for two consecutive measurements (two-month interval).
Track condition changes manifest as an increase in the size of “large” defects and a decrease in “small” ones. This process is non-stationary, dependent on the physical properties of the track and axle load, and is not strictly related to the measurement schedule. Therefore, situations may arise where defects of critical or near-critical sizes occur between measurements, with no corresponding information available. Naturally, the appearance of such defects between measurements could lead to undesirable consequences.
The process of predicting the emergence of defects larger than those recorded, occurring between measurements, has not been extensively studied. The occurrence of such defects is a random variable. Their emergence correlates with the concept of unexpected failure in reliability theory.
2. General Overview of the Method
The goal of this work is to create a method that predicts the spontaneous emergence of defects larger than those already recorded:
where n is the cycle number of the ISDF measurement.
To this end, we explore the possibility of using the track condition information contained in the results of the previous measurement cycle. This approach is applicable if the functions describing the results of these two consecutive measurements are homogeneous. Analysis confirmed the validity of this approach.
The method is based on the following key assumptions:
1) Baseline information about the track condition comes only from the results of the previous measurements, without using prior models.
2) Track condition and its changes are described by the ISDF and its exponential approximation.
3) Predicted values of the ISDF are based on the homogeneity property of this function between two consecutive measurement results.
4) Classification of calculations’ results is performed using the k-nearest neighbors method based on calculation of the Euclidean distance between two defect size values.
3. Input Data
The baseline information on track characteristics for prediction purposes comes from the results of previous measurements, with precise positioning along the track. The data is presented in the form of a measurement results’ table, with a discretization defined by the characteristics of the measurement system. In this study, data with a discretization of 0.25 meters were used.
4. ISDF Function’s Properties
To describe the condition and changes in the geometric parameters of the track over time comprehensively and without distortion, it is necessary to use a function whose values uniquely characterize the process. For a complete and undistorted description of the track condition (unlike SD and TQI parameters
| [5] | C. Ciobani, Use of inherent standard deviations as track design parameters. The Journal of Permanent Institution. Oktober 2018, vol 136, part 4. |
| [6] | G. Krug, J. Madejski Track Quality Assessment Problems ZEV Rail 142(2018)-6-7. |
[5, 6]
, we use a function derived from the original random process (which consists of the population of measurement results for each track segment) called the Irregularity Size Distribution Function (ISDF)
| [9] | G. Krug, Analysis of track Condition based on application of the Irregularity Length Cumulative Distribution Function. Lecture Notes in Civil Engineering, volume 49, Springer, 2020. |
[9]
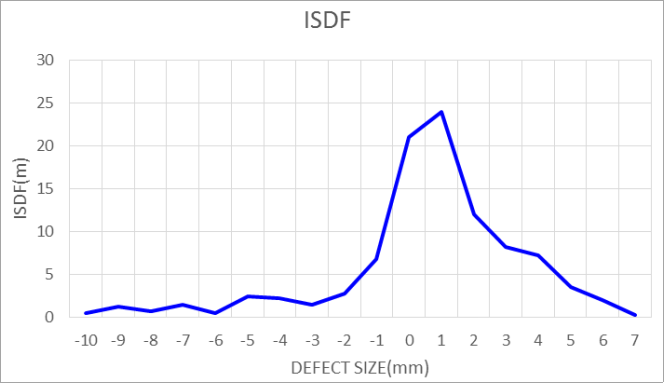
. The ISDF shows the cumulative length of each size of track irregularity within a track segment. An example of the ISDF for a surface-type defect is shown in
Figure 2.
Figure 2. Representation of the ISDF function.
The ISDF contains complete information about the condition of the track and describes the values of track geometric parameters and their changes over time unambiguously, without distortion, and with any pre-selected level of accuracy ΔS:
5. Theoretical Model
The goal of this study is to investigate the possibility of using the information contained in the ISDF, which describes the results of the past measurements, to predict the spontaneous growth of defects with size Smax in the future. This approach requires that ISDF(1) and ISDF(2), representing the past and future measurements, be homogeneous.
A necessary but not sufficient condition for homogeneity is that the samples come from the same population or that the samples represent observations of the same random variable. A sufficient condition for homogeneity is that the samples meet certain criteria. In this study, we analyze the conformity of the functions to the coefficient of variation (CV) and correlation coefficient (CC) criteria.
5.1. Coefficient of Variation (CV) Criterion
The coefficient of variation (CV) indicates the degree of variability of data in a sample relative to the mean value. It is calculated using the formula:
where:
σ is the standard deviation of the sample,
μ is the mean value.
The CV represents a statistical measure of the dispersion of data relative to the mean value. Comparing the CV values for two samples allows one to assess their homogeneity. The average value of the CV RATIO for 49 measurements is 1.03, and the minimum value exceeds 0.8, indicating a high degree of homogeneity between the realizations.
This section emphasizes the importance of statistical methods, such as the coefficient of variation and correlation coefficient, in verifying the homogeneity of the ISDF functions for consecutive track measurements. The approach ensures that any prediction made about defect growth between measurement cycles is based on consistent, reliable data.
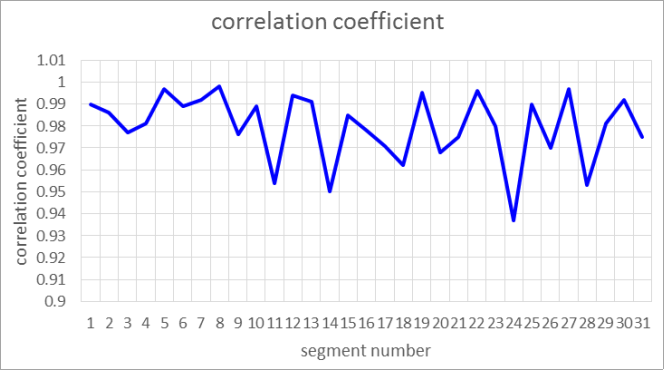
5.2. Correlation Coefficient (CC) Criterion
The correlation coefficient (CC) represents a quantitative measure of the statistical relationship between two processes. For this analysis, we used Spearman's rank correlation coefficient. This coefficient ranges from -1 to +1, where a value of +1 indicates a perfect positive correlation between the two processes being studied.
Average CC value for 31 randomly selected ISDF value for two consecutive measurements of the same track segment is 0.979, and the standard deviation is 0.016. This section highlights the importance of using Spearman's rank correlation as a tool for analyzing the consistency of the ISDF function over multiple measurement cycles. A strong correlation is essential for ensuring that predictions of defect growth are based on reliable and consistent data, reinforcing the method's ability to predict unexpected defect changes between routine measurements.
It should be noted that the homogeneity property of the results corresponds to the convergence property of the measurements of track geometric characteristics, as substantiated by SATO
| [7] | Y. SATO, Convergence Theory Including Spot Tamping, Conference on Railway Engineering, s. 507-511, Australia, 1998. |
[7]
and the memory effect of the track
| [8] | B. Lichtberger, Track Compendium, Eurail press, 2022. |
[8]
. These properties indicate that, over time, the track's behavior (in terms of defects) tends to follow predictable patterns, and the consistency of measurements from one cycle to the next is a key factor in ensuring accurate predictions.
The next stage of verifying the homogeneity of the functions, and consequently the possibility of using the current values of the ISDF(1) function for predicting the appearance of defects, is comparing the actual and calculated values of the ISDF(2) function at the point S(max₁+1).
6. Calculation Procedure
The analytical process for obtaining predictable values of ISDF(2) at the point S(max₁+1) includes the following steps:
1) Calculation of current ISDF function values for each of the geometric parameters of the path,
2) Approximation of the ISDF(1) function by an exponential function using the least squares method,
3) Classification of ISDF(2) values at the point S(max₁+1).
In this work, the analysis uses the approximation of the ISDF by an exponential function using the least squares method.
where:
y is the amplitude of the exponential function,
g is the degree indicator.
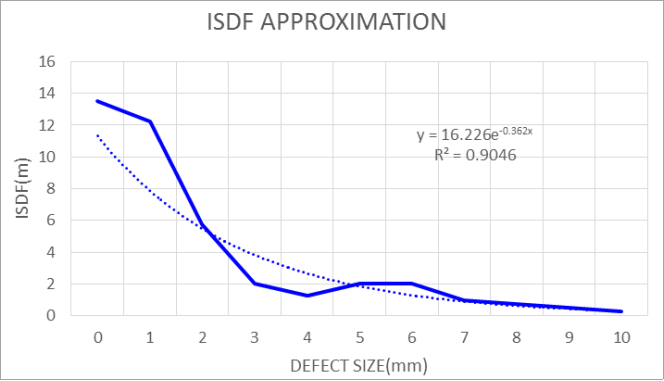
Figure 3 shows examples of the exponential approximation function of ISDF values for maximum defect sizes of 10 mm. As shown in the
Figure 3, the exponential values in the region of the maximum defect sizes nearly coincide with the real values, which allows for effective approximation described by the coefficient of determination R².
Figure 4 shows the distribution of R² values for 50 randomly selected track segments. The average value of this coefficient was 0.925. Thus, the exponential approximation accurately describes the measurement results of the geometric characteristics of the track.
Figure 3. Exponential approximation (Smax=10 mm).
Figure 4. Approximation Quality Indicator.
7. Decision-making Procedure
The property of homogeneity allows the use of ISDF(1) measurement data for the analysis of ISDF(2). In this way, an effective model for predicting the spontaneous growth Smax(1) can be built.
From the perspective of predicting the track condition, it is necessary to determine which of the two possible values the function will take before the next measurement:
1) S>0 (defect size greater than zero), or
2) S=0 (no defect).
The determination is made using the nearest neighbors’ method
| [10] | R. Nisbet, et al. Handbook of Statistical Analysis and Data Mining Applications, Academic Press, Elsever Inc., 2009. |
[10]
. For classification by the nearest neighbors’ method, the results of calculating the Euclidean distance Rԑ for two current values of the ISDF (exp) function are used. These results are compared with the data stored in the data set called training sample. Training sample is obtained from the test measurement results. Euclidean distance Rϵ represents the geometric distance in multidimensional space. To make a decision, the Rϵ value in the two-dimensional Euclidean space is computed between the results of the current measurement Pk, Qk and each point in the sample Pi, Qi.
Calculation of Rϵ for all values in the training sample relative to the actual value is performed using the following formula:
Rϵ=SQRT((Pi -$Pk)²+ (Qi -$Qk)²)(5)
In our case, the three minimum values of Rϵ are used, and the decision is made based on the majority (at least two out of three) to predict one of the two possible outcomes.
Decision table for the three nearest neighbors’ method is shown in
Table 1.
Table 1. Three Nearest Neighbor Method Analysis.
Measurement | First "neighbor" | Second "neighbor" | Third "neighbor" | Conclusion |
Defect | Defect | Defect | Defect | Defect |
No defect | Defect | No defect | Defect | False positive |
Defect | Defect | No defect | Defect | Defect |
Defect | No defect | No defect | Defect | Missed defect |
No defect | Defect | No defect | No defect | No defect |
The key issue with any prediction method is prediction quality, which is described by the number of incorrect decisions. We assess the quality of the algorithm based on the percentage of erroneous decisions, which can be of two types:
1) Missed defects,
2) Incorrect decision regarding the presence of a defect when it does not exist (false positives).
To verify the accuracy of the method, we used a database containing the results of measurements of surface irregularity sizes for 30 km of the track (total of 300 100-meter segments) conducted two months apart. A preliminary analysis revealed 28 track segments (N(W)), with spontaneous increase in the maximum size of the defect. No spontaneous increases were found in the remaining segments (300-28=262). The results of analyzing segments with an increase in the maximum size of the defect are shown in
Table 2. It follows from the table that the probability of correctly detecting the defects is 0. 89. Of the remaining 262 segments with no spontaneous increases, 35(N(V) were randomly selected for analysis cases of false positives. with the results shown in
Table 3.
Table 2. Spontaneous change predicted.
Nominal Defect Size (mm) | N(W) | Number of Errors |
6 | 6 | 1 |
7 | 6 | 1 |
8 | 10 | 0 |
9 | 6 | 1 |
TOTAL | 28 | 3 |
Table 3. False positives analysis.
Nominal Defect Size (mm) | N(V) | Number of Errors |
6 | 8 | 1 |
7 | 13 | 0 |
8 | 6 | 2 |
9 | 8 | 1 |
Total | 35 | 4 |
From the
Table 3, it is evident that the probability of false positives is 0.11. It is also worth noting that making a wrong "rejection" decision does not lead to dangerous consequences for the track condition. Additionally, it should be noted that the quality of analysis depends on the statistical properties of the input information. In particular, the results may be distorted due to the non-uniformity of functions when performing track maintenance works.
8. Conclusion
The article presents theoretical justification and experimental verification of the method for predicting the spontaneous increase of the maximum defect size in track geometry between measurements.
1) The method delivers relevant information directly after the actual measurement.
2) The method uses an effective approximation of the initial data with an exponential function for calculations.
3) The method automatically accounts for the influence of all external factors on changes in the geometric characteristics of the track. Only the results of routine consecutive measurements of track geometry are used in the analysis.
4) The method has been tested over time intervals of 1 and 2 months.
For surface defects, the probability of correctly detecting a spontaneous increase in the maximum defect size is no worse than 0.89, and the probability of errors does not exceed 0.11.
Abbreviations
ISDF | Irregularity Size Distribution Function |
Author Contributions
Grigory Krug is the sole author. The author read and approved the final manuscript.
Conflicts of Interest
The author declares no conflicts of interest.
References
| [1] |
Najawae et al. Degradation prediction of rail tracks: a review of the existing literature. The open transportation journal, 2018, 12, 88-104.
|
| [2] |
R. Dekker et al. (Erasmus University Rotterdam), Predicting rail geometry deterioration by regression models” – (advances in safety, reliability and risk management - Berenguer, Clarr & Guedes Soares, London ISBN 978-0-415-6837901).
|
| [3] |
Chen. X. M. et. al Intergreting factor method for predicting the developing trend of railway track irregularity, China railway science, vol 27, no 6. 2006.
|
| [4] |
G. Krug, Adaptive Multipoint Method for Predicting Geometric parameters on the Railway track Based on Convergence Theory. American Journal of Mechanical and Industrial Engineering, vol. 7, N1, 2022.
|
| [5] |
C. Ciobani, Use of inherent standard deviations as track design parameters. The Journal of Permanent Institution. Oktober 2018, vol 136, part 4.
|
| [6] |
G. Krug, J. Madejski Track Quality Assessment Problems ZEV Rail 142(2018)-6-7.
|
| [7] |
Y. SATO, Convergence Theory Including Spot Tamping, Conference on Railway Engineering, s. 507-511, Australia, 1998.
|
| [8] |
B. Lichtberger, Track Compendium, Eurail press, 2022.
|
| [9] |
G. Krug, Analysis of track Condition based on application of the Irregularity Length Cumulative Distribution Function. Lecture Notes in Civil Engineering, volume 49, Springer, 2020.
|
| [10] |
R. Nisbet, et al. Handbook of Statistical Analysis and Data Mining Applications, Academic Press, Elsever Inc., 2009.
|
Cite This Article
-
APA Style
Krug, G. (2025). Predicting Spontaneous Increases in Maximum Size of Geometric Defects in Railway Tracks. American Journal of Mechanical and Industrial Engineering, 10(2), 40-45. https://doi.org/10.11648/j.ajmie.20251002.11
 Copy
|
Copy
|
 Download
ACS Style
Krug, G. Predicting Spontaneous Increases in Maximum Size of Geometric Defects in Railway Tracks. Am. J. Mech. Ind. Eng. 2025, 10(2), 40-45. doi: 10.11648/j.ajmie.20251002.11
Copy
|
Download
AMA Style
Krug G. Predicting Spontaneous Increases in Maximum Size of Geometric Defects in Railway Tracks. Am J Mech Ind Eng. 2025;10(2):40-45. doi: 10.11648/j.ajmie.20251002.11
Copy
|
Download
-
@article{10.11648/j.ajmie.20251002.11,
  author = {Grigory Krug},
  title = {Predicting Spontaneous Increases in Maximum Size of Geometric Defects in Railway Tracks
},
  journal = {American Journal of Mechanical and Industrial Engineering},
  volume = {10},
  number = {2},
  pages = {40-45},
  doi = {10.11648/j.ajmie.20251002.11},
  url = {https://doi.org/10.11648/j.ajmie.20251002.11},
  eprint = {https://article.sciencepublishinggroup.com/pdf/10.11648.j.ajmie.20251002.11},
  abstract = {This article describes a method for predicting the values of track’s geometric characteristics during the period between two consecutive measurements. As is known, track condition analysis is based on periodic measurements of geometric parameters. Changes in track condition manifest as an increase in the size of “large” defects and a decrease in “small” ones. This process is non-stationary, dependent on the physical properties of the track and axle load, and is not linked to the measurement schedule. Therefore, there may be situations where defects (irregularities) of critical or near-critical size emerge between measurements, which can lead to undesirable consequences. The issue of predicting the emergence of new defects, larger than those recorded in the most recent measurement, during the period between measurements, has not been explored. Naturally, such defects should be addressed without waiting for the next measurement cycle. It should be noted that in reliability theory, this process corresponds to the concept of an unexpected failure. Our approach addresses the problem of preventive track maintenance by providing information on defects whose sizes exceed the maximum sizes registered during the most recent measurement, prior to the next measurement cycle (1-2 months). The method also allows to identify sudden spontaneous deterioration of the track, which does not follow from a regular trend. The method is based on using the homogeneity (compactness) property of the results from successive measurements of the geometric characteristics of the track. Calculations are performed using the Irregularity Size Distribution Function (ISDF). For the analysis, we use exponential approximation of this function. Classification of the results and decision-making regarding the occurrence of a defect larger than the maximum size before the next measurement is made using the k-nearest neighbors’ method, which is commonly used in artificial intelligence tasks. According to the results of the experiment, for defects of the surface type, the probability of correctly predicting the spontaneous increase in the maximum defect size before the next measurement is 0.89, while the probability of a false positive is 0.11.
},
 year = {2025}
}
Copy
|
Download
-
TY  - JOUR
T1  - Predicting Spontaneous Increases in Maximum Size of Geometric Defects in Railway Tracks

AU  - Grigory Krug
Y1  - 2025/03/18
PY  - 2025
N1  - https://doi.org/10.11648/j.ajmie.20251002.11
DO  - 10.11648/j.ajmie.20251002.11
T2  - American Journal of Mechanical and Industrial Engineering
JF  - American Journal of Mechanical and Industrial Engineering
JO  - American Journal of Mechanical and Industrial Engineering
SP  - 40
EP  - 45
PB  - Science Publishing Group
SN  - 2575-6060
UR  - https://doi.org/10.11648/j.ajmie.20251002.11
AB  - This article describes a method for predicting the values of track’s geometric characteristics during the period between two consecutive measurements. As is known, track condition analysis is based on periodic measurements of geometric parameters. Changes in track condition manifest as an increase in the size of “large” defects and a decrease in “small” ones. This process is non-stationary, dependent on the physical properties of the track and axle load, and is not linked to the measurement schedule. Therefore, there may be situations where defects (irregularities) of critical or near-critical size emerge between measurements, which can lead to undesirable consequences. The issue of predicting the emergence of new defects, larger than those recorded in the most recent measurement, during the period between measurements, has not been explored. Naturally, such defects should be addressed without waiting for the next measurement cycle. It should be noted that in reliability theory, this process corresponds to the concept of an unexpected failure. Our approach addresses the problem of preventive track maintenance by providing information on defects whose sizes exceed the maximum sizes registered during the most recent measurement, prior to the next measurement cycle (1-2 months). The method also allows to identify sudden spontaneous deterioration of the track, which does not follow from a regular trend. The method is based on using the homogeneity (compactness) property of the results from successive measurements of the geometric characteristics of the track. Calculations are performed using the Irregularity Size Distribution Function (ISDF). For the analysis, we use exponential approximation of this function. Classification of the results and decision-making regarding the occurrence of a defect larger than the maximum size before the next measurement is made using the k-nearest neighbors’ method, which is commonly used in artificial intelligence tasks. According to the results of the experiment, for defects of the surface type, the probability of correctly predicting the spontaneous increase in the maximum defect size before the next measurement is 0.89, while the probability of a false positive is 0.11.

VL  - 10
IS  - 2
ER  -
Copy
|
Download