In northern Nigeria's crystalline basement terrains, where surface water resources are seasonal and poorly distributed, groundwater is the primary source of drinkable water. In order to identify groundwater potential zones in the Lere Local Government Area of Kaduna State, Nigeria, this study used an integrated Remote Sensing and Geographic Information System (GIS) approach. Landsat-8 OLI images, the ASTER Digital Elevation Model (30 m resolution), and pre-existing geological and soil maps were used to determine six groundwater-influencing parameters: geology, lineament density, slope, soil texture, drainage density, and land use/land cover (LULC). The studied area's drainage density ranges from 0 to 2.172 km/km², and its slope extends from 0° to 72.86°. Bare terrain makes up the majority of the region (84.57%), followed by settlements (8.44%), hills (6.16%), water bodies (0.82%), and vegetation (0.001%), according to LULC research. Thematic layers were given weights using a modified DRASTIC-based multi-criteria evaluation technique, including geology (5), lineament density (4), slope (4), soil texture (3), drainage density (2), and land use/land cover (1). A Groundwater Potential Index (GPI) map that divided the region into high, moderate, and low groundwater potential zones was created using weighted overlay analysis in a GIS context. Fractured granite gneiss and migmatite, high lineament density (0.656–1.365 km/km2), mild slopes (0–9.429°), permeable soils, and low drainage density (0–0.564 km/km2) are all associated with high potential zones, while steep slopes and severely dissected terrains are associated with low potential areas. The findings show that lithology and structural characteristics play a major role in the occurrence of groundwater and show that integrated remote sensing and GIS techniques offer a dependable and affordable tool for sustainable borehole siting and groundwater exploration in basement complex terrains.
| Published in | American Journal of Environmental Science and Engineering (Volume 10, Issue 2) |
| DOI | 10.11648/j.ajese.20261002.11 |
| Page(s) | 37-53 |
| Creative Commons |
This is an Open Access article, distributed under the terms of the Creative Commons Attribution 4.0 International License (http://creativecommons.org/licenses/by/4.0/), which permits unrestricted use, distribution and reproduction in any medium or format, provided the original work is properly cited. |
| Copyright |
Copyright © The Author(s), 2026. Published by Science Publishing Group |
Basement Complex, GIS, Groundwater Potential, Kaduna State, Modified DRASTIC Model, Nigeria, Remote Sensing
Data | Source | Year | Relevance |
|---|---|---|---|
Soil map | Kaduna State Ministry of Agriculture | 2010 | Soil characteristics |
Geologic map | NGSA | 2008 | Lithology/rock types |
ASTER DEM | Earth Explorer | 2015 | Slope and drainage |
Landsat 8 OLI | USGS | 2019 | Land use/cover and Lineaments |
Slope Classes | Degree | Modified DRASTIC Rating |
|---|---|---|
Flat | 0 - 3.143 | 10 |
Gentle | 3.143 - 9.429 | 8 |
Moderate | 9.429 - 20.287 | 6 |
Steep | 20.287 - 37.431 | 3 |
Very Steep | 37.431 - 72.861 | 1 |
Lineament Classes (km) | Modified DRASTIC Rating |
|---|---|
0 – 0.110 | 10 |
0.110 – 0.259 | 8 |
0.259 – 0.432 | 6 |
0.432 – 0.656 | 3 |
0.656 – 1.365 | 1 |
Land Use/Cover | Area (Hectares) | Area (%) | Modified DRASTIC Ratings |
|---|---|---|---|
Water body | 7147.8900 | 0.818 | 8 |
Settlement | 73760.4900 | 8.444 | 3 |
Vegetation | 8.7400 | 0.001 | 10 |
Bare-Land | 738756.5400 | 84.574 | 6 |
Hills | 53833.6800 | 6.163 | 1 |
Soil Type | Modified DRASTIC Rating |
|---|---|
Very deep well drained sandy loamy sand to sandy clay | 3 |
Very shallow well drained loamy sand to sandy loam | 9 |
Very deep well drained sandy loamy to sandy clay | 4 |
Very deep well drained sandy loamy to loamy sand | 9 |
Moderately deep well drained sandy loam gravelly | 7 |
Deep well drained sandy loam to sandy clay gravelly | 5 |
Geology | Modified DRASTIC Rating |
|---|---|
Amphibolite | 8 |
Biotite Granite | 2 |
Porphyritic Biotite and Biotite Hornblend | 1 |
Granite Genies | 10 |
Medium to Coarse Grained Biotite Granite | 2 |
Migmatite | 4 |
Pyroxene Fayalite Granite | 1 |
Undifferentiated Schist | 7 |
Drainage Density | Classes | Modified DRASTIC Rating |
|---|---|---|
0 - 0.564 | Very low | 10 |
0.564 - 0.819 | Low | 8 |
0.819- 1.081 | Moderate | 6 |
1.081 - 1.368 | High | 4 |
1.368- 2.172 | Very high | 1 |
RASTER | WEIGHT | ATTRIBUTES | RATINGS |
|---|---|---|---|
Biotite Granite | 2 | ||
Porphyritic Biotite and biotite hornblend | 1 | ||
Fine Grained Leucocratic Granite | 4 | ||
Granite Gneiss | 10 | ||
Medium to coarse grained biotite gneiss | 2 | ||
Migmatite | 4 | ||
Pyroxene Fayalite Granite | 1 | ||
Undifferentiated Schist | 7 | ||
Lineament | 4 | 0 - 0.110 | 1 |
0.110 - 0.259 | 3 | ||
0.259 - 0.432 | 5 | ||
0.432 - 0.656 | 7 | ||
0.656 - 1.365 | 10 | ||
Slope | 4 | 0 - 3.143 | 10 |
3.143 - 9.429 | 8 | ||
9.429 - 20.287 | 6 | ||
20.287 - 37.431 | 3 | ||
37.431 - 72.861 | 1 | ||
Soil Texture | 3 | Very deep well drained sandy loamy sand to sandy clay | 3 |
Very shallow well drained loamy sand to sandy loam | 9 | ||
Very deep well drained sandy loamy to sandy clay | 4 | ||
Very deep well drained sandy loamy to loamy sand | 9 | ||
Moderately deep well drained sandy loam gravelly | 7 | ||
Deep well drained sandy loam to sandy clay gravelly | 5 | ||
Drainage Density | 2 | Very Low Drainage (0-0.010-0.564) | 10 |
Low Drainage (0.564-0.819) | 8 | ||
Moderate (0.819-1.081) | 6 | ||
High Drainage (1.081-1.368) | 4 | ||
Very High Drainage (1.368-2.172) | 1 | ||
Land use/cover | 1 | Vegetation | 10 |
Hills | 1 | ||
Water Body | 8 | ||
Bare surface | 6 | ||
Settlement | 3 |
ASTER | Advanced Spaceborne Thermal Emission and Reflection Radiometer |
DEM | Digital Elevation Model |
DRASTIC | Depth, Recharge, Aquifer Media, Soil Media, Topography, Impact of Vadose Zone, Hydraulic Conductivity |
FAO | Food and Agriculture Organization |
G | Geology |
GIS | Geographic Information System |
GPI | Groundwater Potential Index |
GP | Groundwater Potential |
GPP | Groundwater Pollution Potential |
GPS | Global Positioning System |
LGA | Local Government Area |
LD | Lineament Density |
LULC | Land Use/Land Cover |
MCE | Multi-Criteria Evaluation |
MCDM | Multi-Criteria Decision Making |
NWRI | National Water Resources Institute |
OLI | Operational Land Imager |
RS | Remote Sensing |
S | Soil |
SL | Slope |
ST | Soil Texture |
USGS | The United States Geological Survey |
WOA | Weighted Overlay Analysis |
NIMET | Nigerian Meteorological Agency |
NGSA | Nigerian Geological Survey Agency |
r | Rating |
w | Weight |
km/km² | Kilometers per Square Kilometer |
m | Meter |
mm | Millimeter |
° | Degree |
| [1] | Todd, D. K., & Mays, L. W. (2005). Groundwater hydrology (3rd ed.). John Wiley & Sons. |
| [2] | World Bank. (2018). Nigeria – Sustainable urban and rural water supply, sanitation and hygiene program. World Bank Publications. |
| [3] | Kortas, L., & Younger, P. L. (2007). Using the GRAM model to reconstruct the important factors in historic groundwater rebound in part of the Durham Coalfield, UK. Mine Water and the Environment, 26(2), 60-69. |
| [4] | Jha, M. K., Chowdary, V. M., & Chowdhury, A. (2010). Groundwater assessment in Salboni Block, West Bengal (India) using remote sensing, geographical information system and multi-criteria decision analysis techniques. Hydrogeology journal, 18(7), 1713-1728. |
| [5] | Sener, E., Davraz, A., & Ozcelik, M. (2005). An integration of GIS and remote sensing in groundwater investigations: A case study in Burdur, Turkey. Hydrogeology Journal, 13(5), 826–834. |
| [6] | Fitts, C. R. (2013). 10—Groundwater Chemistry. Groundwater Science, 2nd ed.; Fitts, CR, Ed.; Academic Press: Boston, MA, USA, 421-497. |
| [7] | Longley, P. A., Goodchild, M. F., Maguire, D. J., & Rhind, D. W. (2015). Geographic information science and systems. John Wiley & Sons. |
| [8] | Aller, L., Bennett, T., Lehr, J. H., Petty, R. J., & Hackett, G. (1987). DRASTIC: A standardized system for evaluating groundwater pollution potential using hydrogeologic settings (EPA/600/2-87/035). U.S. Environmental Protection Agency, Washington, DC, 455. |
| [9] | Aregheore, E. M. (2009). Country pasture/forage resource profiles: Nigeria. Food and Agriculture Organization of the United Nations (FAO), Italy. |
| [10] | Oyenuga, V. A. (1967). Agriculture in Nigeria. An introduction. |
| [11] | Udo, R. K. (2023). Geographical regions of Nigeria. Univ of California Press. |
| [12] | Ojo, O. (1977). The climates of West Africa. Heinemann, (p. 219 pp). |
| [13] | Nigerian Meteorological Agency (NIMET). (2020). Annual climate review bulletin. Federal Ministry of Aviation, Abuja, Nigeria. |
| [14] | Food and Agriculture Organization (FAO). (2015). AQUASTAT country profile – Nigeria. FAO Water Reports. Rome, Italy. |
| [15] | Rahaman, M. A. (1988). Recent advances in the study of the basement complex of Nigeria. Pre Cambrian geology of Nigeria, 11-41. |
| [16] | Obaje, N. G. (2009). Geology and mineral resources of Nigeria (Vol. 120, p. 221). Berlin: Springer. |
| [17] | Wright, J. B., & McCurry, P. (1970). The geology of Nigeria. In C. A. Kogbe (Ed.), Geology of Nigeria (pp. 1–26). Elizabethan Publishing Company. |
| [18] | Olorunfemi, M. O., & Okhue, E. T. (1992). Hydrogeologic and geologic significance of a geoelectric survey at Ile-Ife, Nigeria. Journal of mining and geology, 28(2), 221-229. |
| [19] | Malczewski, J. (1999). GIS and multicriteria decision analysis. John Wiley & Sons. |
| [20] | Eastman, J. R. (2012). IDRISI Selva manual. Clark labs-Clark University. Worcester, Mass. USA. |
| [21] | Jenks, G. F. (1967). The data model concept in statistical mapping. International Yearbook of Cartography, 7, 186–190. |
| [22] | Slocum, T. A., McMaster, R. B., Kessler, F. C., & Howard, H. H. (2022). Thematic cartography and geovisualization. CRC Press. |
| [23] | Gupta, M., & Srivastava, P. K. (2010). Integrating GIS and remote sensing for groundwater potential assessment in hard rock terrain. Water Resources Management, 24(13), 3959–3976. |
| [24] | Nag, S. K., & Anindita, D. (2011). Applications of remote sensing and GIS in groundwater potential mapping in hard rock terrain. International Journal of Environmental Sciences, 1(5), 1085–1096. |
| [25] | Hillel, D. (2004). Introduction to environmental soil physics. Elsevier Academic Press. |
| [26] | Brady, N. C., & Weil, R. R. (2016). The nature and properties of soils. Columbus. EUA Pearson Education. |
| [27] | Singhal, B. B. S., & Gupta, R. P. (2010). Applied hydrogeology of fractured rocks. Springer Science & Business Media. |
| [28] | Freeze, R. A., & Cherry, J. A. (1979). Groundwater prentice-hall. Englewood Cliffs, NJ, 176, 161-177. |
| [29] | Wisler, C. O., & Brater, E. F. (1959). Hydrology. John Willey and Sons. Inc. NY 408 p. |
| [30] | Machiwal, D., Jha, M. K., & Mal, B. C. (2011). Assessment of groundwater potential in a semi-arid region of India using remote sensing, GIS and MCDM techniques. Water resources management, 25, 1359-1386. |
APA Style
Zingchang, A. H., Ingoroko, T. S., Michaels, S. P., Akintayo, T., Wulet, A. A., et al. (2026). Delineation of Groundwater Potential Zones Using a Modified DRASTIC–GIS Approach in a Crystalline Basement Terrain, Northwestern Nigeria. American Journal of Environmental Science and Engineering, 10(2), 37-53. https://doi.org/10.11648/j.ajese.20261002.11
ACS Style
Zingchang, A. H.; Ingoroko, T. S.; Michaels, S. P.; Akintayo, T.; Wulet, A. A., et al. Delineation of Groundwater Potential Zones Using a Modified DRASTIC–GIS Approach in a Crystalline Basement Terrain, Northwestern Nigeria. Am. J. Environ. Sci. Eng. 2026, 10(2), 37-53. doi: 10.11648/j.ajese.20261002.11
AMA Style
Zingchang AH, Ingoroko TS, Michaels SP, Akintayo T, Wulet AA, et al. Delineation of Groundwater Potential Zones Using a Modified DRASTIC–GIS Approach in a Crystalline Basement Terrain, Northwestern Nigeria. Am J Environ Sci Eng. 2026;10(2):37-53. doi: 10.11648/j.ajese.20261002.11
@article{10.11648/j.ajese.20261002.11,
  author = {Alfred Habila Zingchang and Tavershima Stephen Ingoroko and Segun Peter Michaels and Toyin Akintayo and Ashe Abubakar Wulet and Abdul-Qadir Dauda Aliyu and Kassim Abdullahi Baba},
  title = {Delineation of Groundwater Potential Zones Using a Modified DRASTIC–GIS Approach in a Crystalline Basement Terrain, Northwestern Nigeria},
  journal = {American Journal of Environmental Science and Engineering},
  volume = {10},
  number = {2},
  pages = {37-53},
  doi = {10.11648/j.ajese.20261002.11},
  url = {https://doi.org/10.11648/j.ajese.20261002.11},
  eprint = {https://article.sciencepublishinggroup.com/pdf/10.11648.j.ajese.20261002.11},
  abstract = {In northern Nigeria's crystalline basement terrains, where surface water resources are seasonal and poorly distributed, groundwater is the primary source of drinkable water. In order to identify groundwater potential zones in the Lere Local Government Area of Kaduna State, Nigeria, this study used an integrated Remote Sensing and Geographic Information System (GIS) approach. Landsat-8 OLI images, the ASTER Digital Elevation Model (30 m resolution), and pre-existing geological and soil maps were used to determine six groundwater-influencing parameters: geology, lineament density, slope, soil texture, drainage density, and land use/land cover (LULC). The studied area's drainage density ranges from 0 to 2.172 km/km², and its slope extends from 0° to 72.86°. Bare terrain makes up the majority of the region (84.57%), followed by settlements (8.44%), hills (6.16%), water bodies (0.82%), and vegetation (0.001%), according to LULC research. Thematic layers were given weights using a modified DRASTIC-based multi-criteria evaluation technique, including geology (5), lineament density (4), slope (4), soil texture (3), drainage density (2), and land use/land cover (1). A Groundwater Potential Index (GPI) map that divided the region into high, moderate, and low groundwater potential zones was created using weighted overlay analysis in a GIS context. Fractured granite gneiss and migmatite, high lineament density (0.656–1.365 km/km2), mild slopes (0–9.429°), permeable soils, and low drainage density (0–0.564 km/km2) are all associated with high potential zones, while steep slopes and severely dissected terrains are associated with low potential areas. The findings show that lithology and structural characteristics play a major role in the occurrence of groundwater and show that integrated remote sensing and GIS techniques offer a dependable and affordable tool for sustainable borehole siting and groundwater exploration in basement complex terrains.},
 year = {2026}
}
TY  - JOUR
T1  - Delineation of Groundwater Potential Zones Using a Modified DRASTIC–GIS Approach in a Crystalline Basement Terrain, Northwestern Nigeria
AU  - Alfred Habila Zingchang
AU  - Tavershima Stephen Ingoroko
AU  - Segun Peter Michaels
AU  - Toyin Akintayo
AU  - Ashe Abubakar Wulet
AU  - Abdul-Qadir Dauda Aliyu
AU  - Kassim Abdullahi Baba
Y1  - 2026/05/14
PY  - 2026
N1  - https://doi.org/10.11648/j.ajese.20261002.11
DO  - 10.11648/j.ajese.20261002.11
T2  - American Journal of Environmental Science and Engineering
JF  - American Journal of Environmental Science and Engineering
JO  - American Journal of Environmental Science and Engineering
SP  - 37
EP  - 53
PB  - Science Publishing Group
SN  - 2578-7993
UR  - https://doi.org/10.11648/j.ajese.20261002.11
AB  - In northern Nigeria's crystalline basement terrains, where surface water resources are seasonal and poorly distributed, groundwater is the primary source of drinkable water. In order to identify groundwater potential zones in the Lere Local Government Area of Kaduna State, Nigeria, this study used an integrated Remote Sensing and Geographic Information System (GIS) approach. Landsat-8 OLI images, the ASTER Digital Elevation Model (30 m resolution), and pre-existing geological and soil maps were used to determine six groundwater-influencing parameters: geology, lineament density, slope, soil texture, drainage density, and land use/land cover (LULC). The studied area's drainage density ranges from 0 to 2.172 km/km², and its slope extends from 0° to 72.86°. Bare terrain makes up the majority of the region (84.57%), followed by settlements (8.44%), hills (6.16%), water bodies (0.82%), and vegetation (0.001%), according to LULC research. Thematic layers were given weights using a modified DRASTIC-based multi-criteria evaluation technique, including geology (5), lineament density (4), slope (4), soil texture (3), drainage density (2), and land use/land cover (1). A Groundwater Potential Index (GPI) map that divided the region into high, moderate, and low groundwater potential zones was created using weighted overlay analysis in a GIS context. Fractured granite gneiss and migmatite, high lineament density (0.656–1.365 km/km2), mild slopes (0–9.429°), permeable soils, and low drainage density (0–0.564 km/km2) are all associated with high potential zones, while steep slopes and severely dissected terrains are associated with low potential areas. The findings show that lithology and structural characteristics play a major role in the occurrence of groundwater and show that integrated remote sensing and GIS techniques offer a dependable and affordable tool for sustainable borehole siting and groundwater exploration in basement complex terrains.
VL  - 10
IS  - 2
ER  -
Faculty of Applied and Natural Science, National Water Resources Institute, Kaduna, Nigeria
Biography: Alfred Habila Zingchang is a hydrogeologist with more than 20 years of experience working in government, education, research, and construction. His work focuses on researching groundwater, giving lectures, and studying climate change. He graduated from the University of Jos with a degree in geology and mining, and Kwame Nkrumah University of Science and Technology awarded him an MSc in water supply and environmental sanitation. At the University of Jos, he is presently working on a PhD in environmental geology. He conducted geotechnical assessments for hydropower dams, developed Nigeria's Code of Practice for Dams and Reservoir Operations, and investigated the effects of climate change on groundwater in the Chad Basin. He is married, has four kids, and likes to read, travel, study, and engage in politics.
Research Fields: Climate change, Groundwater, Geochemistry, Environmental geology, GIS and Groundwater modelling

Faculty of Engineering, National Water Resources Institute, Kaduna, Nigeria
Biography: Tavershima Stephen Ingoroko is a Nigerian Civil and Water Resources & Environmental Engineer and Lecturer at the National Water Resources Institute, Kaduna. He is currently pursuing a Ph.D. in Water Resources & Environmental Engineering at Ahmadu Bello University, Zaria, where he also obtained his M.Sc. in the same field. He holds a B.Eng. in Civil Engineering from the Federal University of Agriculture, Makurdi, and a Proficiency Certificate in Management from the Nigerian Institution of Management. His work focuses on groundwater exploration, water quality assessment, hydrogeological studies, and sustainable water resources management. He has extensive experience in teaching, research, project supervision, and consultancy, with several publications in reputable journals and contributions to national conferences. He is a registered engineer with COREN and a member of NSE, NICE, NIWE, and NIM.
Research Fields: Groundwater Exploration, Water Quality Assessment, Hydrogeological studies, Climate Change and Environmental Sustainability, and Sustainable Water Resources Management

Faculty of Applied and Natural Science, National Water Resources Institute, Kaduna, Nigeria
Biography: Segun Peter Michaels is an academic and water resources specialist with a focus on environmental studies and hydrogeology. In 2022, he received a PhD in Water Resources Engineering and Management from Kwame Nkrumah University of Science and Technology, a MEIA from Kaduna State University, and a BSc and MSc in Hydrogeology from Ahmadu Bello University. Hydrogeochemistry, isotope hydrology, groundwater research, and environmental toxicity are among his areas of interest. Dr. Michaels has published widely in both domestic and foreign periodicals. He is currently the National Coordinator of the National Water Resources Capacity Building Network and a Senior Lecturer at the National Water Resources Institute. He also likes to travel and read, and he is an active member of a number of professional associations.
Research Fields: Hydrogeochemistry, Isotope Hydrology, Environmental, Groundwater Toxicity, and GIS and Remote Sensing

Faculty of Applied and Natural Science, National Water Resources Institute, Kaduna, Nigeria
Biography: Toyin Akintayo is a Hydrogeologist and GIS Analyst with over 10 years of experience in Remote Sensing and GIS applications for water resources management and environmental sustainability. She currently works as a Hydrogeologist and GIS/Remote Sensing Expert at the National Water Resources Institute (NWRI), Kaduna, Nigeria. She holds an M.Tech in GIS and Remote Sensing from the Regional Centre for Training in Aerospace Surveys (RECTAS) in affiliation with the Federal University of Technology, Akure, a B.Tech in Applied Geology from the Federal University of Technology, Akure, and an ND in Mineral Resources Engineering from Kaduna Polytechnic. Her current work focuses on hydrological modelling, groundwater assessment, climate change adaptation, and GIS-based decision support systems, contributing to projects such as the PIDACC/NB programme and other National Water Resource Management initiatives.
Research Fields: Flood Risk Vulberability Assessment, Climate Change Vulnerability Assessment, Water Resources Management, Geospatial Analysis and Remote Sensing, Urban Environmental Management

Faculty of Applied and Natural Science, National Water Resources Institute, Kaduna, Nigeria
Biography: Ashe Abubakar Wulet is a hydrogeologist at the National Water Resources Institute (NWRI), Kaduna, Nigeria. She is currently pursuing a Ph.D. in Water Resources and Engineering Management at Kwame Nkrumah University of Science and Technology (KNUST), Ghana. She holds a Master’s degree from Kaduna State University and a Bachelor’s degree from the University of Maiduguri. Her professional work focuses on hydrogeological studies, groundwater exploration, and sustainable water resources management. Ashe is actively involved in research addressing climate variability and its impact on water systems. She is a registered member of the Nigeria Mining and Geoscience Society (NMGS) and the National Association of Hydrogeologists (NAH), reflecting her commitment to professional excellence and development in the field of hydrogeology.
Research Fields: Climate resilience in water systems, Groundwater exploration, and development, Drought assessment and climate variability, Geospatial analysis for water resources management

Faculty of Engineering, National Water Resources Institute, Kaduna, Nigeria
Biography: Abdul-Qadir Dauda Aliyu is a Senior Lecturer and Research Engineer at the National Water Resources Institute. He is in charge of the Hydraulics Division and the Department of Agricultural and Bioenvironmental Engineering Technology. Additionally, he makes contributions to the Regional Center for Integrated River Basin Management of UNESCO. He has an MSc in Civil Engineering from RUDN University, a BEng in Irrigation Engineering from Bayero University, and a PhD at Ahmadu Bello University. Water resources engineering, irrigation, hydrology, flood risk assessment, groundwater investigations, and water quality management are some of his areas of interest. He has written more than 40 publications and worked on projects related to drinking water quality evaluation, irrigation development, flood mapping, sedimentation analysis, and dam viability.
Research Fields: Water Resources Engineering, Irrigation Systems, Hydrology and Flood Risk Assessment, Groundwater studies, and Water Quality Management

Faculty of Engineering, National Water Resources Institute, Kaduna, Nigeria
Biography: Kassim Abdullahi Baba is a PhD candidate in Agricultural and Bio-Environmental Engineering at the Federal University of Technology, Minna. He holds an ND in Agricultural Engineering and HND in Soil and Water Engineering from Federal Polytechnic, Bauchi, and a PGD and Master’s from FUT Minna. His research focuses on smart agriculture, controlled environment agriculture, hydroponics, and soil-water management. He has designed and constructed hydroponics and greenhouse systems, trained over 500 beneficiaries in smart agriculture across Nigeria, and contributed to green projects with expertise in irrigation and drainage. He is a member of COREN, NATE, and the Nigerian Institution of Agricultural Engineers (NIAE).
Research Fields: Smart Agriculture & Precision Farming, Controlled Environment Agriculture (CEA), Soil-Water-Plant Relations, Agricultural Biotechnology, and Green Technology & Climate-Smart Systems

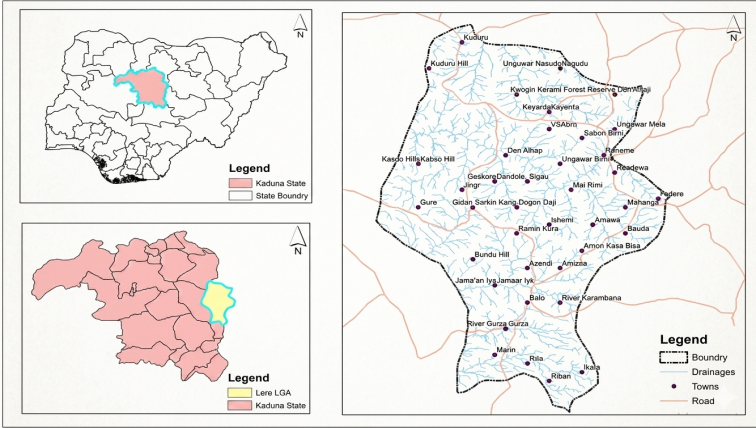
Figure 1. Location map of the Study Area.
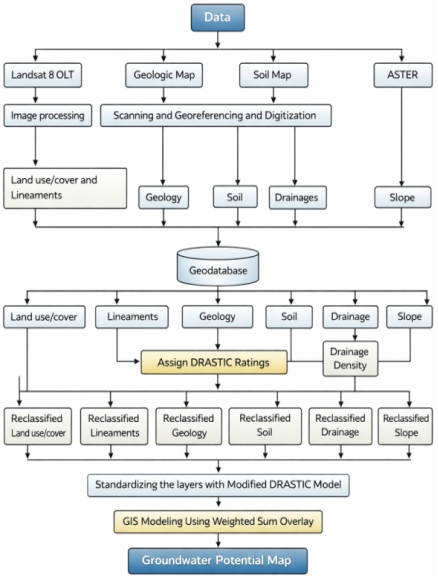
Figure 2. Modified DRASTIC model flowchart.
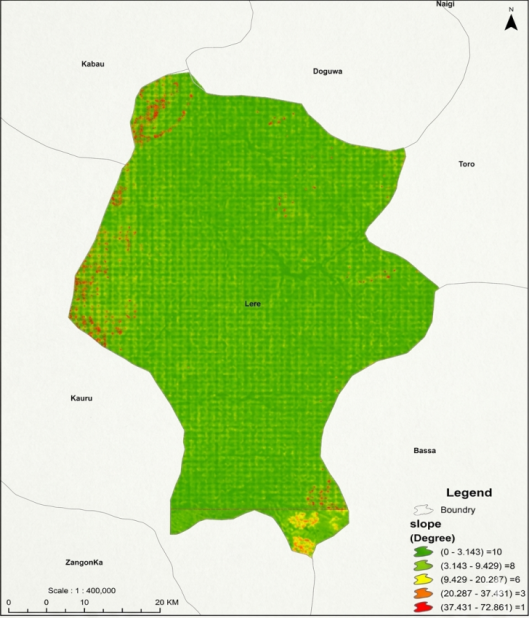
Figure 3. Slope map of Lere LGA, Kaduna.
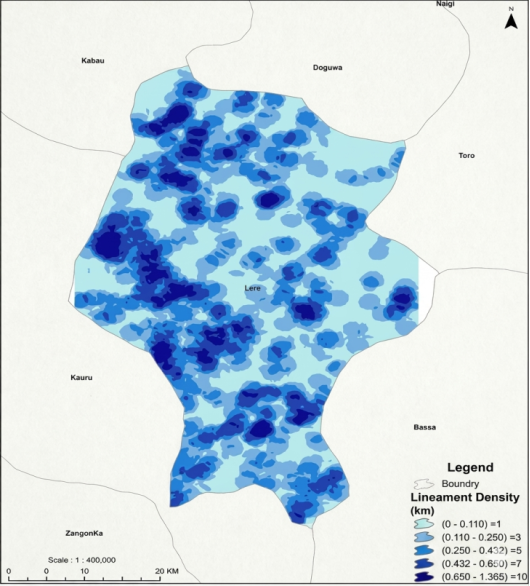
Figure 4. Lineament map of Lere LGA, Kaduna.
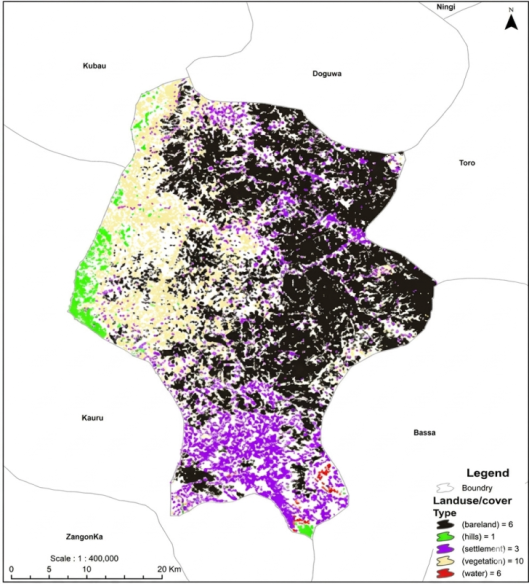
Figure 5. Land use/cover Map of Lere LGA, Kaduna.
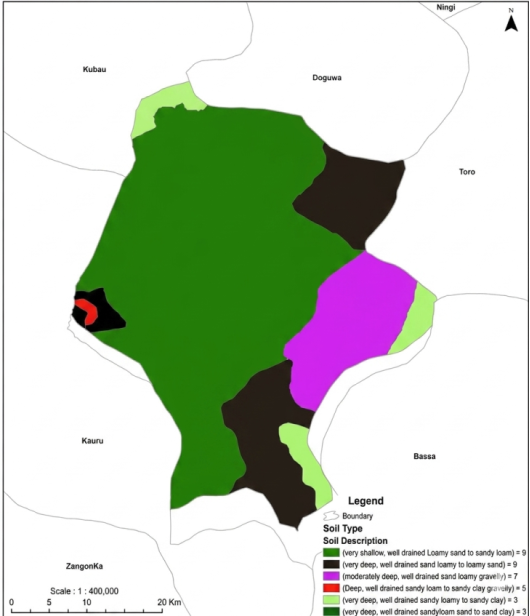
Figure 6. Soil Map of Lere LGA, Kaduna.
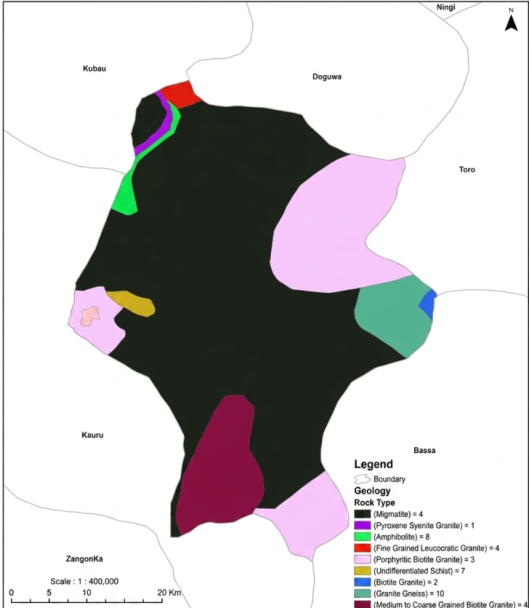
Figure 7. Geological Map of Lere LGA, Kaduna.
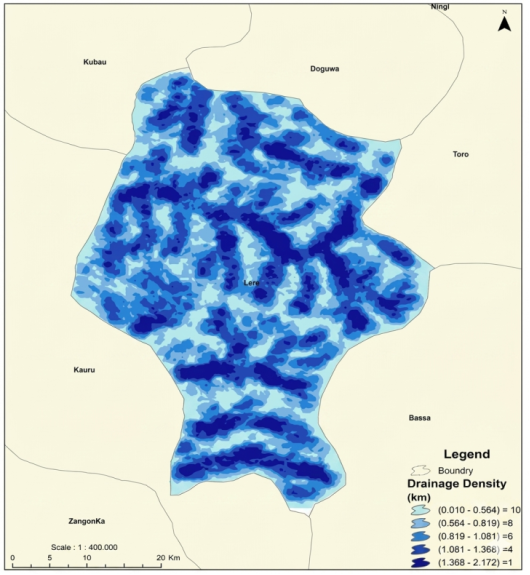
Figure 8. Drainage Density Map of Lere LGA, Kaduna.
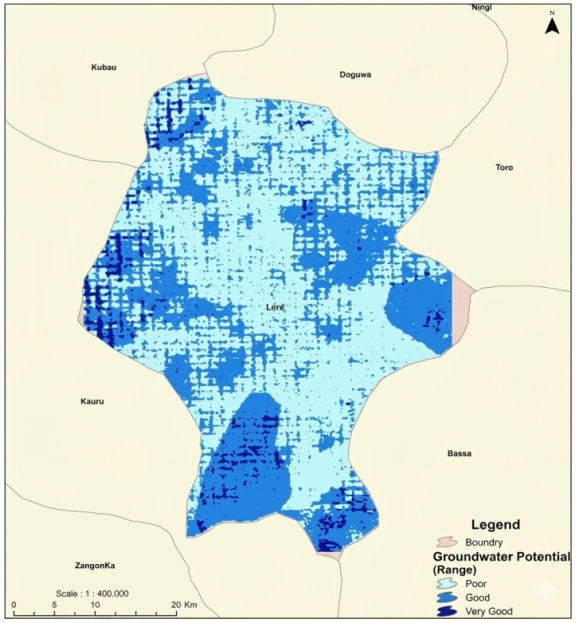
Figure 9. Groundwater potential map of Lere LGA, Kaduna.
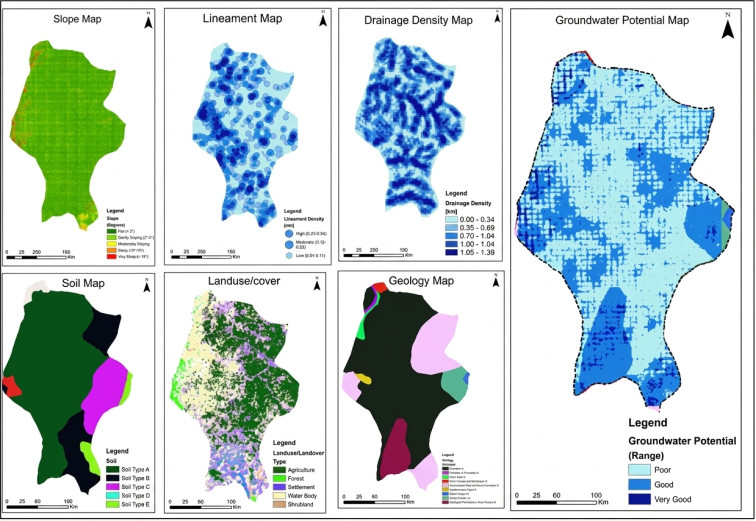
Figure 10. Groundwater potential map showing all hydrogeological parameters used.
Information

