Research Article | | Peer-Reviewed

Identifying the Value Chain of Different Types of Recyclable Waste Plastics: Case Study on Selected SMEs of Dhaka City

Received: 6 June 2025     Accepted: 18 June 2025     Published: 6 July 2025
Views:       Downloads:
Abstract

This study investigates the role of small and medium enterprises (SMEs) in the plastic waste recycling value chain in Dhaka, Bangladesh. The research focuses on identifying the value chain of different types of recyclable waste plastics and assessing the pattern of post-consumer plastic waste disposal, recycling practices, and the prospects and challenges faced by SMEs. Dhaka City Corporation, comprising Dhaka North City Corporation (DNCC) and Dhaka South City Corporation (DSCC), generates an estimated 6,400 tons of waste daily, of which approximately 640 tons are plastic waste. Among this, around 37% is recycled, with SMEs playing a central role in collection, sorting, and processing activities. Data were collected through surveys and field visits to 617 recycling units across the city. The study analyzed the economic dynamics of different plastic types, revealing that polyethylene terephthalate (PET) and high-density polyethylene (HDPE) offer the highest procurement and resale values. PET is procured at Tk. 35.71 per kg and resold at Tk. 48.00 per kg, while HDPE provides the highest net margin of Tk. 9.08 per kg. Value addition across various plastic types ranges from 15% to 55%. The plastic waste stream primarily consists of low-density polyethylene (LDPE) from single-use plastic bags (about 40%) and multi-layered plastics (MLP) (around 7%). The findings indicate that the sector is largely informal and fragmented, with most recycling units operating from small rented spaces without formal documentation, licenses, or access to institutional finance. Occupational safety measures, environmental compliance, and technological integration are minimal, with most facilities lacking personal protective equipment and effluent treatment systems. The spatial distribution of units is unplanned, and a significant portion of factories report financial instability. Despite these challenges, SMEs contribute significantly to resource recovery, employment, and environmental management in Dhaka. The study highlights the structure of the plastic recycling value chain and the operational realities of SMEs in this sector.

Published in American Journal of Environmental Science and Engineering (Volume 9, Issue 3)
DOI 10.11648/j.ajese.20250903.13
Page(s) 115-124
Creative Commons

This is an Open Access article, distributed under the terms of the Creative Commons Attribution 4.0 International License (http://creativecommons.org/licenses/by/4.0/), which permits unrestricted use, distribution and reproduction in any medium or format, provided the original work is properly cited.

Copyright

Copyright © The Author(s), 2025. Published by Science Publishing Group

Keywords

Plastic Waste, Recycling, Value Chain, SME, Environmental Sustainability, Bangladesh

1. Introduction
Bangladesh, located in the delta of the Padma and Jamuna rivers, is one of the most densely populated countries in the world, with approximately 169 million people living within a land area of 148,460 square kilometers. The country experiences a humid, monsoon-driven climate. In recent years, water pollution has emerged as a major environmental challenge, particularly in developing nations like Bangladesh . Rapid industrialization and urbanization fueled by economic growth and rising living standards have significantly increased consumption, especially of plastics. Dhaka, the capital and economic hub, faces severe environmental stress due to inadequate waste management systems, including the handling of plastic waste. Globally, around 2 billion tons of waste are generated annually, with 23% originating from East Asia and the Pacific. For example, Singapore alone produced 6.9 million tons of waste in 2021, of which only 13% was recycled, according to its National Environmental Agency. This reflects a broader global waste crisis, with municipal solid waste (MSW) posing escalating threats to both the environment and public health due to intensified industrialization and urban expansion.
Therefore, a wider area has remained unattended in managing domestic, non-domestic, and industrial wastes. It has been found that more than 35 percent of globally produced wastes have a final destination to landfill in different forms whereas there are other disposals such as composting, incineration, open dumping, and recycling. However, different types of disposals have different environmental impacts including loss of land, increased methane emission to the atmosphere, surface and underground water pollution, and soil contamination. The water pollution of both surface and underground may take place due to the draining of leachate from landfilling of anaerobic decomposition. These ultimately affect the surrounding environment, the health of people, and drinking water sources . The second-most polluted city in the world is Dhaka, Bangladesh . Among the main causes of this issue are fast urbanization, inadequate infrastructure, vehicle pollution, and traffic congestion . Dhaka, the capital of Bangladesh, is administratively managed under two zones Dhaka North City Corporation (DNCC) and Dhaka South City Corporation (DSCC). As of 2020, the combined population of these two zones was approximately 10 million, with a per capita waste generation of about 0.60 kg per day . This resulted in an estimated 6,400 tons of daily waste, of which roughly 10% consisted of plastic materials. Notably, the use of plastic packaging has increased nearly fivefold between 2005 and 2020. Within Dhaka’s plastic waste stream, low-density polyethylene (LDPE) primarily from single-use plastic bags accounts for around 40%, while multi-layered plastics (MLP) contribute approximately 7%. In A survey conducted in January 2024 and January 2025 identified approximately 617 plastic waste recycling shops in the study area, categorized by size based on daily handling volume, with soft and hard plastic comprising 41.29% and 58.71% respectively in 2024, and 39.90% and 60.10% respectively in 2025 . Of the estimated 640 tons of plastic waste generated daily constituting 10% of the city's total waste around 48% is dumped in landfills, 12% is released into surrounding water bodies like rivers, ponds, and canals, and 3% causes blockages in drainage systems. Only 37% of this plastic waste undergoes recycling .
The RMG sector is the heart of Bangladesh's economy, having 9.25 percent contribution to the GDP . The role of Small and medium enterprises (SMEs) is well recognized in the global arena for their significant contribution to the economies and to employment generation. SMEs are playing the role of key catalysts in developed as well as developing nations in ensuring sustainable economic growth. Globally SMEs cover approximately 90% of all business activities and also accommodate more than 50% of global employment. As per the data of Bangladesh Bureau of Statistics (BBS), the contribution of SMEs in the GDP of Bangladesh was 21.36% in FY17, it became 21.98% in FY18 and 22.86% in FY19. The sector was largely affected during COVID19 pandemic and thus contribution in FY20 was 22.40% . Small and medium enterprises (SMEs) play a pivotal in waste plastic recycling in Bangladesh, more specifically in Dhaka City Corporation area through getting involved in all or some of the phases of waste plastic recycling such as collecting, sorting, and processing etc. But the potential role of SMEs in this area is yet to be properly explored due to having inadequate data and proper value chain analysis which would help identify the scopes and cater support mechanisms for the SMEs towards their enhanced role in waste plastic recycling. Key objectives of the study were to assess the pattern of post-consumer level plastic waste disposal system, to assess the status of plastic waste recycling practice in Dhaka city, to identify the value chain of plastic wastes and its recycled products, and to assess the prospects and challenges of SMEs in the plastic recycling industry.
2. Methodology
2.1. Study Area
The Study Area of the study were waste plastic recycling factories located at Lalbagh, Islambag, Kamrangir Char, Bagan Bari and Bash Patti area under Dhaka City Corporation.
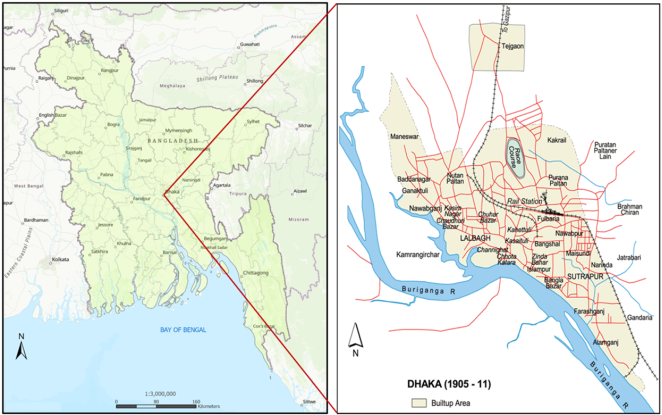
Figure 1. Study area (Dhaka City Area).
2.2. Survey Questions
Case study on selected SMEs of Dhaka city’ the following information has been collected through a structured questionnaire survey.
Factory details
Personal information
Technical information
Table 1. Questionnaire items used in field data collection.

Types of plastic recycled

Pollution level

Steps of recycling (Naming & Drawing)

Wastewater management?

Production hour/person

Selling price

Source of water

Current location

Production capacity (per day)

Source of Gas

Source of power

Source of electricity

Average monthly Electricity Bill (BDT)

2.3. Recycling Process Identification
Table 2. Waste recycling cycle.

1: Random waste disposal

2: Waste collection

3: Waste Plastics

4: Manual identification

5: Manual sorting

6: Manual separation

7: Shredding

8: Manual washing

9: Open drying

10: Melting

11: Melted plastic

12: Ready for selling

3. Results
3.1. Waste Plastic Recycling Process Outline and Value Chain Analysis
The value chain defines all the activities of a business enterprise related to products and services towards its ultimate goal of profit generation. It enables business entities to maximize profit through optimum utilization of resources at least possible cost. Value chain can be analyzed by assessing the cross-cutting issues of business processes, such as inbound logistics, operational activities, outbound logistics, marketing, sales, and service.
The value chain of recyclable waste plastics (Table 3) covers a wide range of area of different activities starting from collection of waste and ends towards manufacturing plastic goods for the end users. Within the scopes of the present study, it has been tried to focus on the value chain of recyclable waste plastics through studying the SMEs located under Dhaka City Corporation area. The value chain involved a number of actors and their activities at different phases a brief of which is given here:
Collection of waste plastics: In Dhaka City Corporation, waste plastic collection is done in a very informal and unstructured manner at a local scale. Usually waste plastics are manually collected along with the other household wastes without any sorting. A portion of this waste plastic is also collected through cash refund or in exchange of household utensils.
Identification of plastic-type: In the next process, collected waste plastics are then identified based on their color and material type in a manual process. Usually, women and child laborers were found involved in the sorting process, having almost no knowledge about the type of plastic, execute the process only based on the color and the type of the original goods. During the field survey sorters were found giving local names of the plastic types as Laal (Red), Shobuj (Green), Kaalo (Black), Golaapi (Pink), Color (having different colors), Khelna (Toys), RFL (Plastic products of specific producer, RFL) etc.
Separation of different types: From the identified waste plastics different types of plastics are separated and placed separately. This is also a manual process where waste plastics are usually separated and kept side by side on the floor.
Table 3. Value Chain process flow.

No Value Phase

Value Generation Phase

Sources of Plastic Waste

1) 🏠 Household Waste

2) 🏭 Industrial Waste

3) 🏢 Commercial Waste

Plastic Waste Accumulation

All sources combine to create Total Plastic Waste

Initial Waste Handling

1) □ Littering

2) □ Dumped at Dumping Places

3) 🚚 Door-to-Door Waste Collection → Managed by: City Corporation / Commercial Collection / Social Services

Collection & Sorting

♻ Collected & Sorted by Waste Pickers / Tokais / Scavengers

🏭 Transferred to Secondary Transfer Station (STS)

Intermediate Trading

□ Handled by Intermediate Salvage Traders

Waste Plastic Recycling Process

1) □ Sorting

2) 💧 Washing & Drying

3) ✂ Cutting & Flake Producing

4) 🔥 Melting

5) 📦 Packing

Recycled Product Output

1) □ Recycled Plastic Traders

2) □ Flake Exporters

3) □ Plastic Goods Manufacturers

Sorting: After separating different types of waste plastics, they are also sorted through the manual process. In the sorting process, the usable parts of the plastic identified, totally unusable for recycling are excluded and mixed items are sorted out.
Categorization: The sorted plastics are then categorized for their onward selling process. Different plastics are processed separately and prepared categorically for subsequent processes such as washing, drying and shredding.
Washing: The next process of waste plastic recycling is washing to clean. At this stage it happens in two ways, i.e., automatically and manually. In an automatic process, the waste plastics are passed through a machine where water flows and washes out the dirt from the waste plastics. Castic Soda, soap, and detergent powders were found to be used for washing. Automatic washing was found very rare in the surveyed area where most of the recycling units used manual process. In manual process waste plastics are placed in a large chamber where water flows through and workers gets involved in washing manually using their hands and legs.
Drying: Drying is also done in both automatically and manually. In case of automatic drying, the washed waste plastics are channeled through a heat generated chambers at a certain temperature to be dried up called hydro drier. However, no automatic drying machine was found in the study area. All of the studied recycling units were found using manual drying process where washed waste plastics are kept in a open area to enable them to be dried up in open aeration.
Shredding: After drying waste plastics are then taken for shedding machine to prepare flakes. This is a semi automatic process where workers input the waste plastics in shredder, operate the machine and then collect the output. A portion of flakes, i.e., the shredded waste plastics is ready for selling and another portion is taken for onward process of melting.
Melting: At this stage the shredded flakes are taken through the melting machine and at a certain temperature and becomes ready for further use. Manufacturing units prepare usable goods from this melted recycled plastics.
Packing: Next is the packing process to make the products ready for selling. The dried and shredded flakes are then packed in large size of sacks according to their color and weigh.
Selling: This is the final stage of waste plastic recycling where the recyclers becomes ready for selling the recycled plastics for subsequent utilization of those i.e, manufacturing of fresh goods from the recycled plastics or exporting the flakes to abroad
3.2. Value Chain Actors and Contributors
In the value chain of waste plastic recycling industry a number of cross-cutting issues are involved such as collection of waste plastic, processing those for giving reusable shape and final utilization of the remanufactured products. During the field survey, the following type of actors were found who take part in and have contributed to the waste plastic recycling value chain:
Table 4. Waste recycling stakeholders.

Collection & Sorting

Informal waste collectors

NGO led waste collectors

Private waste collection service

City Corporation waste collection system

Recycling & Processing

Manual and mechanical recycling factories

Sorting, Cutting, Washing, Drying, Melting units

Manufacturing

Producing raw materials from waste plastic

Producing new plastic products from recycled waste

Supply chain & retail trade

Retail and wholesale traders of plastic goods

Transportation service providers

Logistics service providers

Civil Society

Think tank, Social service organizations, NGO, institutions who promote environmental conservation

3.3. Value Chain of Waste Plastic
Table 5. Value Chain comparison of sub-types of Waste Plastics (In Tk. /per Kg).

Waste Plastic Type

PET

HDPE

Transparent

Color

Food Pack

Green

Cap

Cap Ring

Color Bag

Yellow Bag

Mean Buying Price

36.9±0.9

31.8±1.1

38.4±1.0

37.2±1.9

37.0±1.2

31.9±2.1

31.8+1.2

31.4±0.8

Mean Selling Price

53.2±1.2

44.2+1.9

46.5±0.9

50.29±2.2

45.4±1.3

47.4±1.7

46.1±.08

48.82±2.3

Mean Net Margin

11.7±1.3

7.8±0.9

3.5±2.1

8.40±2.2

3.8±1.7

10.8±2.4

9.7±1.5

12.77±1.2

Table 5. Continued.

Waste Plastic Type

LDPE

Elastomers

PVC

PS

PP

LDPE

Bus/ Truck Tyre

Car tyre

PVC

SUP

Color

Transparent

Mean Buying Price

32.7±1.3

28.4±1.1

26.8±2.2

27.5±1.6

23.0±0.7

33.1±1.7

36.4±2.4

Mean Selling Price

37.7±1.5

33.6±1.2

32.1±2.1

39.8±1.4

31.4+1.1

42.2±1.0

45.2±2.2

Mean Net Margin

0.36±2.3

0.5±1.0

0.6+0.9

7.7±1.3

3.7+2.2

4.4+0.8

4.1+2.2

From the surveyed data as displayed in the above table, this is evident that while buying the waste plastics the recycling factories expense most for PET (Hard Plastic for food packaging) at the rate of Tk. 38.25 per KG, followed by HDPE (Green Mix) for Tk. 37.25 per KG, HDPE (Cap) Tk. 37.00 per KG, PET (Transparent) for Tk. 36.47 per KG and PP (Colored food pack) for Tk. 33.13 per KG. The PS (One time Food Pack) has the lowest range of price for Tk. 23.05 per KG. However, while selling the recycled waste plastics the recyclers get highest price for PET (Transparent) for Tk. 53.25 per KG followed by HDPE (Green Mix) for Tk. 50.29 per KG, HDPE (Yellow plastic bank) for Tk. 48.82 per KG, HDPE (Cap ring) for Tk. 47.38 per KG, PET (Hard plastic food pack) for Tk. 46.47 per KG. The lowest selling price is still the PD (One time food pack) for Tk. 31.42 per KG.
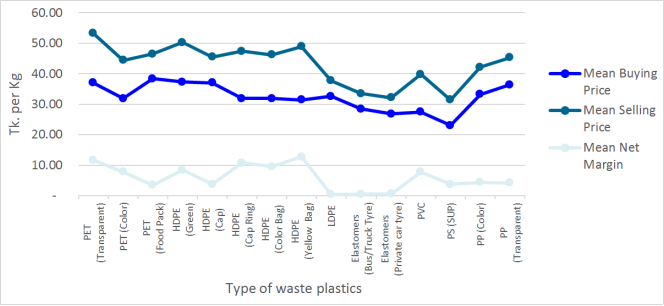
Figure 2. Value Chain comparison of Waste Plastic Recycling (In Tk. /per Kg).
The value chain comparison of waste plastic is described in the figure presented above. It displays the distribution of mean buying, selling and net margin. The gap between selling price and its corresponding net margin describes the higher operational expenses of the SMEs in connection to the waste plastic recycling.
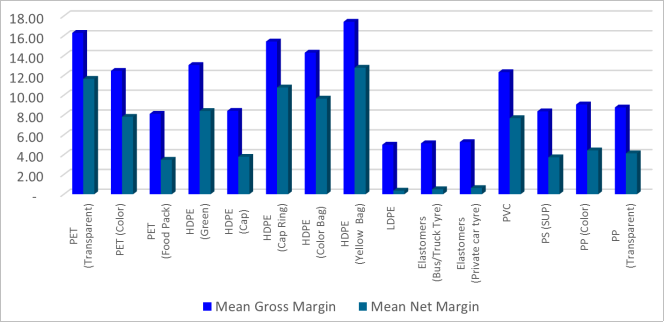
Figure 3. Gross and Net Margin in Value Chain of Waste Plastic (In Tk. /per Kg).
The above mentioned figure shows the distribution of mean gross margin and mean net margin of the waste plastics in the value chain. The gap between the gross and net margins are basically the operational expenses. It is evident from the figure that though the SMEs are generating higher gross margin, still the net margin is comparatively very low which is due to the highers operational expenses.
3.4. Waste Plastic Recycling
Table 6. Distribution of factories by recycling plastic type (Multiple response).

Recycling plastic Type

No. of factories (Multiple response)

PP (Polypropylene)

37

PET (Polyethylene Terephthalate)

30

PVC (Poly vinyl chloride)

24

HDPE (High Density Poly-Ethylene)

22

LDPE (Low Density Poly-Ethylene)

14

PS (Polystyrene)

13

Out of the surveyed 40 nos. of factories, as a multiple response 23 were found involved in recycling PP (Polypropylene) followed by PET (Polyethylene Terephthalate) 19, PVC (Poly vinyl chloride) 15, HDPE (High Density Poly-Ethylene) 14 and 9 factories were found recycling LDPE (Low Density Poly-Ethylene) and PS (Polystyrene) respectively.
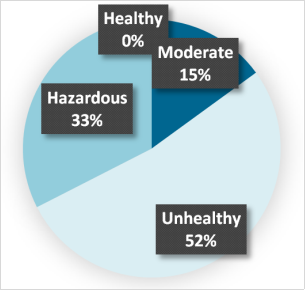
Figure 4. Distribution of factories by their occupational health condition (visual observation).
None of the surveyed had healthy Occupational Health Condition. Only 12% had moderate occupational health condition followed by 60% Unhealthy and 28% Hazardous Occupational Health Condition. No factories out of the surveyed 40 nos. of factories were found having any treatment system for their waste water. In most cases, it was found that the waste water drained to the adjacent sewage system which ultimately lead to the nearby Buriganga River.
Description of the factories
Out of the 40 factories, 34 (85%) were involved in Recycling and Processing of waste plastics and the rest 6 (15%) were involved in Manufacturing goods from waste plastic (Figure 5). Again among 40 factories 3 factories (8%) were found having duration of business more than 25 years followed by 6 (16%) for 20 years and above, 10 (24%) for 15 years and above, 8 (20%) 10 years and above and rest 13 (32%) factories had business during less than 10 years (Figure 6).
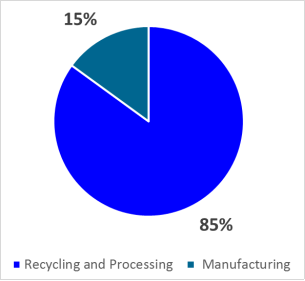
Figure 5. Distribution of factories by type.
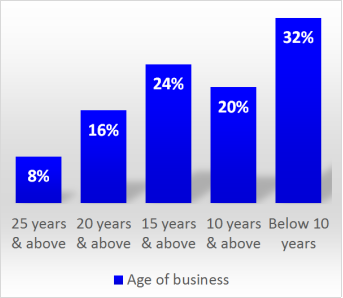
Figure 6. Distribution of factories by age of business.
Table 7. Distribution of factories by area.

Factory Area

No. of factory

Percentage

More than 500 sft

8

20%

401 - 500 sft

6

16%

300 - 400 sft

16

40%

Less than 300 sft

10

24%

Total

40

100%

Out of the study sample of 40 nos. of factories, highest 16 factories (40%) had factory area of 300 to 400 sft, followed by 6 (24%) having less than 300 sft factory area (Table 7).
Table 8. Distribution of factories by per square feet rent.

Per SFT Rent (BDT)

No. of factories

Per SFT Rent (BDT)

Tk. 70.00 & above

10

24%

Tk. 50.00 & above

16

40%

Tk. 30.00 & above

14

36%

Total

40

100%

Among the surveyed factories, the highest 40% was paying monthly rent per square feet area for Tk. 50.00 whereas another 24% was paying more than Tk. 70.00, the rest 36% was paying Tk. 30.00 per square feet (Table 8). It is evident that, the total 296 workers of the surveyed factories, 79% were male and 14% female. 8% of the total workers were child. It was found that 28% of the surveyed factories was generating profit more than 20% of gross sales whereas another 28% of the factories encountered Net Loss in business. 24% of them scored profit for 15% & above of sales and 12% scored profit for 10% & above. 8% factories has profit less than 10% of sales amount. All of the surveyed factories were found located on rented premises. While enquiring about the source of initial investment of the factories, 32% of the respondents mentioned about Own Savings, 44% about personal loan and rest 24% of family contributions. However, no response was found favoring Bank Loan.
4. Discussion
The waste plastic recycling sector in Dhaka City Corporation, predominantly operated by SMEs, plays a crucial role in resource recovery , employment generation, and environmental management. Analysis of buying and selling margins across different plastic types reveals that PET commands the highest value in both procurement (Tk. 35.71/kg) and resale (Tk. 48.00/kg), while PS consistently recorded the lowest. HDPE provided the highest net margin (Tk. 9.08/kg), indicating its profitability, whereas LDPE and elastomers yielded lower margins due to comparable operational costs. Interestingly, although PET exhibits higher value, HDPE outperforms in profit margin, showcasing variation in economic viability across plastic types.
Despite the potential profitability, the sector remains highly informal and fragmented. Recyclers typically handle multiple plastic types, yet lack specialization or structured operational models. Value chain analysis indicates recyclers add 15–55% value to materials, which is significant compared to other industries. However, the benefits do not translate into improved working or living conditions for workers, mainly due to weak business management, limited technical knowledge, and absence of trade bodies or support mechanisms.
Occupational health and environmental compliance remain critical concerns . Most facilities lack basic safety infrastructure such as personal protective equipment, sanitation facilities, or fire safety systems. Wastewater is discharged directly into municipal drains, often ending up in rivers like the Buriganga, due to the absence of effluent treatment plants (ETPs) . This not only deteriorates environmental quality but also raises long-term public health concerns. The spatial distribution of recycling units is largely unplanned, with most factories operating from rented premises of 300–400 sq. ft., paying high rents averaging Tk. 52/sq. ft. Factory owners, often lacking formal documentation or licenses, operate without any institutional financial support. None of the surveyed units received bank loans, citing procedural hurdles and document deficiencies, leaving them dependent on personal or informal funding sources.
While 14% of the workforce comprises women, the presence of child labor poses serious ethical and health concerns . Business sustainability is weak , with 28% of surveyed factories reporting losses, primarily due to high operational costs and informal ‘subscriptions’ extracted by local musclemen. Although 8% of factories report annual revenues above Tk. 1 crore, over one-third are financially unhealthy and at risk of closure .
In summary, while Dhaka's plastic recycling industry demonstrates strong potential through value addition and raw material availability, its long-term viability is threatened by informality, lack of regulatory oversight, poor working conditions, and limited access to finance. Policy support, formalization, and technological upgrades are essential to ensure this sector contributes meaningfully to the circular economy while safeguarding worker rights and the environment.
5. Conclusion
The study highlights the critical role of SMEs in Bangladesh's waste plastic recycling value chain. These enterprises have long operated informally, generating employment and profit while transforming plastic waste into valuable products. Despite their economic and environmental contributions, SMEs face challenges such as lack of policy support, financial exclusion, poor working conditions, and limited access to modern technology. Operating with minimal investment and manual labor, many recycling hubs are located near residential or riverbank areas, often without proper treatment facilities. Nonetheless, the abundance of raw materials, low labor costs, and low production expenses present strong potential for Bangladesh to expand its plastic flake production for environmental and economic gains.
Abbreviations

MSW

Municipal Solid Waste

HDFP

Hard Plastic for Food Packaging

SMEs

Small and Medium Enterprises

MLP

Multi-Layered Plastics

DSCC

Dhaka South City Corporation

DNCC

Dhaka North City Corporation

GDP

Gross Domestic Product

PP

Polypropylene

PET

Polyethylene Terephthalate

PVC

Polyvinyl Chloride

HDPE

High-Density Polyethylene

LDPE

Low-Density Polyethylene

PS

Polystyrene

BDT

Bangladeshi Taka

Acknowledgments
We sincerely thank all co-authors for their valuable contributions to this research. We also extend our appreciation to everyone who assisted in conducting the interviews.
Author Contributions
Md Fahim Al Muntasir: Conceptualization, Formal Analysis, Investigation, Methodology, Writing – original draft, Writing – review & editing
Sabrina Hasan Orpa: Data curation, Formal Analysis, Visualization, Writing – original draft
Md Redwanul Islam: Data curation, Formal Analysis, Writing – original draft
Conflict of Interest
The authors declare no conflicts of interest.
References
[1] Ahmed, F., Kamal, A. K. I., & Idrish, M. H. B. (2023). A review of current water governance in Bangladesh: A Case study on administrative and performance of water policy.
[2] Ahmed, F., Ahmed, F., Alam, M., Islam, M. R., & Kamal, A. K. I. Sanitation and Environmental Status of Near by Village around the Industrial Activities of Dhaka Export Processing Zone (DEPZ), Bangladesh.
[3] N. Nahar, “Effects of Environmental Pollution on Public Health in Dhaka City, Bangladesh,” Sriwijaya Journal of Environment, vol. 9, no. 3, pp. 133–140, Dec. 2024,
[4] Ahmed, F., Bayazid, A. Z. M., Islam, M. M., Rahaman, M. Z., & Al Muntasir, M. F. (2024). The terrible air pollution in Dhaka city is getting worse. GSC Adv. Res. Rev, 19, 42-52.
[5] M. A. B. R. Akanda, S. Hashem, P. Roy, M. M. Haque, and M. A. Salam, “Black soldier fly farming in Bangladesh: current practices, farmer’s challenges and future opportunities,” J Insects Food Feed, pp. 1–15, Feb. 2025,
[6] A. J. K. A. S. Tonni, “Assessing plastic waste management in Historic Urban areas: The case study of Old Dhaka, Bangladesh,” Australian Journal of Science and Technology, vol. 9, no. 1, Mar. 2025.
[7] World Bank. 2021. “Towards a Multisectoral Action Plan for Sustainable Plastic Management in Bangladesh.” Washington, DC. The World Bank Group.
[8] Quarterly Review on Readymade Garments (RMG), Bangladesh Bank, April-June FY'22.
[9] Begum, L. A., Talukder M. S., Rahman, M. M., et. al., 2022. Estimating the contribution of SMEs output on GDP growth in Bangladesh - A VECM Approach. Special Research Work-SP 2022-02. Research Department Division-4 (Special Studies and Fiscal Affairs Wing), Bangladesh Bank.
[10] Md. Abdullah, & Abedin, M. Z. (2024). Assessment of plastic waste management in Bangladesh: A comprehensive perspective on sorting, production, separation, and recycling. Results in Surfaces and Interfaces, 15, 100221.
[11] Hasan, M. N., Anastasiadis, S., & Spence, L. J. (2021). Polluting SMEs and the construction of their environmental behaviours: Evidence from Bangladesh. Business Strategy & Development, 4(2), 109–122.
[12] Paul, S. (2008). Approaches to restore water quality of Buriganga river [Master’s thesis, Bangladesh University of Engineering and Technology]. BUET Institutional Repository.
[13] Raihan, S., & Bidisha, S. H. (2018). Female employment stagnation in Bangladesh. The Asia Foundation.
[14] Rahim, M. M., & Alam, S. (2014). Convergence of corporate social responsibility and corporate governance in weak economies: The case of Bangladesh. Journal of Business Ethics, 121, 607–620.
[15] Tahmid, S. M. (2020). Review of occupational safety and health in Bangladesh [Master’s thesis, University of Eastern Finland]. UEF Repository.
Cite This Article
  • APA Style

    Muntasir, M. F. A., Orpa, S. H., Islam, M. R. (2025). Identifying the Value Chain of Different Types of Recyclable Waste Plastics: Case Study on Selected SMEs of Dhaka City. American Journal of Environmental Science and Engineering, 9(3), 115-124. https://doi.org/10.11648/j.ajese.20250903.13

    Copy | Download

    ACS Style

    Muntasir, M. F. A.; Orpa, S. H.; Islam, M. R. Identifying the Value Chain of Different Types of Recyclable Waste Plastics: Case Study on Selected SMEs of Dhaka City. Am. J. Environ. Sci. Eng. 2025, 9(3), 115-124. doi: 10.11648/j.ajese.20250903.13

    Copy | Download

    AMA Style

    Muntasir MFA, Orpa SH, Islam MR. Identifying the Value Chain of Different Types of Recyclable Waste Plastics: Case Study on Selected SMEs of Dhaka City. Am J Environ Sci Eng. 2025;9(3):115-124. doi: 10.11648/j.ajese.20250903.13

    Copy | Download

  • @article{10.11648/j.ajese.20250903.13,
      author = {Md Fahim Al Muntasir and Sabrina Hasan Orpa and Md Redwanul Islam},
      title = {Identifying the Value Chain of Different Types of Recyclable Waste Plastics: Case Study on Selected SMEs of Dhaka City},
      journal = {American Journal of Environmental Science and Engineering},
      volume = {9},
      number = {3},
      pages = {115-124},
      doi = {10.11648/j.ajese.20250903.13},
      url = {https://doi.org/10.11648/j.ajese.20250903.13},
      eprint = {https://article.sciencepublishinggroup.com/pdf/10.11648.j.ajese.20250903.13},
      abstract = {This study investigates the role of small and medium enterprises (SMEs) in the plastic waste recycling value chain in Dhaka, Bangladesh. The research focuses on identifying the value chain of different types of recyclable waste plastics and assessing the pattern of post-consumer plastic waste disposal, recycling practices, and the prospects and challenges faced by SMEs. Dhaka City Corporation, comprising Dhaka North City Corporation (DNCC) and Dhaka South City Corporation (DSCC), generates an estimated 6,400 tons of waste daily, of which approximately 640 tons are plastic waste. Among this, around 37% is recycled, with SMEs playing a central role in collection, sorting, and processing activities. Data were collected through surveys and field visits to 617 recycling units across the city. The study analyzed the economic dynamics of different plastic types, revealing that polyethylene terephthalate (PET) and high-density polyethylene (HDPE) offer the highest procurement and resale values. PET is procured at Tk. 35.71 per kg and resold at Tk. 48.00 per kg, while HDPE provides the highest net margin of Tk. 9.08 per kg. Value addition across various plastic types ranges from 15% to 55%. The plastic waste stream primarily consists of low-density polyethylene (LDPE) from single-use plastic bags (about 40%) and multi-layered plastics (MLP) (around 7%). The findings indicate that the sector is largely informal and fragmented, with most recycling units operating from small rented spaces without formal documentation, licenses, or access to institutional finance. Occupational safety measures, environmental compliance, and technological integration are minimal, with most facilities lacking personal protective equipment and effluent treatment systems. The spatial distribution of units is unplanned, and a significant portion of factories report financial instability. Despite these challenges, SMEs contribute significantly to resource recovery, employment, and environmental management in Dhaka. The study highlights the structure of the plastic recycling value chain and the operational realities of SMEs in this sector.},
     year = {2025}
    }
    

    Copy | Download

  • TY  - JOUR
    T1  - Identifying the Value Chain of Different Types of Recyclable Waste Plastics: Case Study on Selected SMEs of Dhaka City
    AU  - Md Fahim Al Muntasir
    AU  - Sabrina Hasan Orpa
    AU  - Md Redwanul Islam
    Y1  - 2025/07/06
    PY  - 2025
    N1  - https://doi.org/10.11648/j.ajese.20250903.13
    DO  - 10.11648/j.ajese.20250903.13
    T2  - American Journal of Environmental Science and Engineering
    JF  - American Journal of Environmental Science and Engineering
    JO  - American Journal of Environmental Science and Engineering
    SP  - 115
    EP  - 124
    PB  - Science Publishing Group
    SN  - 2578-7993
    UR  - https://doi.org/10.11648/j.ajese.20250903.13
    AB  - This study investigates the role of small and medium enterprises (SMEs) in the plastic waste recycling value chain in Dhaka, Bangladesh. The research focuses on identifying the value chain of different types of recyclable waste plastics and assessing the pattern of post-consumer plastic waste disposal, recycling practices, and the prospects and challenges faced by SMEs. Dhaka City Corporation, comprising Dhaka North City Corporation (DNCC) and Dhaka South City Corporation (DSCC), generates an estimated 6,400 tons of waste daily, of which approximately 640 tons are plastic waste. Among this, around 37% is recycled, with SMEs playing a central role in collection, sorting, and processing activities. Data were collected through surveys and field visits to 617 recycling units across the city. The study analyzed the economic dynamics of different plastic types, revealing that polyethylene terephthalate (PET) and high-density polyethylene (HDPE) offer the highest procurement and resale values. PET is procured at Tk. 35.71 per kg and resold at Tk. 48.00 per kg, while HDPE provides the highest net margin of Tk. 9.08 per kg. Value addition across various plastic types ranges from 15% to 55%. The plastic waste stream primarily consists of low-density polyethylene (LDPE) from single-use plastic bags (about 40%) and multi-layered plastics (MLP) (around 7%). The findings indicate that the sector is largely informal and fragmented, with most recycling units operating from small rented spaces without formal documentation, licenses, or access to institutional finance. Occupational safety measures, environmental compliance, and technological integration are minimal, with most facilities lacking personal protective equipment and effluent treatment systems. The spatial distribution of units is unplanned, and a significant portion of factories report financial instability. Despite these challenges, SMEs contribute significantly to resource recovery, employment, and environmental management in Dhaka. The study highlights the structure of the plastic recycling value chain and the operational realities of SMEs in this sector.
    VL  - 9
    IS  - 3
    ER  - 

    Copy | Download

Author Information
  • Abstract
  • Keywords
  • Document Sections

    1. 1. Introduction
    2. 2. Methodology
    3. 3. Results
    4. 4. Discussion
    5. 5. Conclusion
    Show Full Outline
  • Abbreviations
  • Acknowledgments
  • Author Contributions
  • Conflict of Interest
  • References
  • Cite This Article
  • Author Information