In this paper, a total of 330 soil samples with 0-100cm soil depth of 66 planted square forest (10*10m) with different canopy density in the Loess Plateau were selected for the determination and analysis of soil N content in different soil layers, and the effects of different canopy density on soil N cycle under different topographic factors of planted forest were studied. The results showed as follows: (1) the migration mechanism of different N forms to the root surface was different, the migration of nitrate nitrogen to the root surface mainly depended on mass flow, there was enrichment phenomenon near the root, ammonium nitrogen mainly through diffusion, resulting in deficiency and loss in the near rhizosphere, and the leaching loss of nitrate nitrogen was affected by soil water and root growth. (2) The thickness, composition and decomposition rate of litter were different due to different canopy density, which affected the content of ammonium nitrogen and nitrate nitrogen in forest soil. (3) Although the change of different regions in this region was spatially different, keeping the stand cover in the middle and high range of 0.75-0.8 can be conducive to maintaining the balance between the consumption of soil nutrients by the stand and the supplement of nutrient consumption, which can also be conducive to the sustainable recovery and growth of the stand in this region.
| Published in | American Journal of Environmental Science and Engineering (Volume 8, Issue 2) |
| DOI | 10.11648/j.ajese.20240802.12 |
| Page(s) | 23-40 |
| Creative Commons |
This is an Open Access article, distributed under the terms of the Creative Commons Attribution 4.0 International License (http://creativecommons.org/licenses/by/4.0/), which permits unrestricted use, distribution and reproduction in any medium or format, provided the original work is properly cited. |
| Copyright |
Copyright © The Author(s), 2024. Published by Science Publishing Group |
Influence, Canopy Density, Cycling, Soil Available N, Landform, Loess Plateau
3.1. Woodland Quadrat Layout
Slope direction | Slope position | Slope gradient | Number of sampling points | Slope direction | Slope position | Slope gradient | Number of sampling points |
|---|---|---|---|---|---|---|---|
Shady slope | On the top | 0~5° | 4 | Shady slope | On the top | 0~5° | 2 |
5~15° | 2 | 5~15° | 2 | ||||
15~20° | 0 | 15~20° | 0 | ||||
20~25° | 2 | 20~25° | 0 | ||||
25~30° | 0 | 25~30° | 0 | ||||
>30° | 0 | >30° | 0 | ||||
Up slope | 0~5° | 0 | Up slope | 0~5° | 0 | ||
5~15° | 1 | 5~15° | 0 | ||||
15~20° | 2 | 15~20° | 0 | ||||
20~25° | 4 | 20~25° | 0 | ||||
25~30° | 0 | 25~30° | 1 | ||||
>30° | 3 | >30° | 1 | ||||
Middle slope | 0~5° | 0 | Middle slope | 0~5° | 0 | ||
5~15° | 0 | 5~15° | 0 | ||||
15~20° | 3 | 15~20° | 0 | ||||
20~25° | 6 | 20~25° | 0 | ||||
25~30° | 0 | 25~30° | 0 | ||||
>30° | 0 | >30° | 0 | ||||
Down slope | 0~5° | 0 | Down slope | 0~5° | 0 | ||
5~15° | 0 | 5~15° | 0 | ||||
15~20° | 0 | 15~20° | 0 | ||||
20~25° | 0 | 20~25° | 1 | ||||
25~30° | 0 | 25~30° | 0 | ||||
>30° | 0 | >30° | 0 | ||||
Shady slope | On the top | 0~5° | 1 | Shady slope | On the top | 0~5° | 1 |
5~15° | 1 | 5~15° | 1 | ||||
15~20° | 1 | 15~20° | 0 | ||||
20~25° | 0 | 20~25° | 0 | ||||
25~30° | 0 | 25~30° | 1 | ||||
>30° | 0 | >30° | 0 | ||||
Up slope | 0~5° | 0 | Up slope | 0~5° | 0 | ||
5~15° | 0 | 5~15° | 1 | ||||
15~20° | 0 | 15~20° | 2 | ||||
20~25° | 0 | 20~25° | 1 | ||||
25~30° | 0 | 25~30° | 2 | ||||
>30° | 0 | >30° | 3 | ||||
Middle slope | 0~5° | 0 | Middle slope | 0~5° | 0 | ||
5~15° | 0 | 5~15° | 0 | ||||
15~20° | 0 | 15~20° | 0 | ||||
20~25° | 1 | 20~25° | 3 | ||||
25~30° | 0 | 25~30° | 3 | ||||
>30° | 0 | >30° | 1 | ||||
Down slope | 0~5° | 0 | Down slope | 0~5° | 1 | ||
5~15° | 0 | 5~15° | 0 | ||||
15~20° | 0 | 15~20° | 1 | ||||
20~25° | 0 | 20~25° | 1 | ||||
25~30° | 0 | 25~30° | 3 | ||||
>30° | 0 | >30° | 1 |
3.2. Sample Number Statistics of Forest Canopy Density Survey
section | <0.8 | ≥0.8 | total | |||
|---|---|---|---|---|---|---|
Canopy density | <0.7 | 0.7-0.75 | 0.75-0.8 | 0.8-0.85 | ≥0.85 | |
Sample size | 9 | 22 | 11 | 13 | 11 | 66 |
subtotal | 42 | 24 | 66 | |||
3.3. Forest Soil Sampling and Determination Methods
3.3.1. Soil Sampling
3.3.2. Determination of N in Soil
3.4. Results of Averaging the Measured Values
3.4.1. Soil Ammonium Nitrogen
subzone | Soil depth (cm) | Canopy density | ||||
|---|---|---|---|---|---|---|
<0.7 | 0.7-0.75 | 0.75-0.8 | 0.8-0.85 | ≥0.85 | ||
The whole area | 0-20 | 25.14 | 37.21 | 30.42 | 27.92 | 23.50 |
20-40 | 23.86 | 37.18 | 30.76 | 27.28 | 19.04 | |
40-60 | 23.20 | 35.10 | 29.95 | 22.96 | 20.62 | |
60-80 | 20.79 | 32.23 | 28.01 | 25.26 | 21.70 | |
80-100 | 19.84 | 29.81 | 30.94 | 26.18 | 23.56 | |
The average | 22.57 | 34.31 | 30.01 | 25.92 | 21.68 | |
wasteland and gully areas | 0-20 | —— | 65.24 | 12.91 | —— | —— |
20-40 | —— | 54.99 | 13.71 | —— | —— | |
40-60 | —— | 58.29 | 14.80 | —— | —— | |
60-80 | —— | 58.65 | 11.66 | —— | —— | |
80-100 | —— | 46.45 | 11.79 | —— | —— | |
The average | —— | 56.72 | 12.97 | —— | —— | |
Plateau and gully region | 0-20 | 28.11 | 36.33 | 44.55 | 14.87 | 20.80 |
20-40 | 18.46 | 19.34 | 20.21 | 17.18 | 16.96 | |
40-60 | 15.79 | 16.48 | 17.16 | 15.88 | 17.03 | |
60-80 | 17.02 | 16.79 | 16.55 | 12.61 | 18.15 | |
80-100 | 16.99 | 16.07 | 15.15 | 14.89 | 17.16 | |
The average | 19.28 | 21.00 | 22.72 | 15.09 | 18.02 | |
Hilly and gully areas | 0-20 | 23.65 | 31.19 | 29.88 | 30.10 | 26.74 |
20-40 | 26.56 | 33.00 | 32.67 | 28.96 | 21.54 | |
40-60 | 26.91 | 30.84 | 32.10 | 24.14 | 24.92 | |
60-80 | 22.67 | 26.06 | 29.97 | 27.37 | 25.94 | |
80-100 | 21.26 | 26.27 | 33.47 | 28.06 | 31.25 | |
The average | 24.21 | 29.47 | 31.62 | 27.73 | 26.08 | |
3.4.2. Soil Nitrate Nitrogen
subzone | Soil depth (cm) | Canopy density | ||||
|---|---|---|---|---|---|---|
<0.7 | 0.7-0.75 | 0.75-0.8 | 0.8-0.85 | ≥0.85 | ||
The whole area | 0-20 | 1.77 | 1.91 | 2.46 | 2.10 | 1.97 |
20-40 | 1.53 | 1.44 | 2.29 | 1.78 | 1.50 | |
40-60 | 0.44 | 1.56 | 1.72 | 1.77 | 1.28 | |
60-80 | 0.60 | 1.08 | 1.10 | 1.12 | 1.06 | |
80-100 | 0.51 | 0.52 | 0.78 | 0.66 | 0.88 | |
The average | 0.97 | 1.30 | 1.67 | 1.49 | 1.34 | |
wasteland and gully areas | 0-20 | —— | 1.59 | 0.75 | —— | —— |
20-40 | —— | 1.24 | 0.69 | —— | —— | |
40-60 | —— | 1.55 | 0.01 | —— | —— | |
60-80 | —— | 0.90 | 0.02 | —— | —— | |
80-100 | —— | 0.63 | 0.73 | —— | —— | |
The average | —— | 1.18 | 0.44 | —— | —— | |
Plateau and gully region | 0-20 | 3.85 | 4.49 | 5.13 | 1.18 | 2.67 |
20-40 | 2.21 | 2.56 | 2.91 | 2.92 | 1.88 | |
40-60 | 0.58 | 1.06 | 1.54 | 2.49 | 1.66 | |
60-80 | 1.01 | 0.96 | 0.91 | 1.28 | 1.43 | |
80-100 | 0.64 | 0.69 | 0.74 | 0.55 | 0.97 | |
The average | 1.66 | 1.96 | 2.25 | 1.68 | 1.72 | |
Hilly and gully areas | 0-20 | 0.74 | 2.21 | 2.27 | 2.25 | 1.12 |
20-40 | 1.18 | 1.34 | 2.31 | 1.60 | 1.04 | |
40-60 | 0.37 | 1.27 | 1.83 | 1.65 | 0.82 | |
60-80 | 0.39 | 1.24 | 1.17 | 1.10 | 0.61 | |
80-100 | 0.44 | 0.55 | 0.79 | 0.68 | 0.78 | |
The average | 0.62 | 1.32 | 1.67 | 1.46 | 0.87 | |
4.1. Soil Ammonium Nitrogen Profile Analysis
4.2. Soil Nitrate N Profile Analysis
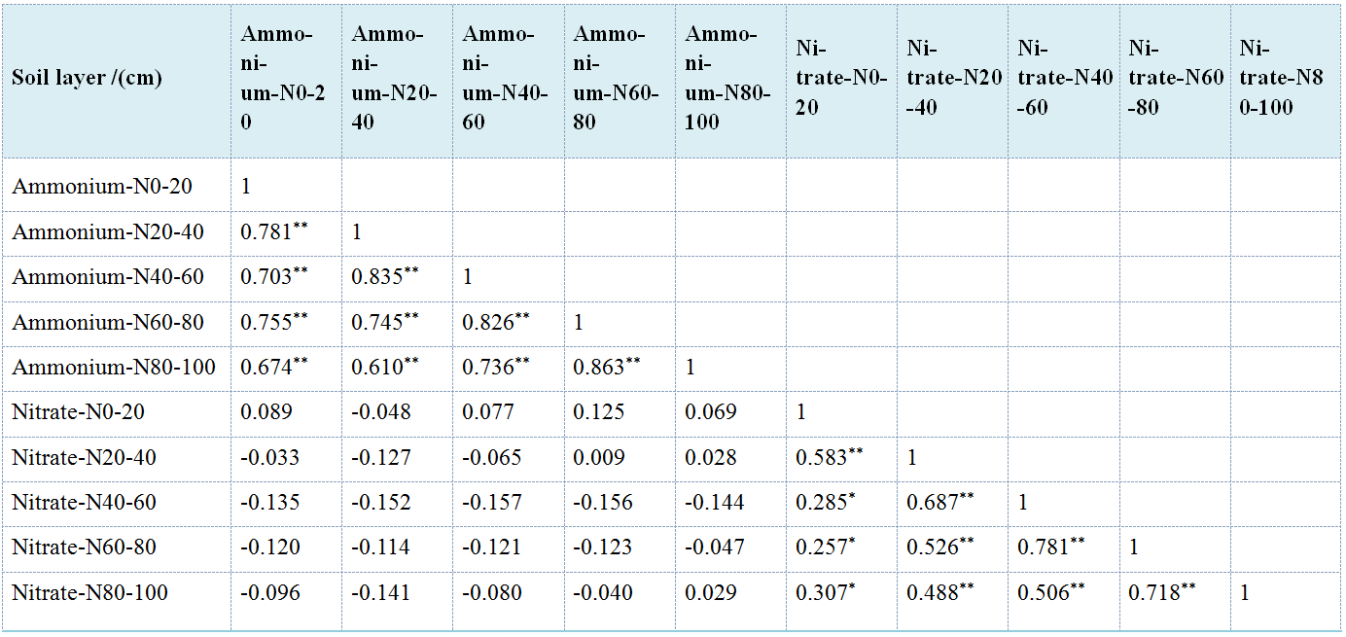
5.1. Correlation Analysis of the Total Area
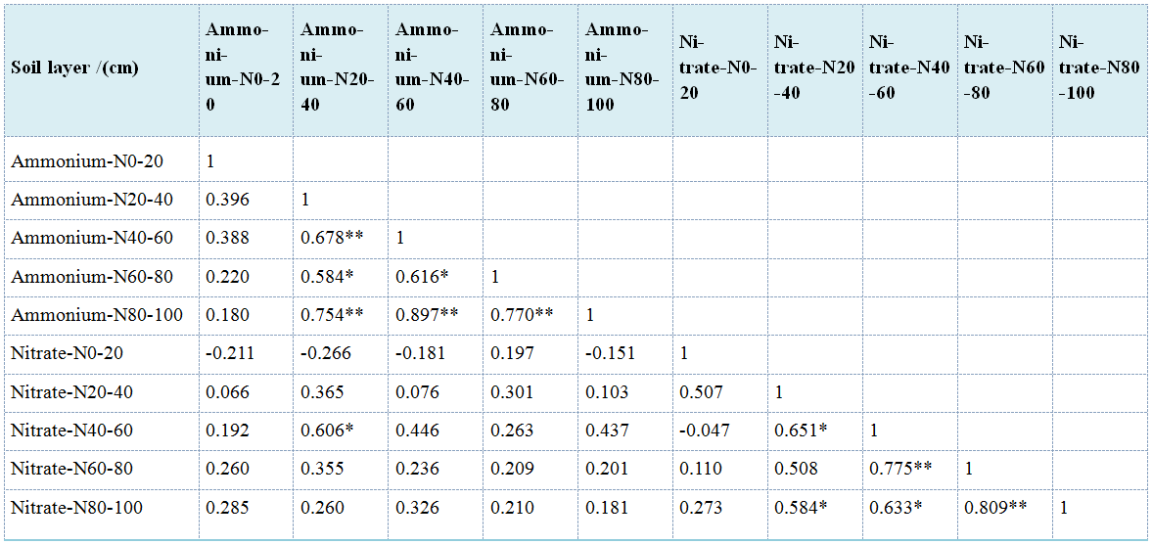
5.2. Correlation Analysis in the Gully Area of the Gully Tableland

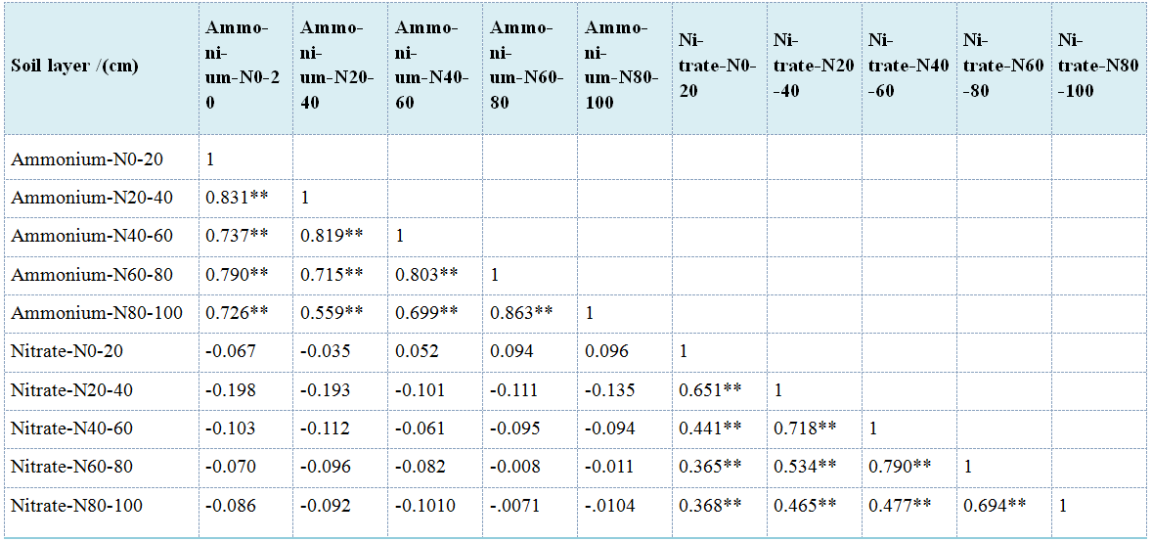
5.3. Correlation Analysis in the Plateau Gully Region
5.4. Correlation Analysis in the Loess Hilly and Gully Region
| [1] | Ding Wenbin, Wang Fei. Effects of vegetation construction on soil moisture in Loess Plateau [J]. Acta Ecologica Sinica, 202, 42(13): 5531-5542. (in Chinese) |
| [2] | Zhao Zhong, Li Jian, Yuan Zhifa, et al. Mathematical model of vertical change of soil moisture in the forest land of Black Locust in loess [J]. Scientia Silvae Sinicae, 2009, 45(10): 9-13. |
| [3] | Li Xiaoying, Duan Zhenghu, Tan Mingliang, et al. Study on the relationship between vegetation distribution and soil moisture in the western hilly region of the Loess Plateau under different precipitation conditions [J]. Chinese Journal of Soil Science, 2014, 45(02): 364-369. |
| [4] | HU L J. Soil water ecological environment of vegetation restoration in Loess Plateau [D]. Northwest A & F University, 2002: 1-2. (in Chinese) |
| [5] | [ZHANG W H, LIU G B, vegetation restoration and construction strategies in Loess Plateau. Soil and Water Conservation in China, 2009, (1): 24-26.] |
| [6] | Zhao Y L. Research on deep soil water at different scales in loess region [D]. University of Chinese Academy of Sciences (Research Center for Soil and Water Conservation and Ecological Environment of the Ministry of Education, Chinese Academy of Sciences), 2017: 1-2. (in Chinese) |
| [7] | Zhang Jingjing, Wang Li. Study on surface soil moisture in loess Plateau and gully region [J]. Bulletin of Soil and Water Conservation, 2011, 31(1): 93-97. |
| [8] | Yang Yahui, Zhao Wenhui, et al. Effects of different vegetation on soil water distribution in gully region of Loess Plateau [J]. Research of Soil and Water Conservation [Research, 2018, 25(4): 60-64. |
| [9] | ZHANG L Y, Di L, Ren Y B, et al. Soil water difference analysis of different vegetation measures in Zhonggou small watershed of Longdong Loess Plateau [J]. Research of Soil and Water Conservation, 2021, 28(04): 159-164+170. (in Chinese) |
| [10] | Hu Wei, Shao Mingan, WANG Quanjiu. Scale study on spatial variation of soil water in reclaimed slope of Loess Plateau [J]. Transactions of the Chinese Society of Agricultural Engineering, 2005(8): 11-16. |
| [11] | Wu Guanyu. Water use efficiency and its influencing factors of typical farmland conversion to forest in loess hilly region [J]. Water Saving Irrigation, 2021(10): 78-83, 88. |
| [12] | Ma Xianghua, Bai Wenjuan, Jiao Juying, et al. Study on soil water change during vegetation restoration in the Loess hilly and gully region [J]. Bulletin of Soil and Water Conservation, 2004(05): 19-23. |
| [13] | Zhang Yongwang, Wang Jun, Qu Yatan, et al. Evaluation of soil water availability during vegetation restoration in the Loess Plateau [J]. Journal of Irrigation and Drainage, 2019, 39(06): 79-85, 114. |
| [14] | Li Xiaoying, Duan Zhenghu. Research progress on the interaction between soil water and vegetation in the Loess Plateau [J]. Chinese Journal of Soil Science, 2012, 43(06): 1508-1514. (in Chinese) |
| [15] | WANG Fu, HE Q, ZHAO Q, Sha X Y, Zhang H, Han F, Soil moisture change of water conservation forest during vegetation restoration in loess hilly and gully region: A case study ofHulu River Basin in Pingliang City, China, 2023, (8): 26-30. |
| [16] | LIU Chaohua, Li Fengqiao, Liao Yangwenke, et al. Research progress on the influence process of plantation on soil fertility and its control [J]. Acta Pedologica Sinica, 2023, 60 (3): 644-656. (in Chinese) |
| [17] | YAN Xin, AN Hui, LIU Rentao. Effects of Desertification on Soil Physiochemical Properties of Desert Grassland. Soils, 2019, 51(5): 1006-1012. |
| [18] | Guo Q, Wen ZM, Zheng C, et al. Effects of Robinia pseudoacacia on the undergrowth of herbaceous plants and soil properties in the Loess Plateau of China. Journal of Plant Ecology, 2021, 14: 896-910. |
| [19] | Christine Heuck, Alfons Weig, Marie Spohn. Soil microbial biomass C:N:P stoichiometry and microbial use of organic phosphorus. Soil Biology and Biochemistry, 2015, 85. |
| [20] | Fan Xinghuo, GE Hongyan, Zhang Shencan, et al. Soil fertility status of typical stand of ecological non-commercial forest in Jiangxi Province [J]. Journal of Beijing Forestry University, 2018, 40(11): 84-92. |
| [21] | Duan C W, Li X L, Chai Y, Xu W Y, Su L L, Ma P P, Yang X G. Effects of different rehabilitation measures on plant community and soil nutrient of degraded alpine meadow in the Yellow River Source. Acta Ecologica Sinica, 2022, 42(18): 7652-7662. |
| [22] | HU Xuehan, LIU Juan, JIANG Peikun, ZHOU Guomo, LI Yongfu, WU Jiasen. Effects of Change in Forest Type on Soil Organic Carbon in Soil Particles Relative to Size in Subtropical China [J]. Acta Pedologica Sinica, 2018, 55(6): 1485-1493. |
| [23] | HU Ercha, WANG Xiaojiang, WANG Zheng, et al. Characteristics of Understory Plant Community of Poplar Plantation in Mu Us Sandy Land [J]. Forest Research, 2023, 36(5): 189-197. |
| [24] | Bell F W, Lamb E G, Sharma M, Hunt S, Anand M, Dacosta J, Newmaster S G. Relative influence of climate, soils, and disturbance on plant species richness in northem temperate and boreal forests. Forest Ecology and Management, 2016, 381: 93-105. |
| [25] | Zhang Ten. Soil quality evaluation of typical land use methods in hilly and gully areas of the Loess Plateau [D]. Yan 'an university, 2023. |
| [26] | XI Li, LI Siyao, XIA Xiaoying, CHEN Yuwen, et al. Study on soil nutrient characteristics of Picea schrenkiana var. Tianschanica forest with different canopy densities [J]. Xinjiang Agricultural Sciences, 2023, 60(9): 2216-2222. |
| [27] | Li Binbin. The coupling mechanism and resilience of soil carbon, nitrogen and water during vegetation restoration in the China’s Loess Plateau. University of Chinese Academy of Sciences (Research Center of Soil and Conservation and Ecological Environment, Chinese Academy of Sciences and Ministry of), 2021. |
| [28] | YU Yunlong. Influence of gully control and land reclamation on nitrogen cycle and its internal mechanism in a small watershed of loess hilly region in northern Shaanxi Province [D]. University of Chinese Academy of Sciences (Institute of Earth Environment, Chinese Academy of Sciences), 2019. |
| [29] | LI Changzhen. Soil Nitrogen Accumulation and Transformation Impact on Soil Carbon Pool Under Different Plantationsin the Loess Hilly Region of China [D]. Northwest A&F University, 2017. |
| [30] | AI Zemin, CHEN Yunming, CAO Yang. Storage and allocation of carbon and nitrogen in Robinia pseudoacacia plantation at different ages in the loess hilly region, China. [J]. Chinese Journal of Applied Ecology, 2014, 25(02): 333-341. |
| [31] | Dong Yunzhong, Wang Yongliang, Zhang Jianjie, et al. Soil carbon and nitrogen storage of different land use types in northwestern Shanxi Loess Plateau [J]. Chinese Journal of Applied Ecology, 2014, 25(04): 955-960. |
| [32] | JIANG Yueli, ZHAO Tong, YAN Hao, et al. Effect of Different Land Uses on Soil Microbial Biomass Carbon, Nitrogen and Phosphorus in Three Vegetation Zones on Loess Hilly Area [J]. Bulletin of Soil and Water Conservation, 2013, 33(06): 62-68. |
| [33] | LI Ze, GUO Sheng-li, ZHANG Fang, ZOU Jun-liang. Effects of apple orchard converted from cropland on C and N storages in terrestrial system of slopping cultivated land in the Loess Gully Regions [J]. Journal of Plant Nutrition and Fertilizers, 2011, 17(4): 919-924. |
| [34] | LIANG Ai-hua, HAN Xin-hui, ZHANG Yang, WANG Ping-ping, YANG Gai-he. Spatio-temporal Response of Soil Carbon and Nitrogen Relation to the Process of Vegetation Restoration in the Gully Region of Loess Plateau [J]. Acta Agrestia Sinica, 2013, 21(5): 842-849. |
| [35] |
Deng L, Shangguan Z, Sweeney S. Correction: Changes in Soil Carbon and Nitrogen following Land Abandonment of Farmland on the Loess Plateau, China. [J]. PLoS ONE, 2013, 8(9): 101371
https://doi.org/10.1371/annotation/61b7e0d5-6062-49b7-a270-2c115dd3cb8f |
| [36] | Gao Y, He N, Yu G, et al. Long-term effects of different land use types on C, N, and P stoichiometry and storage in subtropical ecosystems: A case study in China [J]. Ecological Engineering, 2014, 67171-181. |
| [37] | Inselsbacher E. Recovery of individual soil nitrogen forms after sieving and extraction [J]. Soil Biology and Biochemistry, 2014, 71, 76-86. |
| [38] | Zhang He, Wang Fu, Zhao Qiang, Sha Xiao Yan, Wang Chun Ping,. Soil nutrient distribution characteristics and topographic factors of plantation: A case study of Pingliang City in eastern Gansu Province, China [J], Soil and water conservation in China, 2023(12): 44-48. |
APA Style
Fu, W., He, Z., Qian, H., Yan, S. X., Qiang, Z., et al. (2024). Study on the Influence of Canopy Density on Cycling of Soil Available N in Different Landform of Loess Plateau in China. American Journal of Environmental Science and Engineering, 8(2), 23-40. https://doi.org/10.11648/j.ajese.20240802.12
ACS Style
Fu, W.; He, Z.; Qian, H.; Yan, S. X.; Qiang, Z., et al. Study on the Influence of Canopy Density on Cycling of Soil Available N in Different Landform of Loess Plateau in China. Am. J. Environ. Sci. Eng. 2024, 8(2), 23-40. doi: 10.11648/j.ajese.20240802.12
AMA Style
Fu W, He Z, Qian H, Yan SX, Qiang Z, et al. Study on the Influence of Canopy Density on Cycling of Soil Available N in Different Landform of Loess Plateau in China. Am J Environ Sci Eng. 2024;8(2):23-40. doi: 10.11648/j.ajese.20240802.12
@article{10.11648/j.ajese.20240802.12,
  author = {Wang Fu and Zhang He and He Qian and Sha Xiao Yan and Zhao Qiang and Han Fen},
  title = {Study on the Influence of Canopy Density on Cycling of Soil Available N in Different Landform of Loess Plateau in China
},
  journal = {American Journal of Environmental Science and Engineering},
  volume = {8},
  number = {2},
  pages = {23-40},
  doi = {10.11648/j.ajese.20240802.12},
  url = {https://doi.org/10.11648/j.ajese.20240802.12},
  eprint = {https://article.sciencepublishinggroup.com/pdf/10.11648.j.ajese.20240802.12},
  abstract = {In this paper, a total of 330 soil samples with 0-100cm soil depth of 66 planted square forest (10*10m) with different canopy density in the Loess Plateau were selected for the determination and analysis of soil N content in different soil layers, and the effects of different canopy density on soil N cycle under different topographic factors of planted forest were studied. The results showed as follows: (1) the migration mechanism of different N forms to the root surface was different, the migration of nitrate nitrogen to the root surface mainly depended on mass flow, there was enrichment phenomenon near the root, ammonium nitrogen mainly through diffusion, resulting in deficiency and loss in the near rhizosphere, and the leaching loss of nitrate nitrogen was affected by soil water and root growth. (2) The thickness, composition and decomposition rate of litter were different due to different canopy density, which affected the content of ammonium nitrogen and nitrate nitrogen in forest soil. (3) Although the change of different regions in this region was spatially different, keeping the stand cover in the middle and high range of 0.75-0.8 can be conducive to maintaining the balance between the consumption of soil nutrients by the stand and the supplement of nutrient consumption, which can also be conducive to the sustainable recovery and growth of the stand in this region.
},
 year = {2024}
}
TY  - JOUR
T1  - Study on the Influence of Canopy Density on Cycling of Soil Available N in Different Landform of Loess Plateau in China

AU  - Wang Fu
AU  - Zhang He
AU  - He Qian
AU  - Sha Xiao Yan
AU  - Zhao Qiang
AU  - Han Fen
Y1  - 2024/05/10
PY  - 2024
N1  - https://doi.org/10.11648/j.ajese.20240802.12
DO  - 10.11648/j.ajese.20240802.12
T2  - American Journal of Environmental Science and Engineering
JF  - American Journal of Environmental Science and Engineering
JO  - American Journal of Environmental Science and Engineering
SP  - 23
EP  - 40
PB  - Science Publishing Group
SN  - 2578-7993
UR  - https://doi.org/10.11648/j.ajese.20240802.12
AB  - In this paper, a total of 330 soil samples with 0-100cm soil depth of 66 planted square forest (10*10m) with different canopy density in the Loess Plateau were selected for the determination and analysis of soil N content in different soil layers, and the effects of different canopy density on soil N cycle under different topographic factors of planted forest were studied. The results showed as follows: (1) the migration mechanism of different N forms to the root surface was different, the migration of nitrate nitrogen to the root surface mainly depended on mass flow, there was enrichment phenomenon near the root, ammonium nitrogen mainly through diffusion, resulting in deficiency and loss in the near rhizosphere, and the leaching loss of nitrate nitrogen was affected by soil water and root growth. (2) The thickness, composition and decomposition rate of litter were different due to different canopy density, which affected the content of ammonium nitrogen and nitrate nitrogen in forest soil. (3) Although the change of different regions in this region was spatially different, keeping the stand cover in the middle and high range of 0.75-0.8 can be conducive to maintaining the balance between the consumption of soil nutrients by the stand and the supplement of nutrient consumption, which can also be conducive to the sustainable recovery and growth of the stand in this region.

VL  - 8
IS  - 2
ER  -
Ecological Technology Center, Pingliang Institute of Soil and Water Conservation, Pingliang, China
Ecological Technology Center, Pingliang Institute of Soil and Water Conservation, Pingliang, China
Ecological Technology Center, Pingliang Institute of Soil and Water Conservation, Pingliang, China
Ecological Technology Center, Pingliang Institute of Soil and Water Conservation, Pingliang, China
Ecological Technology Center, Pingliang Institute of Soil and Water Conservation, Pingliang, China
Ecological Technology Center, Pingliang Institute of Soil and Water Conservation, Pingliang, China
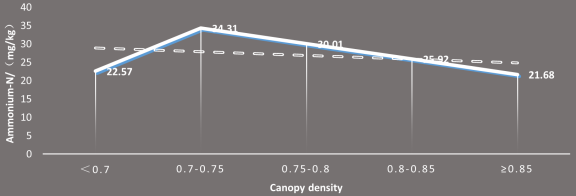
Figure 1. Changes of the average content of ammonium nitrogen in the 0-100cm soil layer of forest land with different canopy density in the whole region.

Figure 2. Changes of the average content of ammonium nitrogen in 0-100cm soil layers of woodland with different canopy density in the plateau gully region.
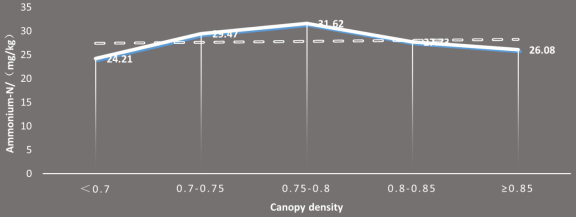
Figure 3. Changes of the average content of ammonium nitrogen in 0-100cm soil layer of woodland with different canopy density in hilly and gully region.

Figure 4. Soil ammonium nitrogen profiles in different regions with different canopy densities.
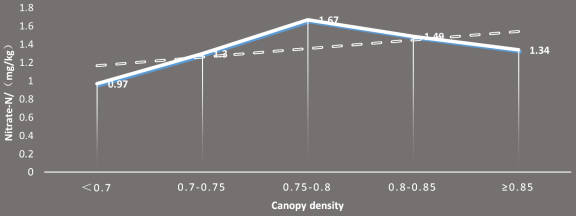
Figure 5. Changes of average nitrate nitrogen content in 0-100cm soil layer of forest land with different canopy density in the whole region.
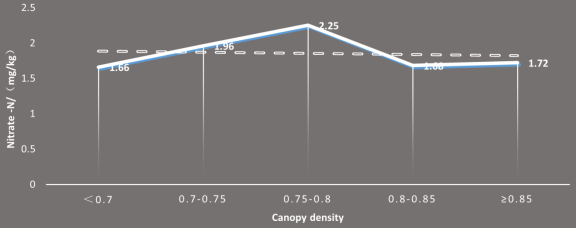
Figure 6. Changes of average nitrate nitrogen content in 0-100cm soil layers of woodland with different canopy density in the gully region of the plateau.

Figure 7. Changes of average nitrate nitrogen content in 0-100cm soil layers of woodland with different canopy density in hilly and gully region.
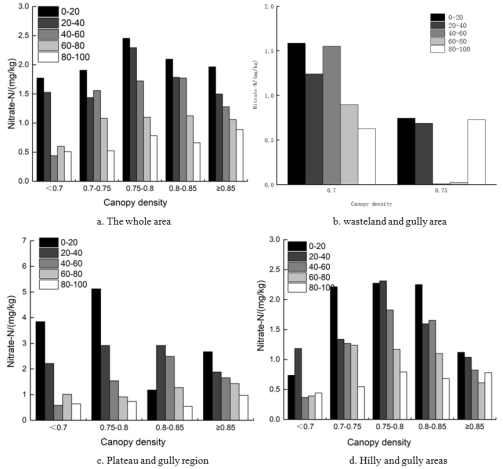
Figure 8. Soil nitrate nitrogen profiles of woodland with different canopy density in different regions.
Information

