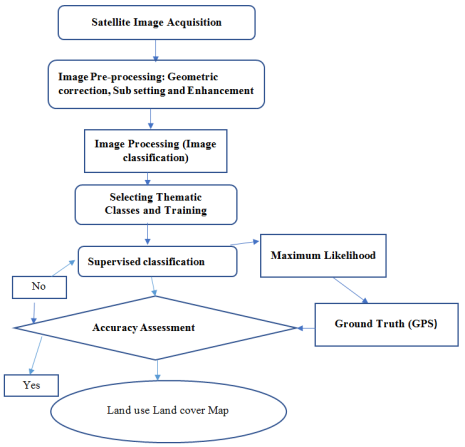
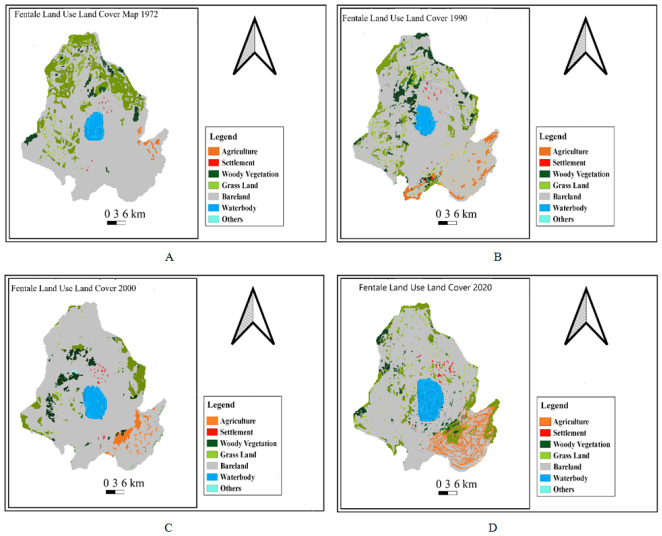
This study was conducted in Fantalle Range lands in East Shewa zone of, Oromia Region, Ethiopia, to assess land use land cover changes, trends, drivers and their socioeconomics. Household surveys were conducted through simple random sampling to collect qualitative data. Qualitative data are used to investigate the causes and effects of land use and land cover changes. SPSS software (version 20) was used for data analysis, and descriptive research methods were adopted. Additionally, map processing was done using ERDAS Imagine (version 9.1) and ArcGIS (version 10.1). The land use land cover classification activity was started by obtaining Landsat images of 1972, 1990, 2000 and 2020 at different intervals from the Earth Explorer (USGS) from the Landsat 4, Landsat 5, Landsat 7 and Landsat 8, respectively. Land use land cover change (LULCC) maps are generated based on year classification. Range land, agricultural land, woody vegetation, bare land and settlement are the five main LULCC categories generated from satellite data. The findings show that in the presence of LULCC, agricultural land, settlements and bare land expand significantly, while range land and woodland show a decreasing trend. The classification results of the 1972 image show that rangeland/grazing land accounts for the largest proportion of the land in this area, accounting for 31.6%. In addition, due to various factors, the number of livestock owned in pastoral areas is also decreasing. The main cause of changes in livestock types is drought, which can cause different impacts, such as feed and water shortages and health problems. Therefore, intervention in land use manipulation is needed to maintain ecosystems and natural resources. Furthermore, rangeland policies should be developed to maintain pastoral and pastoral systems.
| Published in | American Journal of Environmental and Resource Economics (Volume 9, Issue 3) |
| DOI | 10.11648/j.ajere.20240903.11 |
| Page(s) | 51-60 |
| Creative Commons |
This is an Open Access article, distributed under the terms of the Creative Commons Attribution 4.0 International License (http://creativecommons.org/licenses/by/4.0/), which permits unrestricted use, distribution and reproduction in any medium or format, provided the original work is properly cited. |
| Copyright |
Copyright © The Author(s), 2024. Published by Science Publishing Group |
Woody Vegetation, Rangeland, Fantalle, Drivers, Proximate Drivers
No | Land cover type | Their expression |
|---|---|---|
1 | Settlement | A land-use type that includes rural settlement area, educational, health, socio-economic facilities, residential houses, administrative buildings, small-scale industrial areas, etc. |
2 | Waterbody | Waterbody is any significant accumulation of water on the surface of Earth or another planet. The term most often refers to oceans, seas, and lakes, but it includes smaller pools of water such as ponds, wetlands, or more rarely, puddles. |
3 | Agriculture | Agricultural land is typically land devoted to agriculture, the systematic and controlled use of other forms of life |
4 | Woody vegetation | Woody plants are plants that have hard stems (thus the term, "woody") and that have buds that survive above ground in winter. The best-known examples are trees and shrubs (bushes). These are commonly broken down further into the deciduous and evergreen categories. |
5 | Grassland | A land-use type where the land is dominated by grasses, forbs, and herbs with nil or little proportion of shrubs that are used for Communal grazing. |
6 | Bare land | Areas with little or no vegetation cover consist of exposed soil and/or rock outcrops, and quarries. |
Satellite image | Imagery type | Imagery date | Used bunds | Source | Spatial Resolution | Path/R | Bands/colours |
|---|---|---|---|---|---|---|---|
Land sat_4 | MSS | January–1974 | 4 bands, 1–4 | USGS | 57*57 | 169/55 | Multi-spectral |
Landsat_5 | TM | February–1989 | 5 bunds, 1–5 | USGS | 28.5*28.5 | 169/55 | Multi-spectral |
Landsat_7 | ETM+ | January–2000 | 8 bands, 1–8 | USGS | 15*15 | 169/55 | Multi-spectral |
Landsa_8 | OLI-TIRS | January–2015 | 8 bands, 1–8 | USGS | 30*30 | 169/55 | Multi-spectral |
No | Activities | Response | N | % | Ranks | Land ownership | |
|---|---|---|---|---|---|---|---|
1 | Livestock | Yes | 90 | 85.7 | 1 | N | % |
No | 15 | 14.3 | |||||
2 | Farm land | Yes | 13 | 12.4 | 2 | 91 | 85.7 |
No | 92 | 87.6 | 14 | 14.3 | |||
No | Parameters | Characteristics | N | % |
|---|---|---|---|---|
1 | Sex | Male | 97 | 92.4 |
Female | 8 | 7.60 | ||
Total | 105 | 100 | ||
2 | Marital status | Single | 1 | 1.00 |
Married | 102 | 97.10 | ||
Widowed | 2 | 1.90 | ||
Total | 105 | 100 | ||
3 | Education status | Illiterate | 84 | 80.00 |
Formal education | 14 | 13.00 | ||
Religious education | 7 | 6.70 | ||
Total | 105 | 100 |
No | LULC classes | 1972 | 1990 | 2005 | 2020 | ||||
|---|---|---|---|---|---|---|---|---|---|
Area (sq.km) | % | Area (sq. km) | % | Area (sq.km) | % | Area (sq.km) | % | ||
1 | Agriculture | 206.53 | 17.7 | 243.87 | 20.9 | 248.54 | 21.3 | 290.31 | 24.88 |
2 | Settlement | 24.50 | 2.1 | 28.00 | 2.4 | 36.17 | 3.1 | 38.51 | 3.30 |
3 | Woody Veg. | 114.47 | 9.81 | 98.48 | 8.44 | 128.94 | 11.05 | 58.34 | 5.00 |
4 | Grassland | 354.72 | 30.4 | 255.54 | 21.9 | 206.53 | 17.7 | 175.03 | 15.00 |
5 | Bare land | 416.57 | 35.7 | 505.25 | 43.3 | 516.91 | 44.3 | 570.59 | 48.9 |
6 | Waterbody | 33.84 | 2.9 | 33.84 | 2.9 | 33.96 | 2.91 | 34.07 | 2.92 |
7 | Others | 2.22 | 0.19 | 1.87 | 0.16 | 10.50 | 0.9 | 0.0 | 0 |
Total | 1166.85 | 100 | 1166.85 | 100 | 1166.85 | 100 | 1166.85 | 100 | |
No | Reason | Rangeland changes | |||||||
|---|---|---|---|---|---|---|---|---|---|
1972 | 1990 | 2005 | 2020 | ||||||
N | % | N | % | N | % | N | % | ||
1 | Farm land expansion | 27 | 32.3 | 27 | 27.59 | 35 | 36.47 | 36 | 37.93 |
2 | Settlement | 6 | 1.54 | 14 | 13.79 | 21 | 20.00 | 17 | 17.24 |
3 | Invader | 14 | 12.9 | 13 | 12.64 | 16 | 14.12 | 18 | 18.39 |
4 | Degradation | 31 | 38.5 | 21 | 21.84 | 15 | 12.94 | 7 | 5.75 |
5 | Conflict | 12 | 10.8 | 15 | 14.94 | 9 | 5.88 | 6 | 4.60 |
6 | Water body expansion | 7 | 3.08 | 6 | 4.60 | 8 | 4.71 | 8 | 6.90 |
7 | Drought | 6 | 1.54 | 6 | 4.60 | 9 | 5.88 | 11 | 9.20 |
No | Underlay/indirect drivers | N | % | Rank |
|---|---|---|---|---|
1 | Demographic | 35 | 64 | 1 |
2 | Economic factor | 14 | 13.3 | 2 |
3 | Technology | 7 | 4.0 | 4 |
4 | Policy and institution | 14 | 13.3 | 2 |
4 | cultural factors | 8 | 5.3 | 3 |
No | Type of livestock | Trend of livestock | % of changes | |||
|---|---|---|---|---|---|---|
1975-1990 | 1990-2005 | 2005-2021 | 2021 | |||
1 | Sheep | 59.41±7.89 | 62.15±4.99 | 54.41±6.00 | 22.41±3.44 | 36.69 |
2 | Camel | 47.83±6.85 | 45.48±4.79 | 38.28±4.15 | 16.51±2.16 | 35.03 |
3 | Cattle | 43.40±10.61 | 38.70±858 | 31.58±6.21 | 13.03±4.00 | 30.34 |
4 | Goat | 32.91±7.89 | 27.65±5.05 | 18.11±3.29 | 7.74±1.94 | 33.13 |
5 | Donkey | 1.89±0.81 | 2.44±0.93 | 2.58±0.71 | 2.50±0.42 | 36.00 |
No | Reason of change | Type of livestock changes | |||||||
|---|---|---|---|---|---|---|---|---|---|
Sheep | Camel | Cattle | Goat | ||||||
N | % | N | % | N | % | N | % | ||
1 | Sold | 9 | 7.62 | 16 | 12.2 | 25 | 23.81 | 23 | 21.91 |
2 | Drought | 75 | 71.43 | 66 | 73.2 | 54 | 51.43 | 39 | 37.14 |
3 | Health problem | 15 | 13.33 | 14 | 9.8 | 16 | 14.29 | 21 | 20.00 |
4 | Others | 7 | 6.67 | 9 | 4.9 | 10 | 9.52 | 22 | 20.95 |
No | Rangeland status | N | % | Rank |
|---|---|---|---|---|
1 | Poor | 88 | 94.3 | 1 |
2 | Good | 9 | 4.5 | 2 |
3 | Very good | 6 | 1.1 | 3 |
4 | Excellent | 0 | 0 | 4 |
No | Response | Range land management | Rank | |
|---|---|---|---|---|
N | % | |||
1 | Yes | 37 | 33.00 | 2 |
2 | No | 67 | 67.00 | 1 |
No | Reason | Rangeland changes | |||||||
|---|---|---|---|---|---|---|---|---|---|
1972 | 1990 | 2005 | 2020 | ||||||
N | % | N | % | N | % | N | % | ||
1 | Farm land expansion | 26 | 32.3 | 19 | 22.6 | 18 | 23.0 | 14 | 15.8 |
2 | Settlement | 6 | 1.5 | 17 | 19.4 | 14 | 15.2 | 16 | 26.3 |
3 | Invader | 16 | 16.9 | 13 | 12.4 | 19 | 26.1 | 17 | 31.6 |
4 | Degradation | 30 | 38.5 | 24 | 30.6 | 18 | 23.9 | 16 | 26.3 |
5 | Conflict | 10 | 8.2 | 14 | 10.5 | 13 | 10.1 | 12 | 1.4 |
6 | Water body expansion | 7 | 2.4 | 9 | 2.5 | 12 | 2.8 | 15 | 3.0 |
7 | Drought | 6 | 0.2 | 8 | 2.0 | 11 | 2.9 | 15 | 2.1 |
CSA | Central Statistical Agency |
GPS | Geographical Position System |
LULCC | Land Use Land Cover Change |
N | Number |
| [1] | Abebe Armaw and Mikias Biazen Molla, 2022. Assessing the trend and magnitude of land cover dynamics and its major driving forces in Omo National Park, Southern Ethiopia, Cogent Social Sciences, 8:1, 2042055, |
| [2] | Aadil Manzoor Nanda, Rafiq Ahmad Hajam, Aadil Hamid, 2014. Changes in land-use/land-cover dynamics using geospatial techniques: A case study of Vishav drainage basin. Journal of Geography and regional planning. |
| [3] | Bakker MM, van Doorn AM, 2009. Farmer-specific relationships between lands use change and landscape factors: introducing agents in empirical land use modelling. Land Use Policy 26(3): 809–817. |
| [4] | Belay Haile Gessese, 2017. Drivers of Land Use/Land Cover Change in the Gura ferda District of Bench-Maji Zone, Southwestern Ethiopia. |
| [5] | Bewket, W. and Abebe, S., 2013. Land-use and land-cover change and its environmental implications in a tropical highland watershed, Ethiopia. International Journal of Environmental Studies, 70(1), 126–139. |
| [6] | Biazin, B. & Sterk, G., 2013. Drought vulnerability drives land-use and land cover changes in the Rift Valley drylands of Ethiopia. Agriculture, Ecosystems & Environment, 164, 100–113. |
| [7] | De Sherbinin, A., 2002. Land-Use and Land-Cover Change, A CIESIN Thematic Guide, Palisades, NY. Center for International Earth Science Information Network of Columbia University. |
| [8] | Fasika Alemayehu, Motuma Tolera and Gizaw Tesfaye, 2018. Land Use Land Cover Change Trend and Its Drivers in Somodo Watershed South Western, Ethiopia. African Journal of Agricultural Research, Vol. 14(2), pp. 102-117. |
| [9] | Fanting Gong and Qingling Liu, 2013. Monitoring land use and land cover change: a combining approach of change detection to analyze urbanization in Shijiazhuang, China. |
| [10] | Geist, H. J. and Lambin, E. F., 2002. Proximate Causes and Underlying Driving Forces of Tropical Deforestation. BioScience, 52 (2): 143-150. |
| [11] | Girma Gudesho and Zerihun Woldu, 2021. Land Use, Land Cover Changes and Their Driving Force in Wombera District, Benshangul Gumuz Regional State, Ethiopia. International Journal of Environmental Protection and Policy, Vol. 9, No. 5, pp. 110-122. |
| [12] | Gong, J., Yang, J. and Tang, W., 2015. Spatially explicit landscape-level ecological risks induced by land use and land cover change in a national ecologically representative region in China. International journal of environmental research and public health, 12, 14192-14215. |
| [13] | Hussien Ali Oumer, 2009. Land Use and Land Cover Change, Drivers and Its Impact: A Comparative Study from Kuhar Michael and Lenche Dima of Blue Nile and Awash Basins of Ethiopia. |
| [14] | Hosonuma, N., Herold, M., De Sy, V., De Fries, R. S., Brockhaus, M., Verchot, L., Romijn, E., 2012. An assessment of deforestation and forest degradation drivers in developing countries. Environmental Research Letters, 7(4), 044009. |
| [15] | Kidane, Y., Stahlmann, R., and Beierkuhnlein, C., 2012. Vegetation dynamics, and land use and land cover change in the Bale Mountains, Ethiopia. Environmental Monitoring and Assessment, 184 (12), 7473–7489. |
| [16] | Kindu, M., Schneider, T., Teketay, D., & Knoke, T., 2013. Land use/land cover change analysis using object-based classification approach in Munessa-Shashemene landscape of the Ethiopian highlands. Remote Sensing, 5(5), 2411–2435. |
| [17] | Kleemann, Janina; Christine Fürst; Gülendam Baysal; Henry N. N. Bulley; 2017. Assessing driving forces of land use and land cover change by a mixed-method approach in north-eastern Ghana, West Africa. |
| [18] | Lambin, E. F. and Geist, H. J., 2003. Global land-use and land-cover change: what have we learned so far? Global Change News Letter, (46): 27-30. |
| [19] |
Lambin, E. F. and Geist, H. J., 2007. Causes of land-use and land-cover change. Retrieved from
http://www.eoearth.org/view/article/51cbed2f7896bb431f6905af |
| [20] | Mengistu, D. A., and Waktola, D. K., 2016. Monitoring land use/land cover change impacts on soils in data-scarce environments: A case of south-central Ethiopia. Journal of Land Use Science, 11(1), 96–112. |
| [21] | Richards, J., 1999. Remote Sensing Digital Image Analysis, Berlin: Springer-Verlag, 240 pp. |
| [22] | Serra, P., Pons, X. and Sauri, D., 2003. Post Classification Change Detection with Data from Different Sensors: Some Accuracy Considerations. International Journal of Remote Sensing, 24, 3311-3340. |
| [23] | Temesgen Yadeta, Zewdu Kelkay Tessema, Fanuel Kebede, Girma Mengesha and Addisu Asefa, 2022. Land use land cover change in and around Chebera Churchura National Park, South western Ethiopia: implications for management effectiveness. Environmental Systems Research, 11: 21. |
| [24] | Turi T., Hayicho H. and Kedir H., 2019. Evaluating Land Use/Land Cover Change and its Socioeconomic Implications in Agarfa District of Bale Zone, South eastern Ethiopia. Journal of Environmental Protection, 10, 369-388. |
| [25] | Usman Semman, Meseret Tilahun, Fikadu Nemera, Dawit Abate, Nabi Husen, Lalisa Diriba, Belete Shenkute and Abule Ebro, 2017. Evaluation of Integrated Mechanical and Biological Techniques for Restoring Degraded Areas in Semi-Arid Rangelands of Fantale District, East Shoa, Ethiopia in proceeding of Regional Workshop on Review of the Completed Research Activities of Oromia Agricultural Research Institute. Proceedings of Review Workshop on Completed Research Activities of livestock Research Directorate held at Adami Tulu Agricultural Research Center, Adami Tulu, Ethiopia 17-21 November 2015. Oromia Agricultural Research Institute (IQQO), Finfinne, Ethiopia. 248 pp. |
| [26] | Wakjira Takala Dibaba, Tamene Adugna Demissie and Konrad Miegel, 2020. Drivers and Implications of Land Use/Land Cover Dynamics in Finchaa Catchment, Northwestern Ethiopia," Land, MDPI, Open Access Journal, vol. 9(4), pages 1-20. |
| [27] | Worku Bedeke, 2022. Effect of Top Dressing and Over Sowing Improved Forages on Biomass Yield and Herbaceous Composition of Grazing Land in Bursa Woreda of Sidama Region”. Medicon Agriculture & Environmental Sciences 3.3: 20-25. |
APA Style
Tilahun, M., Abate, D., Husein, N. (2024). Analysis of Land Use and Land Cover Changes and Trends in Fantalle Range Land, East Shewa Zone, Oromia Regional State, Ethiopia. American Journal of Environmental and Resource Economics, 9(3), 51-60. https://doi.org/10.11648/j.ajere.20240903.11
ACS Style
Tilahun, M.; Abate, D.; Husein, N. Analysis of Land Use and Land Cover Changes and Trends in Fantalle Range Land, East Shewa Zone, Oromia Regional State, Ethiopia. Am. J. Environ. Resour. Econ. 2024, 9(3), 51-60. doi: 10.11648/j.ajere.20240903.11
AMA Style
Tilahun M, Abate D, Husein N. Analysis of Land Use and Land Cover Changes and Trends in Fantalle Range Land, East Shewa Zone, Oromia Regional State, Ethiopia. Am J Environ Resour Econ. 2024;9(3):51-60. doi: 10.11648/j.ajere.20240903.11
@article{10.11648/j.ajere.20240903.11,
  author = {Meseret Tilahun and Dawit Abate and Nabi Husein},
  title = {Analysis of Land Use and Land Cover Changes and Trends in Fantalle Range Land, East Shewa Zone, Oromia Regional State, Ethiopia
},
  journal = {American Journal of Environmental and Resource Economics},
  volume = {9},
  number = {3},
  pages = {51-60},
  doi = {10.11648/j.ajere.20240903.11},
  url = {https://doi.org/10.11648/j.ajere.20240903.11},
  eprint = {https://article.sciencepublishinggroup.com/pdf/10.11648.j.ajere.20240903.11},
  abstract = {This study was conducted in Fantalle Range lands in East Shewa zone of, Oromia Region, Ethiopia, to assess land use land cover changes, trends, drivers and their socioeconomics. Household surveys were conducted through simple random sampling to collect qualitative data. Qualitative data are used to investigate the causes and effects of land use and land cover changes. SPSS software (version 20) was used for data analysis, and descriptive research methods were adopted. Additionally, map processing was done using ERDAS Imagine (version 9.1) and ArcGIS (version 10.1). The land use land cover classification activity was started by obtaining Landsat images of 1972, 1990, 2000 and 2020 at different intervals from the Earth Explorer (USGS) from the Landsat 4, Landsat 5, Landsat 7 and Landsat 8, respectively. Land use land cover change (LULCC) maps are generated based on year classification. Range land, agricultural land, woody vegetation, bare land and settlement are the five main LULCC categories generated from satellite data. The findings show that in the presence of LULCC, agricultural land, settlements and bare land expand significantly, while range land and woodland show a decreasing trend. The classification results of the 1972 image show that rangeland/grazing land accounts for the largest proportion of the land in this area, accounting for 31.6%. In addition, due to various factors, the number of livestock owned in pastoral areas is also decreasing. The main cause of changes in livestock types is drought, which can cause different impacts, such as feed and water shortages and health problems. Therefore, intervention in land use manipulation is needed to maintain ecosystems and natural resources. Furthermore, rangeland policies should be developed to maintain pastoral and pastoral systems.
},
 year = {2024}
}
TY  - JOUR
T1  - Analysis of Land Use and Land Cover Changes and Trends in Fantalle Range Land, East Shewa Zone, Oromia Regional State, Ethiopia

AU  - Meseret Tilahun
AU  - Dawit Abate
AU  - Nabi Husein
Y1  - 2024/08/06
PY  - 2024
N1  - https://doi.org/10.11648/j.ajere.20240903.11
DO  - 10.11648/j.ajere.20240903.11
T2  - American Journal of Environmental and Resource Economics
JF  - American Journal of Environmental and Resource Economics
JO  - American Journal of Environmental and Resource Economics
SP  - 51
EP  - 60
PB  - Science Publishing Group
SN  - 2578-787X
UR  - https://doi.org/10.11648/j.ajere.20240903.11
AB  - This study was conducted in Fantalle Range lands in East Shewa zone of, Oromia Region, Ethiopia, to assess land use land cover changes, trends, drivers and their socioeconomics. Household surveys were conducted through simple random sampling to collect qualitative data. Qualitative data are used to investigate the causes and effects of land use and land cover changes. SPSS software (version 20) was used for data analysis, and descriptive research methods were adopted. Additionally, map processing was done using ERDAS Imagine (version 9.1) and ArcGIS (version 10.1). The land use land cover classification activity was started by obtaining Landsat images of 1972, 1990, 2000 and 2020 at different intervals from the Earth Explorer (USGS) from the Landsat 4, Landsat 5, Landsat 7 and Landsat 8, respectively. Land use land cover change (LULCC) maps are generated based on year classification. Range land, agricultural land, woody vegetation, bare land and settlement are the five main LULCC categories generated from satellite data. The findings show that in the presence of LULCC, agricultural land, settlements and bare land expand significantly, while range land and woodland show a decreasing trend. The classification results of the 1972 image show that rangeland/grazing land accounts for the largest proportion of the land in this area, accounting for 31.6%. In addition, due to various factors, the number of livestock owned in pastoral areas is also decreasing. The main cause of changes in livestock types is drought, which can cause different impacts, such as feed and water shortages and health problems. Therefore, intervention in land use manipulation is needed to maintain ecosystems and natural resources. Furthermore, rangeland policies should be developed to maintain pastoral and pastoral systems.

VL  - 9
IS  - 3
ER  -
Animal Feed Resources and Rangeland Management, Oromia Agricultural Research Institute, Adami Tulu Agricultural Research Center, Adami Tullu, Ethiopa
Animal Feed Resources and Rangeland Management, Oromia Agricultural Research Institute, Adami Tulu Agricultural Research Center, Adami Tullu, Ethiopa
Information