The study assesses the carbon and energy footprints of the non-metallic (NM) and traditional metallic materials in building and construction applications through a Life Cycle Assessment in accordance of ISO 14067 and 14040/44. The goal of this assessment is to address the misconceptions surrounding non-metallic materials and provide a fact-based understanding of their environmental impact, specifically their carbon footprint. Moreover, this scientific assessment is performed to evaluate the feasibility of switching from conventional metallic products to non-metallics (polymers). The assessed products in this sector include rebars, sand movement controls, claddings, manholes, window frames, and walkways, which are found in the assessment for each product system’s metallic and non-metallic materials. The life cycle assessment of carbon and energy in this study includes the manufacturing, transportation, and end of life of each product in the listed products, while the use phase is assumed to be identical whether the product is metallic or non-metallic, except for sand movement control and walkways. The structure of this assessment starts with an introduction, followed by materials and methods which define all data and products assessed, and lastly a conclusion of the analysis. All in all, the study results show that non-metallic products are favorable with less carbon and energy footprint potential when compared to the corresponding metallic products in the building and construction sector.
| Published in | American Journal of Environmental Protection (Volume 14, Issue 2) |
| DOI | 10.11648/j.ajep.20251402.14 |
| Page(s) | 68-77 |
| Creative Commons |
This is an Open Access article, distributed under the terms of the Creative Commons Attribution 4.0 International License (http://creativecommons.org/licenses/by/4.0/), which permits unrestricted use, distribution and reproduction in any medium or format, provided the original work is properly cited. |
| Copyright |
Copyright © The Author(s), 2025. Published by Science Publishing Group |
Circular Economy, Life Cycle Assessment, Carbon Footprint, Climate Change, Non-Metallic Materials, Building and Construction Sector
Product System | Product Name | Material Used for Conventional and Non-conventional Product |
|---|---|---|
NM1 | Polymer for Sand Movement Control | Acrylic polymers |
CP1 | Mechanical sand removal | Wheel loaders |
NM2 | GFRP Rebar | Glass fiber reinforced polymers |
CP2 | Epoxy-coated steel (ECS) rebar | steel |
NM3 | FRP manhole | Fiber reinforced polymers |
CP3 | Concrete manhole | Concrete |
NM4 | U-PVC window frame | Polyvinyl chloride |
CP4 | Aluminum window frame | Aluminum |
NM5 | FRP walkway | Fiber reinforced polymers |
CP5 | Galvanized steel walkway | Steel |
NM6 | HPL Cladding | High pressure laminate |
CP6 | Aluminum Metal Cladding | Aluminum |
Product System NM1 | ||
|---|---|---|
Phase | NM1: Polymer for sand movement control | CP1: Mechanical sand removal |
Production | The manufacturing data of the polymer emulsion product are based on the available dataset in GaBi. Styrene butyl acrylate copolymer (50% solids) is selected as a suitable proxy. | Not included |
installation | To achieve the movement control of sand for 1 meter of highway road, an average surface of sand to be sprayed is 65 m2. During the application stage, an average transportation distance of concentrated synthetic polymer is assumed to be 700 km. The dilution and mixing of the product can be achieved by loading the concentrated polymer solution with water directly in the tanker, near the project site. The transportation distance for the tanker is a round trip taking into consideration the way back of the tankers with no load and therefore is assumed to be 100 km. The water used for the dilution is normally ground/brackish water pumped from desert bore holes. The spraying can be done either manually or via tanker with spraying container. In this study we only include the transportation of the polymer-water mixture to the project site via the tanker. | Not included |
Use phase | Synthetic polymer emulsion-treated sand deteriorates over time in terms of surface crust and uniformity, due to damages related to improper use (e.g. driving over the surface crust) or wind and other environmental factors. An average maintenance plan can be conducted after 3.5 years. During maintenance, the hard crust surface of the sand requires a reapplication of the polymer product to maintain its initial design quality. The maintenance operations are similar to what was done during the initial application stage. On average, 21% of the initial sand surface treated requires reapplication of the polymer solution. | As an average, 13 m3 of sand is accumulated annually per meter of highway road. The removal of sand requires the use of wheel loaders and dump trucks. The wheel loader diesel consumption data was based on the Volvo L150G Wheel loader [1] . The wheel loader consumes 0.16 liters of diesel per ton of sand removed. Once loaded, the dump truck will transport the sand to either side of the road. We assume an average distance of 10 meters. Both vehicles are assumed to remain on site (near the highway road) and would require regular fueling from nearby gas stations, using fuel tankers. We assume an average transport distance of 20 km between the project site and the gas station. The model includes the full round-trip distance of 40 km, taking into consideration the trip of the empty tanker back to the station. Besides the production of diesel, the model also includes the combustion of diesel during the maintenance operations. |
End of Life | According to a publication from the U.S Department of Agriculture, synthetic polymer emulsions used for soil stabilization in general not harmful to the environment based on the literature. Moreover, the polymer product used is not expected to emit GHG emissions during the degradation stage at EoL. The synthetic polymer product used to fix the sand surface layer is assumed to be left in situ. The EoL life cycle stage is therefore not included in this study. | Not included |
Product System NM2 | ||
|---|---|---|
Phase | NM1: GFRP Rebar | CP2: Epoxy-coated steel (ECS) rebar |
Production | GFRP rebars are manufactured through pultrusion of resin-impregnated bundles of fibers. The resin can either be vinyl ester or epoxy. The production of vinyl ester resin was estimated and modelled under a conservative approach. The below summarizes the input process data for 1 kg of Vinyl ester resins: 0.13 kg of Methacrylic acid 0.52 kg epoxy resin 0.35 kg styrene 3 MJ of thermal energy from natural gas 0.333 kWh of electricity | The material and energy requirement of the coating process are based on data from previous case study done by the international Zinc Association (IZA) comparing four different rebars used in a reinforced concrete bridge structure. The below summarizes the input for the manufacturing of 1,013 kg of the ECS rebar: 1000 kg of steel rebar 12.8 kg of epoxy resin 108 MJ of thermal energy from natural gas 110 kWh of electricity |
installation | Identical to the ECS rebar system product, the inbound transport of materials to the construction site is included in the assessment. We assume an average distance from a ready-mixed concrete plant to a construction site of 100 km. The distance for GFRP rebar transportation was also estimated to be 700 km from fabrication facility to construction site. The energy required to pump the concrete is accounted for within the model, while the laying of the rebar for the bridge construction requires only manual work force. Waste treatment of the packaging materials included in the production of the GFRP rebar was also included in the model. | The concrete mixture proportions are based on literature data from the construction of a flood mitigation channel (FMC) in the southwest Saudi Arabia. The recently published study included information on the concrete mix designs when ESC rebar as well as when opting for GFRP [ 8] |
Use phase | As GFRP rebars are corrosion resistant, so the maintenance life cycle stage is not considered. Other maintenance operations (e.g related to cracking of concrete) are assumed to be the same for both GFRP rebar and ECS rebar, and therefore are excluded for both product systems. | Concrete bridges deterioration can be caused by various deterioration mechanisms, such as corrosion. Therefore, the conditions of the bridge require regular inspections periodically to conduct maintenance operations. Due to the lack of information on this lifecycle stage, the maintenance plan of the bridge structure is assumed to require a one-time repair operation during the service life of the structure (35 years). Unpredictable minor repairs as well as sealants quantities were not included. The maintenance plan is assumed to be built around completing a partial depth overlay on 50% of the total surface of the deck. This overlay will be completed in three parts: 1. Hydro demolition of the upper layer of the concrete structure to 4 cm 2. Cleaning of rebar and surrounding concrete to remove present chloride ions to the greatest extent possible 3. Placement of a concrete overlay using the same mixture proportions as in the original construction. Hydro demolition, using high-pressure water, is used to break up and remove the top 4 cm of concrete and clean the rebar. The below shows the material and energy requirements per cubic meter of concrete (International Zinc Association, 2015): 1,188 MJ through diesel 101,524 L of water |
End of Life | At the EoL, the environmental impacts related to the deconstruction of the concrete structure and waste treatment is considered. According to the sector experts from the participating manufacturers, the GFRP rebar mixed with concrete can be crushed in stone size, to create new aggregate for reinforced concrete. GFRP and Concrete recycling assumes a 10% recycling. The remaining concrete is sent to landfill (Public Investment Fund, 2017). We assume a transportation distance of construction waste to either landfill or recycling rates to be 20km. The deconstruction material and energy requirements as well as the crushing of concrete are assumed to be the same as in the ECS reinforced structure model. Moreover, we assume that the energy requirements to crush the concrete mixed with GFRP rebar are similar to crushing the concrete alone. | The End-of-life cycle stage comprises the impacts associated with deconstruction of the bridge structure at the end of its service life and the disposal and recycling of the concrete and rebar. It is assumed that only 10% of this waste is recycled while the other 90% is disposed in landfills. In this study, steel recycling uses the value of scrap allocation approach and assumes an 85% recovery rate. The remaining rebar is sent to landfill. Concrete recycling assumes a 10% recycling as well. The remaining concrete is sent to landfill. For the epoxy coating used in the rebar manufacturing, the 10% of the waste is recycled in an incineration plan, including all energy credits generated. We assume a transportation distance of construction waste to either landfill or recycling rates to be 20km. The remaining waste is sent to landfill. Deconstruction operations require diesel for breaking the concrete and gasoline to cut the steel reinforcement [4] . Diesel is considered to fulfil all the energy requirements of the deconstruction. The recycled concrete is crushed into gravel with half coming from diesel fuel and half from electricity [4] . |
Product System NM3 | ||
|---|---|---|
Phase | NM3: FRP Manhole | CP3: Concrete Manhole |
Production | FRP manhole is manufactured from (Glass fiber- 60%, Polyester resin- 30% and Sand- 10%) using the Extrusion and Blow molding process. The information on the weight of the FRP manhole along with the concrete slab specification required during installation of the manhole has been taken from BMTPC [ 9]. The manufacturing phase has been developed using secondary data. | The on-site manufacturing and installation have been considered for concrete reinforced manhole based on the data from NCPA [ 11]. The information on the weight of the concrete reinforced manhole along with the fuels, electricity and concrete mix design have been taken from the above-mentioned source. The manufacturing phase has been developed using secondary data. |
Product System NM4 | ||
|---|---|---|
Phase | NM4: U-PVC window frame | CP4: Aluminum window frame |
Production | The manufacturing of the U-PVC window frame is developed using the GaBi LCI data. The information on the weight of the U-PVC window frame along with service life and EoL has been taken from literature. | The manufacturing of the aluminum window frame is developed using the GaBi LCI data. The information on the weight of the aluminum window frame along with service life and EoL has been taken from literature. |
End of Life | In the end-of-life phase, the collection and recovery rate have been considered as 95%. The recycling and the incineration rate of PVC material has been considered as 59% and 35% respectively and rest is landfilled. The recycling rate for the steel part is considered to be 92%, and net scarp approach has been applied, while the rest is landfilled. | |
Product System NM5 | ||
|---|---|---|
Phase | NM5: FRP Walkway | CP5: Galvanized steel walkway |
Production | Walkways are structural member made up of grating and handrail. The FRP composition for grating (Glass fiber- 62% and Isophthalic resin-38%) and handrail (Glass fiber- 56% and Isophthalic resin-44%) has been considered in the assessment. The GaBi extrusion process has been considered for the manufacturing of the FRP components. | The manufacturing of the galvanized steel grating and handrail are based on the GaBi datasets. The stamping & bending along with the cutting process have been considered for the electrogalvanized steel dataset to represent the steel grating manufacturing. The steel has been considered to represent the handrail part of the walkway. The information on the weight of the galvanized steel walkway has been derived from the same source used for the FRP walkaway. |
Use phase | Not included | Three coatings have been considered during its service life of 20 years. The waste generated due to material replacement in the maintenance phase is treated similar to Product’s EoL |
End of Life | After the products’ service life, the end-of-life is considered with options of treatments such as recycling, landfill, or incineration. For FRP product three scenarios (scenario: 1-100% landfill, scenario: 2- 100% re-cycling with cut off (no burden, no credit), scenario: 3-100% incineration) have been considered. For galvanized steel product three scenarios (scenario: 1-100% landfill, scenario: 2- 80% recycling & 20% landfill, scenario: 3- 50% recycling & 50% landfill) have been considered. | |
Product System NM6 | ||
|---|---|---|
Phase | NM6: HPL Cladding | CP6: Aluminum Metal Cladding |
Production | High pressure laminate cladding are applied as vertical exterior walls coverings such as cladding, balcony paneling as well as horizontal exterior ceiling applications. The manufacturing of the HPL cladding is developed using the GaBi LCI data. The information on the weight of the HPL cladding along with service life and EoL has been taken from literature. | Aluminum cladding are applied as exterior walls coverings. The composition of the aluminum metal cladding is “Rock wool: 58.9%; Aluminum cladding material: 27.6%; Bitumen: 8.4%; Steel: 1.9%; Zinc: 1.8% and Polyamide: 1.4%” in which the major impact is being contributed from aluminum cladding material. The manufacturing of the aluminum cladding material is developed using the GaBi LCI data. The information on the weight of the aluminum cladding along with service life and EoL has been taken from a published literature. |
End of Life | After the products’ service life, the end-of-life is considered with options of treatments such as recycling, landfill and incineration. For HPL cladding three scenarios (scenario: 1-100% landfill, scenario: 2- 100% recycling with carbon correction, scenario: 3-100% incineration have been considered. In End of life for recycling of HPL the energy for shredding is considered as 0.0041 kwh/kg of wood and the credit has been taken with spruce log wood. For aluminium cladding product recycling has been considered for aluminium and steel. The rockwool and rest of the aluminium after recycling have been considered for landfill. | |
EoL | End of Life |
HPL | High Pressure Laminate Cladding |
PED | Primery Energy Demand |
GWP | Global Warming Potential |
FRP | Fiber Reinforced Polymers |
GFRP | Glass Fiber Reinforced Polymers |
U-PVC | Unplasticized Polyvinyl Chloride |
ECS | Epoxy-Coated Steel |
IZA | International Zinc Association |
FMC | Flood Mitigation Channel |
MJ | Megajoules |
GHG | Green House Gases |
NM | Non-Metallic |
CP | Conventional Product |
LCA | Life Cycle Assessment |
| [1] | Salman, Chen (2013) “Comparative Environmental Analysis of Conventional and Hybrid Wheel Loader Technologies: A Life Cycle Perspective” retrieved from Comparative Environmental Analysis of Conventional and Hybrid Wheel Loader Technologies: A Life Cycle Perspective (diva-portal.org). |
| [2] | Morsali, Isıldar, & Hamed, 2020. “A comparison LCA of the common steel rebars and FRP” Retrieved from A comparison LCA of the common steel rebars and FRP | Request PDF (researchgate.net). |
| [3] | GFRP Rebar Shows Promise for Use in Bridge Decks. Retrieved from GFRP | Crossroads (mntransportationresearch.org). |
| [4] | International Zinc Association. (2015). Life Cycle Assessment & Life Cycle Cost Analysis of a Reinforced Concrete Bridge Deck. A case study comparing conventional, epoxy-coated, continuously galvanized, and stainless steel rebar. International Zinc Association. |
| [5] | ISO. (2018). ISO 14067: Carbon footprint of products – Requirements and guidelines for quantification. Brussels: International Organization for Standardization. |
| [6] | ISO. (2006). ISO 14044: Environmental management – Life cycle assessment – Requirements and guidelines. Geneva: International Organization for Standardization. |
| [7] | Sphera Solutions Inc. (2021). GaBi LCA Database Documentation. Retrieved from GaBi Solutions: |
| [8] | Salan, E. A., Rahman, M. K., Al-Ghamdi, S., Sakr, J., Al-Zahrani, M. M., & Nanni, A. (2021). A Monumental Flood Mitigation Channel in Saudi Arabia. Concrete International. |
| [9] | BTMC: 20 FRP Manhole. Retrieved from |
| [10] |
CROSSROADS. (2020). Retrieved from
https://mntransportationresearch.org/2020/05/13/gfrp-rebar-shows-promise-for-use-in-bridge-decks/ |
| [11] |
NCPA (2010). Retreived from
http://precast.org/wp-content/uploads/docs/LCA_Belowground_Infrastructure_Complete_Re-port_2010.pdf |
APA Style
Alhabib, H. F., Duaiji, A. A., Dossari, S. F. (2025). LCA Study: Carbon and Energy Footprint Assessment of Non-Metallic Materials Against Traditional Metallic Materials in Building and Construction Sector. American Journal of Environmental Protection, 14(2), 68-77. https://doi.org/10.11648/j.ajep.20251402.14
ACS Style
Alhabib, H. F.; Duaiji, A. A.; Dossari, S. F. LCA Study: Carbon and Energy Footprint Assessment of Non-Metallic Materials Against Traditional Metallic Materials in Building and Construction Sector. Am. J. Environ. Prot. 2025, 14(2), 68-77. doi: 10.11648/j.ajep.20251402.14
@article{10.11648/j.ajep.20251402.14,
  author = {Hussain Fathi Alhabib and Abdullah Abdulaziz Duaiji and Salman Faleh Dossari},
  title = {LCA Study: Carbon and Energy Footprint Assessment of Non-Metallic Materials Against Traditional Metallic Materials in Building and Construction Sector
},
  journal = {American Journal of Environmental Protection},
  volume = {14},
  number = {2},
  pages = {68-77},
  doi = {10.11648/j.ajep.20251402.14},
  url = {https://doi.org/10.11648/j.ajep.20251402.14},
  eprint = {https://article.sciencepublishinggroup.com/pdf/10.11648.j.ajep.20251402.14},
  abstract = {The study assesses the carbon and energy footprints of the non-metallic (NM) and traditional metallic materials in building and construction applications through a Life Cycle Assessment in accordance of ISO 14067 and 14040/44. The goal of this assessment is to address the misconceptions surrounding non-metallic materials and provide a fact-based understanding of their environmental impact, specifically their carbon footprint. Moreover, this scientific assessment is performed to evaluate the feasibility of switching from conventional metallic products to non-metallics (polymers). The assessed products in this sector include rebars, sand movement controls, claddings, manholes, window frames, and walkways, which are found in the assessment for each product system’s metallic and non-metallic materials. The life cycle assessment of carbon and energy in this study includes the manufacturing, transportation, and end of life of each product in the listed products, while the use phase is assumed to be identical whether the product is metallic or non-metallic, except for sand movement control and walkways. The structure of this assessment starts with an introduction, followed by materials and methods which define all data and products assessed, and lastly a conclusion of the analysis. All in all, the study results show that non-metallic products are favorable with less carbon and energy footprint potential when compared to the corresponding metallic products in the building and construction sector.
},
 year = {2025}
}
TY  - JOUR
T1  - LCA Study: Carbon and Energy Footprint Assessment of Non-Metallic Materials Against Traditional Metallic Materials in Building and Construction Sector

AU  - Hussain Fathi Alhabib
AU  - Abdullah Abdulaziz Duaiji
AU  - Salman Faleh Dossari
Y1  - 2025/04/22
PY  - 2025
N1  - https://doi.org/10.11648/j.ajep.20251402.14
DO  - 10.11648/j.ajep.20251402.14
T2  - American Journal of Environmental Protection
JF  - American Journal of Environmental Protection
JO  - American Journal of Environmental Protection
SP  - 68
EP  - 77
PB  - Science Publishing Group
SN  - 2328-5699
UR  - https://doi.org/10.11648/j.ajep.20251402.14
AB  - The study assesses the carbon and energy footprints of the non-metallic (NM) and traditional metallic materials in building and construction applications through a Life Cycle Assessment in accordance of ISO 14067 and 14040/44. The goal of this assessment is to address the misconceptions surrounding non-metallic materials and provide a fact-based understanding of their environmental impact, specifically their carbon footprint. Moreover, this scientific assessment is performed to evaluate the feasibility of switching from conventional metallic products to non-metallics (polymers). The assessed products in this sector include rebars, sand movement controls, claddings, manholes, window frames, and walkways, which are found in the assessment for each product system’s metallic and non-metallic materials. The life cycle assessment of carbon and energy in this study includes the manufacturing, transportation, and end of life of each product in the listed products, while the use phase is assumed to be identical whether the product is metallic or non-metallic, except for sand movement control and walkways. The structure of this assessment starts with an introduction, followed by materials and methods which define all data and products assessed, and lastly a conclusion of the analysis. All in all, the study results show that non-metallic products are favorable with less carbon and energy footprint potential when compared to the corresponding metallic products in the building and construction sector.

VL  - 14
IS  - 2
ER  -
Environmental Protection Department, Saudi Aramco, Dhahran, Saudi Arabia
Environmental Protection Department, Saudi Aramco, Dhahran, Saudi Arabia
Environmental Protection Department, Saudi Aramco, Dhahran, Saudi Arabia
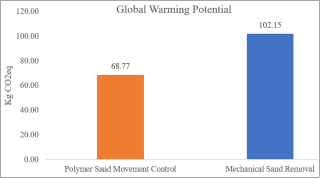
Figure 1. GWP results of NM1.
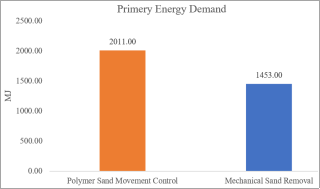
Figure 2. PED results of NM1.
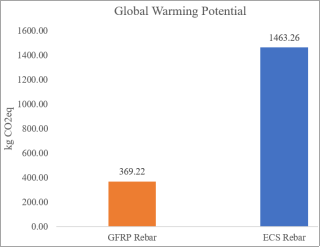
Figure 3. GWP results of NM2.
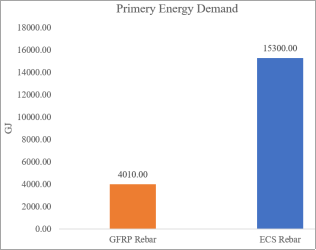
Figure 4. PED results of NM2.
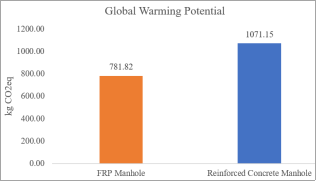
Figure 5. GWP results of NM3.
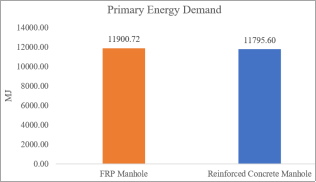
Figure 6. PED results of NM3.
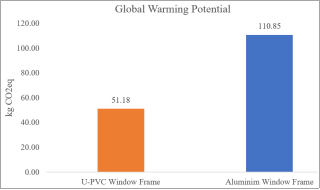
Figure 7. GWP results of NM4.
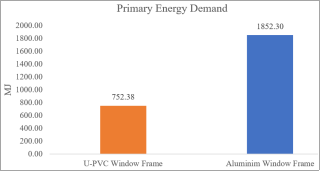
Figure 8. PED results of NM4.
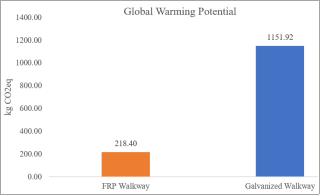
Figure 9. GWP results of NM5.
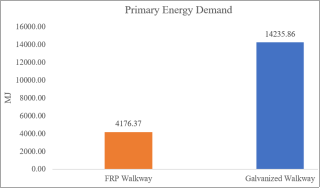
Figure 10. PED results of NM5.
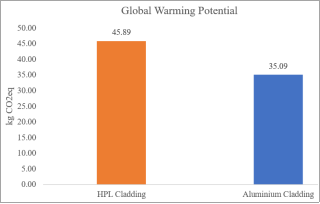
Figure 11. GWP results of NM6.
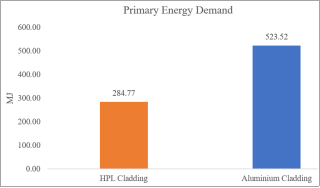
Figure 12. PED results of NM6.
Information

