Nowadays, one of the major problems facing large cities is the adaptation of energy needs with their rapid demographic growth. In most cases, there is a disconnect between the rapid demographic increases and the updating of energy needs. The major cities of the Republic of Guinea are confronted to a significant challenge due to insufficient energy supply for their sustainable development, and the urban commune of N’zérékoré is a clear example of this. The city is experiencing substantial rapid demographic growth, which requires a long-term assessment of its energy needs for its sustainable development. In this paper, a model for projecting energy demand over 10 years for the urban commune of N'zérékoré taking into account its demographic evolution was developed. An estimate of energy needs was made based on the projected population growth from 2024 to 2060. The results show that the urban commune's current energy consumption is estimated at 53.89 MW, or 38.8 GWh per month, while the projected energy demand for the same year amounts to 51.6 GWh. Population growth continuously drives a strong increase in energy demand, if production remains unchanged, by 2060 the commune’s energy need would reach 1,595.16 GWh, resulting in a deficit of 1,543.56 GWh.
| Published in | American Journal of Energy Engineering (Volume 12, Issue 4) |
| DOI | 10.11648/j.ajee.20241204.13 |
| Page(s) | 103-113 |
| Creative Commons |
This is an Open Access article, distributed under the terms of the Creative Commons Attribution 4.0 International License (http://creativecommons.org/licenses/by/4.0/), which permits unrestricted use, distribution and reproduction in any medium or format, provided the original work is properly cited. |
| Copyright |
Copyright © The Author(s), 2024. Published by Science Publishing Group |
Republic of Guinea, N’zérékoré, Prevision, Energy Demand, Population
Year | population |
|---|---|
2015 | 202 725 |
2016 | 202727 |
2017 | 214560 |
2018 | 220 659 |
2019 | 226 876 |
2020 | 233 213 |
2021 | 239 670 |
2023 | 252947 |
2024 | 259 769 |
No | Semi-industrial consumers | Quantity |
|---|---|---|
1 | Welding | 140 |
2 | Carpentry | 200 |
3 | Pressing | 10 |
No | Tertiary consumers | Number |
|---|---|---|
1 | Shops | |
2 | Health establishment | 30 |
3 | Schools | 120 |
4 | Universities and higher institutes | 3 |
5 | Hotels with Restaurants | 10 |
6 | Restaurants | 30 |
7 | Social centers | 1 |
8 | Markets | 10 |
9 | Stadiums | 3 |
10 | Churchs | 28 |
11 | Mosques | 70 |
Post | Feeder | Pf | Pc |
|
|---|---|---|---|---|
Depature 1 | Ossud | 40 | 7 | 17.5 |
Departure 2 | GouvernoraZao-Lola | 40 | 7 | 17.5 |
Departure 3 | 40 | 7 | 17.5 |
Device | Pa (W) | Nbr | Ku | Tu (h) | Pi (ti) Kwh | Tp | Pi (MW) |
|---|---|---|---|---|---|---|---|
Heating | 1000 | 1 | 1 | 1 | 1,00 | 56 | 27 |
Freezer | 250 | 1 | 1 | 24 | 6,00 | 78,9 | 224 |
Ironing board | 1300 | 1 | 1 | 1 | 1,30 | 96 | 59 |
hair dryer | 1600 | 1 | 1 | 0,5 | 0,80 | 175 | 7 |
Water kettle | 1500 | 1 | 1 | 0,5 | 0,75 | 56 | 20 |
Fan | 60 | 1 | 1 | 3 | 0,18 | 36 | 3 |
Computers | 45 | 2 | 1 | 3 | 0,27 | 88 | 11 |
Television | 110 | 1 | 1 | 16 | 1,76 | 95 | 79 |
Water fountain | 1000 | 1 | 1 | 5 | 0,5 | 43 | 10 |
Air conditioner | 5000 | 2 | 1 | 2 | 20,00 | 53 | 50 |
Chargers | 5 | 6 | 1 | 2 | 0,06 | 100 | 3 |
Energy saving lamp | 12 | 6 | 1 | 24 | 1,73 | 80 | 66 |
Incandescent lamp | 100 | 4 | 1 | 24 | 9,60 | 49,1 | 223 |
Electric hob | 1500 | 1 | 1 | 4 | 6,00 | 68,4 | 194 |
Total household | 49,9 | Total | 976 | ||||
Devise | Pa (W) | Nber | Tu (h) | Ku | Pi (ti) Kwh | School Nber | Pi Mwh |
|---|---|---|---|---|---|---|---|
Tube | 40 | 205 | 18 | 1 | 147,6 | 359 | |
Computer | 80 | 35 | 3 | 1 | 8,40 | ||
Photocopier | 200 | 5 | 1 | 1 | 1 | ||
Printer | 200 | 6 | 1 | 1 | 1,2 | ||
Projector | 1000 | 10 | 24 | 1 | 240 | ||
Total school | 398,2 | Total | 142,95 | ||||
Device | Pa (W) | Nbre | Tu (h) | Ku | Pi (ti) Kwh | Mosque Number | Pi Mwh |
|---|---|---|---|---|---|---|---|
Tube | 40 | 100 | 24 | 1 | 96 | 400 | |
Micro | 20 | 15 | 7 | 1 | 2,1 | ||
Mixer | 1200 | 2 | 7 | 1 | 16,8 | ||
Amplifier | 1500 | 2 | 7 | 1 | 21 | ||
affle | 1000 | 5 | 7 | 1 | 35 | ||
Fan | 60 | 24 | 7 | 1 | 10,08 | ||
Total Mosque | 180,98 | Total | 72, 392 | ||||
Device | Pa (W) | Nombre | Tu (h) | Ku | Pi (ti) Kwh | Carpentry Number | Pi Mwh |
|---|---|---|---|---|---|---|---|
Jig saw | 2300 | 2 | 8 | O, 6 | 22,08 | 30 | |
Circular saw | 750 | 2 | 8 | 0,6 | 7,20 | ||
Spinning top | 7000 | 2 | 7 | 0,75 | 73,5 | ||
Band saw | 11000 | 1 | 1 | 1 | 11,0 | ||
Hand drill | 700 | 3 | 2 | 0,6 | 2,52 | ||
Angle grinder | 2000 | 2 | 4 | 0,75 | 12,0 | ||
Total carpentry shop | 128,3 | Total | 3, 849 | ||||
Urban commune of N’zérékoré | ||
|---|---|---|
Consumer | ENTITE | P/month (GWh) |
Residual | Households | 29,29 |
Tertiary | Schools | 3,83 |
Mosques | 2,76 | |
Shops | 8,63 | |
Hotels | 1,25 | |
Restaurants | 0,9 | |
Semi-industria | Carpentry | 0,07 |
Pressing | 0,11 | |
Welding Equipment | 0,07 | |
Sector sum | 46,91 | |
Correction factor of 10 % | 4,69 | |
Total of the estimated consumption | 51,6 | |
t | Year | Pt |
|---|---|---|
0 | 2024 | 259 769 |
1 | 2025 | 265473,4 |
2 | 2026 | 271 177,8 |
3 | 2027 | 276 882,2 |
4 | 2028 | 282 586,6 |
5 | 2029 | 288 291 |
6 | 2030 | 293 995,4 |
7 | 2031 | 299 699,8 |
8 | 2032 | 305 404,2 |
9 | 2033 | 311 108,6 |
10 | 2034 | 316 813 |
11 | 2035 | 322 517,4 |
12 | 2036 | 328 217 |
13 | 2037 | 333 926,2 |
14 | 2038 | 339 630,6 |
15 | 2039 | 345 335 |
16 | 2040 | 351 039,4 |
17 | 2041 | 356 743,8 |
18 | 2042 | 362 448,2 |
19 | 2043 | 368 152,6 |
20 | 2044 | 373 857 |
21 | 2045 | 379 561,4 |
22 | 2046 | 385 265,8 |
23 | 2047 | 390 970,2 |
24 | 2048 | 396 674,6 |
25 | 2049 | 402 379 |
26 | 2050 | 408 083,4 |
27 | 2051 | 413 787,8 |
28 | 2052 | 419 492,2 |
29 | 2053 | 425 196,6 |
30 | 2054 | 430 901 |
31 | 2055 | 436 605,4 |
32 | 2056 | 442 309,8 |
33 | 2057 | 448 014,2 |
34 | 2058 | 453 718,6 |
35 | 2059 | 459 423 |
36 | 2060 | 465 127,4 |
N | Mn | Pn (GWh) | Cn (GWh) | Sum (GWh) |
|---|---|---|---|---|
2024 | 51 954 | 29,29 | 22,31 | 51,6 |
2025 | 53 094,68 | 32,219 | 24,541 | 56,76 |
2026 | 54 235,56 | 35,44 | 26,9951 | 62,4351 |
2027 | 55 376,44 | 38,985 | 29,6946 | 68,6796 |
2028 | 56 517,32 | 42,88 | 32,6641 | 75,5441 |
2029 | 57 658,2 | 47,172 | 35,93051 | 83,10251 |
2030 | 58 799,08 | 51,8892 | 39,52351 | 91,41271 |
2031 | 59 939,96 | 57,07812 | 43,47551 | 100,55363 |
2032 | 61080,84 | 62,78612 | 47,82351 | 110,60963 |
2033 | 62221,72 | 69,06512 | 52,60551 | 121,67063 |
2034 | 63362,6 | 75,97212 | 57,86651 | 133,83863 |
2035 | 64503,48 | 83,56912 | 63,65351 | 147,22263 |
2036 | 65643,4 | 91,92612 | 70,01851 | 161,94463 |
2037 | 66785,24 | 101,11912 | 77,02051 | 178,13963 |
2038 | 67926,12 | 111,23112 | 84,72251 | 195,95363 |
2039 | 69067 | 122,35412 | 93,19451 | 215,54863 |
2040 | 70 207,88 | 134,59412 | 102,51351 | 237,10763 |
2041 | 71 348,76 | 148,05412 | 112,76451 | 260,81863 |
2042 | 72 489,64 | 162,85912 | 124,04051 | 286,89963 |
2043 | 73 630,52 | 179,14512 | 136,44451 | 315,58963 |
2044 | 74 771,4 | 197,06012 | 150,08851 | 347,14863 |
2045 | 75 912,28 | 216,76612 | 165,09751 | 381,86363 |
2046 | 77 053,16 | 238,44612 | 181,60731 | 420,05343 |
2047 | 78 194,04 | 262,2861 | 199,76831 | 462,05441 |
2048 | 79 334,92 | 288,51612 | 219,74531 | 508,26143 |
2049 | 80 475,8 | 317,36612 | 241,72031 | 559,08643 |
2050 | 81 616,68 | 349,10612 | 265,89231 | 614,99843 |
2051 | 82 757,56 | 384,01712 | 292,48131 | 676,49843 |
2052 | 83 898,44 | 422,41912 | 321,72931 | 744,14843 |
2053 | 85 039,32 | 464,66112 | 353,90231 | 818,56343 |
2054 | 86 180,2 | 511,13112 | 389,29231 | 900,42343 |
2055 | 87 321,08 | 562,24412 | 428,22231 | 990,46643 |
2056 | 88 461,96 | 618,46812 | 471,04431 | 1 089,51243 |
2057 | 89 602,84 | 680,31812 | 518,14831 | 1 198,46643 |
2058 | 90 743,72 | 748,34992 | 569,96331 | 1 318,31323 |
2059 | 91 884,6 | 823,14812 | 626,95931 | 1 450,10743 |
2060 | 93 025,48 | 905,50 | 689,65531 | 1 595,15843 |
HTB | High Voltage Category B |
HTA | High Voltage Category A |
Pf, | Power Supplied by the Transformer |
∆ | Power Distribution Rate in the Commune |
Pc | Power Consumed by the Commune with |
Pj | The Tip on the Feeder |
Ku | Usage Coefficient |
Tu | Usage Time |
Tp | Device Ownership Rate Per Household |
Pa, | Power of Device |
Pi (ti) | The Energy Consumed Per Unit of Time |
Pi | The Projected Population |
Pt, | The Starting Population |
Po, | Initial Population (Base Period) |
, | Number of Years in the Base Period |
y, | Number of Projection Years (Between Start Year and End Year of Projection) |
t, | Number of Households in Year n |
Mn | The Residual Sector Consumption in Year n |
Cn | Semi-industrial consumption in year |
Pn | Tertiary consumption in year n |
| [1] | Dawit Habtu Gebremeskel, Erik O. Ahlgren, Getachew Bekele Beyene. Long-term evolution of energy and electricity demand forecasting: The case of Ethiopia, Energy Strategy Reviews, Volume 36, 2021. |
| [2] | Gajdzik, B.; Jaciow, M.; Wolniak, R.; Wolny, R.; Grebski, W. W. Assessment of Energy and Heat Consumption Trends and Forecasting in the Small Consumer Sector in Poland Based on Historical Data. Resources 2023, 12, 111. |
| [3] | Piao, X.; Managi, S. Household energy-saving behavior, its consumption, and life satisfaction in 37 countries. Sci. Rep. 2023, 13, 1382. |
| [4] | Kumar, P.; Caggiano, H.; Shwom, R.; Felder, F. A.; Andrews, C. J. Saving from home! How income, efficiency, and curtailment behaviors shape energy consumption dynamics in US households? Energy 2023, 271, 126988. |
| [5] | Su, S.; Ding, Y.; Li, G.; Skitmore, M.; Menadue, V. Temporal dynamic assessment of household energy consumption and carbon emissions in China: From the perspective of occupants. Sustain. Prod. Consum. 2023, 37, 142–155. |
| [6] | Adams, A.; Jumpah, E. T.; Dramani, H. S. Dynamics of Clean and Sustainable Households’ Energy Technologies in Developing Countries: The Case of Improved Cookstoves in Ghana. Sustain. Futures 2023, 5, 100108. |
| [7] | Tete, K. H. S.; Soro, Y. M.; Sidibé, S. S.; Jones, R. V. Urban domestic electricity consumption in relation to households’ lifestyles and energy behaviours in Burkina Faso: Findings from a large-scale, city-wide household survey. Energy Build. 2023, 285, 112914. |
| [8] | Tartibu, L. K., Kabengele, K. T., 2020. Forecasting Net Energy Consumption of South Africa using Artificial Neural Network. Univertcity of Johannesburg. |
| [9] | Comunal, B., 2024. Rapport annuel de l'exercice 2024, administration du territoire, commune Urbaine de NZerekore, inedit. |
| [10] | Communal, B., 2024. Administrastration du territoire, commune Urbaine de NZerekore, exercice 2024, inedit, 2024. |
| [11] | Audrey, H., Sinqui, M., Boudesocque, C., 2011. Prospectives d’évolution de la consommation électrique domestique à l’horizon 2030,» INP Toulouse, Toulouse. Prospectives d’évolution de la consommation électrique domestique à l’horizon 2030. |
| [12] | Barbier, T., 2017. Modelisación de la consommation électrique à partir de grandes masses de données pour la simulation des alternatives énrgetiques du futur. En enerrgie électrique, France. |
| [13] | Pelletir, F., and Sporenberg, T., 2016. Aperçu sur les methodes de projection, Dakar. Atelier régional sur les projections de population, Division de la Population, DESA, Nations Unies. |
| [14] | A. V. Varganova, A. S. Irihov and A. N. Shemetov, "External Power Supply Reliability Assessment to Consumers of 6-10 kV of the Substations of 35 kV and Higher," 2020 International Ural Conference on Electrical Power Engineering (UralCon), Chelyabinsk, Russia, 2020, pp. 57-62, |
APA Style
Sangaré, M., Keita, O., Rafi, M., Camara, Y. (2024). Energy Needs and Trends Assessment for the Urban Commune of N’zérékoré, Republic of Guinea. American Journal of Energy Engineering, 12(4), 103-113. https://doi.org/10.11648/j.ajee.20241204.13
ACS Style
Sangaré, M.; Keita, O.; Rafi, M.; Camara, Y. Energy Needs and Trends Assessment for the Urban Commune of N’zérékoré, Republic of Guinea. Am. J. Energy Eng. 2024, 12(4), 103-113. doi: 10.11648/j.ajee.20241204.13
AMA Style
Sangaré M, Keita O, Rafi M, Camara Y. Energy Needs and Trends Assessment for the Urban Commune of N’zérékoré, Republic of Guinea. Am J Energy Eng. 2024;12(4):103-113. doi: 10.11648/j.ajee.20241204.13
@article{10.11648/j.ajee.20241204.13,
  author = {Mamady Sangaré and Oumar Keita and Mohamed Rafi and Yacouba Camara},
  title = {Energy Needs and Trends Assessment for the Urban Commune of N’zérékoré, Republic of Guinea
},
  journal = {American Journal of Energy Engineering},
  volume = {12},
  number = {4},
  pages = {103-113},
  doi = {10.11648/j.ajee.20241204.13},
  url = {https://doi.org/10.11648/j.ajee.20241204.13},
  eprint = {https://article.sciencepublishinggroup.com/pdf/10.11648.j.ajee.20241204.13},
  abstract = {Nowadays, one of the major problems facing large cities is the adaptation of energy needs with their rapid demographic growth. In most cases, there is a disconnect between the rapid demographic increases and the updating of energy needs. The major cities of the Republic of Guinea are confronted to a significant challenge due to insufficient energy supply for their sustainable development, and the urban commune of N’zérékoré is a clear example of this. The city is experiencing substantial rapid demographic growth, which requires a long-term assessment of its energy needs for its sustainable development. In this paper, a model for projecting energy demand over 10 years for the urban commune of N'zérékoré taking into account its demographic evolution was developed. An estimate of energy needs was made based on the projected population growth from 2024 to 2060. The results show that the urban commune's current energy consumption is estimated at 53.89 MW, or 38.8 GWh per month, while the projected energy demand for the same year amounts to 51.6 GWh. Population growth continuously drives a strong increase in energy demand, if production remains unchanged, by 2060 the commune’s energy need would reach 1,595.16 GWh, resulting in a deficit of 1,543.56 GWh.
},
 year = {2024}
}
TY  - JOUR
T1  - Energy Needs and Trends Assessment for the Urban Commune of N’zérékoré, Republic of Guinea

AU  - Mamady Sangaré
AU  - Oumar Keita
AU  - Mohamed Rafi
AU  - Yacouba Camara
Y1  - 2024/11/29
PY  - 2024
N1  - https://doi.org/10.11648/j.ajee.20241204.13
DO  - 10.11648/j.ajee.20241204.13
T2  - American Journal of Energy Engineering
JF  - American Journal of Energy Engineering
JO  - American Journal of Energy Engineering
SP  - 103
EP  - 113
PB  - Science Publishing Group
SN  - 2329-163X
UR  - https://doi.org/10.11648/j.ajee.20241204.13
AB  - Nowadays, one of the major problems facing large cities is the adaptation of energy needs with their rapid demographic growth. In most cases, there is a disconnect between the rapid demographic increases and the updating of energy needs. The major cities of the Republic of Guinea are confronted to a significant challenge due to insufficient energy supply for their sustainable development, and the urban commune of N’zérékoré is a clear example of this. The city is experiencing substantial rapid demographic growth, which requires a long-term assessment of its energy needs for its sustainable development. In this paper, a model for projecting energy demand over 10 years for the urban commune of N'zérékoré taking into account its demographic evolution was developed. An estimate of energy needs was made based on the projected population growth from 2024 to 2060. The results show that the urban commune's current energy consumption is estimated at 53.89 MW, or 38.8 GWh per month, while the projected energy demand for the same year amounts to 51.6 GWh. Population growth continuously drives a strong increase in energy demand, if production remains unchanged, by 2060 the commune’s energy need would reach 1,595.16 GWh, resulting in a deficit of 1,543.56 GWh.

VL  - 12
IS  - 4
ER  -
Department of Physics, University of Nzerekore, Nzerekore, Guinea
Department of Hydrology, University of Nzerekore, Nzerekore,, Guinea
Industrial Engineering Laboratory, Mohammed VI International Academy of Civil Aviation, Casablanca, Morocco
Department of Energy, Higher Institute Technology Mamou, Mamou, Guinea
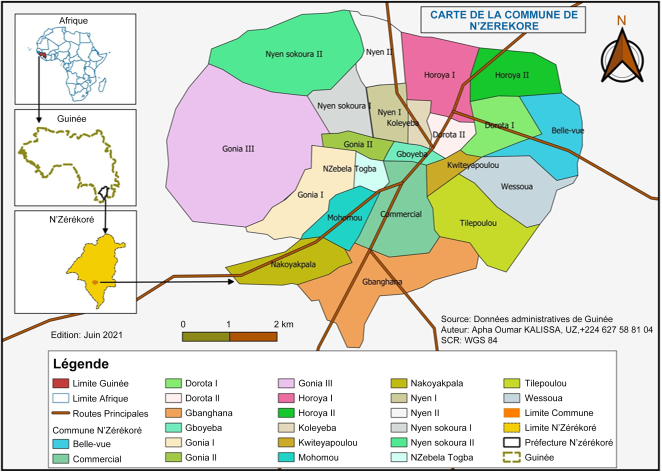
Figure 1. Map of the urban commune of N’Zerekore.

Figure 2. Projected population calculation graph.
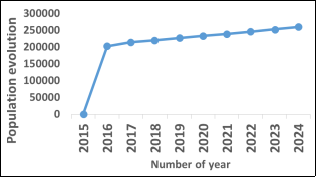
Figure 3. Population evolution of the urban commune of N’zérékoré over the last ten years.
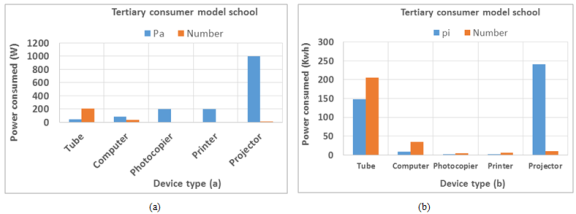
Figure 4. Energy consumption by device for tertiary consumer model: a) apparent power, b) intern power.

Figure 5. Energy consumption by device for semi-industrial consumer model: a) apparent power, b) intern power.
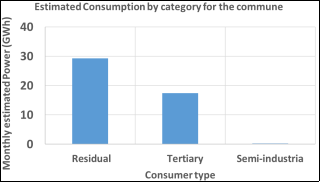
Figure 6. Estimated electricity consumer category for the urban commune of Nzérékoré.

Figure 7. Number of household’s evolution from 2024 to 2060 in the urban commune of N’zérékoré.
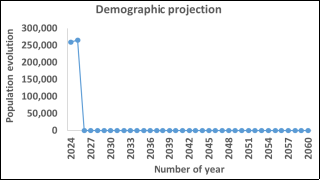
Figure 8. Demographic projection of the urban commune of NZerekore from 2024 to 2060.
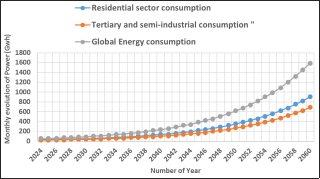
Figure 9. Energy consumption projection of the urban commune of NZérékoré from 2024 to 2060.
Information

