1. Introduction
Retaining walls is one of the most essential structural component in civil engineering practice, designed to resist lateral earth pressures and maintain soil stability in areas with elevation differences
| [1] | H. Imran, D. Al-Jeznawi, M. A. Q. Al-Janabi, and L. F. A. Bernardo, “Assessment of Soil–Structure Interaction Approaches in Mechanically Stabilized Earth Retaining Walls: A Review,” CivilEng, vol. 4, no. 3, pp. 982–999, Sep. 2023,
https://doi.org/10.3390/civileng4030053 |
[1]
. They are widely used in highways, bridge abutments, urban infrastructure, basements, hillside developments, and embankments where ground slopes exceed safe natural angles. The primary function of a retaining wall is to prevent soil mass failure due to lateral pressure, surcharge loads, water pressure, and seismic forces. Structurally, retaining walls must satisfy stability criteria against overturning, sliding, and bearing failure while also maintaining acceptable limits of deformation. Reinforced concrete (RC) is the most commonly adopted material due to its durability, compressive strength, adaptability in shaping, and long-term resistance to environmental effects
. The structural behavior of Reinforced concrete (RC) retaining walls depends on the interaction between the wall, foundation soil, and backfill material. The performance of these walls is therefore not only governed by structural design principles but also by geotechnical parameters such as soil type, angle of internal friction, cohesion, and bearing capacity.
The design of retaining walls traditionally relies on classical earth pressure theories such as Rankine and Coulomb, which assume simplified pressure distributions and ideal soil behavior
| [3] | P. Yu, K. Wu, D. Li, and Y. Liu, “Passive Earth Pressure and Soil Arch Shape: A Two-Dimensional Analysis,” Applied Sciences, vol. 15, no. 11, p. 6345, Jun. 2025,
https://doi.org/10.3390/app15116345 |
[3]
. These conventional approaches consider active, passive, and at-rest earth pressures acting horizontally on the wall surface. However, real-world soil–structure interaction is more complex, involving nonlinear stress redistribution, foundation deformation, and interface friction. Simplified assumptions may underestimate or overestimate actual stresses and displacements, particularly in cases of high surcharge loads or poor foundation soils. To improve stability, many construction practices incorporate shear keys beneath the base slab of retaining walls
. A shear key is a vertical projection provided below the footing to increase resistance against sliding by mobilizing passive earth pressure in the soil beneath the toe or heel. The presence of shear keys enhances the mechanical interlocking between the wall foundation and surrounding soil, thereby increasing sliding resistance and reducing excessive lateral displacement
| [5] | A. K. Pour, A. Shirkhani, and E. Noroozinejad Farsangi, “Comprehensive Evaluation of Sliding and Overturning Failure in Mechanically Stabilized Earth (MSE) Retaining Walls Considering the Effect of Hydrostatic Pressure,” GeoHazards, vol. 6, no. 3, p. 35, Jul. 2025,
https://doi.org/10.3390/geohazards6030035 |
[5]
. When shear keys are introduced, the stress distribution along the base slab changes significantly, affecting bending moments, shear forces, and axial stresses within the structure.
The structural performance of retaining walls is highly influenced by the position and dimensions of the shear key
| [6] | S. A. Khan, M. Karray, and P. Paultre, “Seismic Behavior of Retaining Walls: A Critical Review of Experimental and Numerical Findings,” Geotechnics, vol. 5, no. 2, p. 25, Apr. 2025, https://doi.org/10.3390/geotechnics5020025 |
[6]
. Shear keys may be placed near the toe, at the centre, or near the heel of the base slab, and each location alters the load transfer mechanism differently. When positioned near the toe, the shear key primarily increases passive resistance at the front, effectively reducing sliding displacement but potentially increasing bending moments at the stem–base junction
| [7] | K. Inoue, K. Suita, I. Takeuchi, P. Chusilp, M. Nakashima, and F. Zhou, “Seismic-Resistant Weld-Free Steel Frame Buildings with Mechanical Joints and Hysteretic Dampers,” J. Struct. Eng., vol. 132, no. 6, pp. 864–872, Jun. 2006,
https://doi.org/10.1061/(ASCE)0733-9445(2006)132:6(864) |
[7]
. Placement near the heel may improve overall moment equilibrium but could result in differential stress concentrations beneath the footing. A centrally located shear key tends to provide balanced resistance but may not fully mobilize passive pressure zones effectively. The location of the shear key affects the distribution of base reactions, shear force patterns along the stem, and the bending moment diagram within the wall system
| [8] | K. Khy, C. Chintanapakdee, P. Warnitchai, and A. C. Wijeyewickrema, “Modified response spectrum analysis to compute shear force in tall RC shear wall buildings,” Engineering Structures, vol. 180, pp. 295–309, Feb. 2019,
https://doi.org/10.1016/j.engstruct.2018.11.022 |
[8]
. Additionally, the size and depth of the shear key influence the magnitude of passive resistance developed. Therefore, determining the optimal shear key position is crucial for achieving structural safety, serviceability, and cost efficiency. Despite its practical importance, limited research has systematically examined the comparative behavior of retaining walls with shear keys placed at different positions.
The
Figure 1 address this gap, advanced computational tools such as the Finite Element Method (FEM) have become increasingly valuable. Unlike classical analytical methods, FEM allows realistic modeling of soil–structure interaction by considering nonlinear material properties, contact interfaces, and varying boundary conditions. ANSYS, a widely used finite element analysis software, provides robust capabilities for simulating reinforced concrete walls and surrounding soil domains
. In this study, computer simulation using ANSYS is employed to evaluate the structural behavior of concrete retaining walls with and without shear keys at different positions. The Finite Element Method (FEM) model incorporates material properties of concrete and soil, contact elements at the soil–wall interface, and appropriate loading conditions including self-weight, backfill pressure, and surcharge loads. By analyzing displacement contours, stress distribution, bending moment diagrams, and shear force variations, the influence of shear key placement can be quantitatively assessed. The simulation enables visualization of deformation patterns and identification of critical stress zones, particularly at the stem–base connection and beneath the footing
| [10] | F. Lai, S. Liu, J. Shiau, M. Liu, G. Cai, and M. Huang, “Data-driven modeling for evaluating deformation of a deep excavation near existing tunnels,” Underground Space, vol. 24, pp. 162–179, Oct. 2025,
https://doi.org/10.1016/j.undsp.2025.04.003 |
[10]
.
Figure 1. Impact of Shear Key Placement on the Structural Performance and Stability of Retaining Walls.
The objective of this research is to understand how varying the position of shear keys influences structural stability parameters such as lateral displacement, sliding resistance, bending moment capacity, and stress concentration
| [11] | S. Ma, Y. Lou, and P. Bao, “Experimental research and numerical analysis of shearing resistance in steel-concrete composite beam connectors,” Case Studies in Construction Materials, vol. 17, p. e01210, Dec. 2022,
https://doi.org/10.1016/j.cscm.2022.e01210 |
[11]
. Through systematic comparison of different configurations, no shear key, toe-positioned shear key, centrally placed shear key, and heel-positioned shear key the study aims to identify the most effective arrangement for enhancing performance. The results of finite element analysis will guide engineers in optimizing shear key placement to minimize material usage while ensuring adequate safety against failure modes. By improving understanding of load transfer mechanisms and soil–structure interaction effects, this research contributes to the development of safer, more reliable, and cost-effective retaining wall systems. Ultimately, the findings will support informed design decisions in civil engineering practice, ensuring enhanced structural integrity and long-term service performance of reinforced concrete retaining walls
| [12] | S. Barbhuiya, B. B. Das, A. Rajput, V. Katare, and A. K. Das, “Structural performance and implementation challenges of next-generation concrete materials,” Structures, vol. 81, p. 110169, Nov. 2025,
https://doi.org/10.1016/j.istruc.2025.110169 |
[12]
.
2. Literature Review
Changcheng Du (2001) et al. investigated the contribution of shear keys to improving the sliding resistance of cantilever retaining walls (CRWs) through a two-dimensional finite element analysis calibrated with field data from an instrumented cantilever retaining wall (CRW) in Minnesota
| [13] | Changcheng Du and Jianfeng Chen, “Numerical study of the effect of shear keys on the stabilityof cantilever retaining walls,” 2001. |
[13]
. The validated numerical model, combined with the Strength Reduction Method (SRM), was used to assess stability under varying shear key lengths and positions. The study revealed that the slip surface intersects the shear key, resulting in a deeper and wider failure mechanism, thereby increasing the anti-slip resistance of the wall system. When the shear key length increased from 0 m to 0.6 m, the factor of safety improved from 1.038 to 1.268, representing approximately a 22% increase in stability. Moreover, relocating the shear key from the toe toward the heel slab produced a non-linear trend in safety factor, showing initial stabilization, slight destabilization, and eventual restabilization. Similarly, Prajakta R. Jadhav (2020) et al. proposed a displacement-based seismic design approach for cantilever retaining walls with shear keys using two-dimensional plane strain Finite Element Method (FEM) analyses validated through case studies
| [14] | P. R. Jadhav and A. Prashant, “Computation of seismic translational and rotational displacements of cantilever retaining wall with shear key,” Soil Dynamics and Earthquake Engineering, vol. 130, p. 105966, Mar. 2020,
https://doi.org/10.1016/j.soildyn.2019.105966 |
[14]
. Among various configurations, a shear key positioned at the heel demonstrated the most efficient performance under scaled seismic accelerations of 0.12 g, 0.24 g, 0.36 g, and 0.6 g. Complementing these findings, Joseph G. Bentler (2007) et al. conducted field monitoring on a reinforced concrete cantilever retaining wall and observed that the active state was reached after only 0.1% backfill height translation
| [15] | J. G. Bentler and J. F. Labuz, “Daily and Seasonal Response of a Cantilever Retaining Wall,” in 7th FMGM 2007, Boston, Massachusetts, United States: American Society of Civil Engineers, Sep. 2007, pp. 1–10.
https://doi.org/10.1061/40940(307)21 |
[15]
. Interestingly, passive pressure in front of the shear key was less than 10% of the design assumption, highlighting discrepancies between theoretical and real behavior.
Shanmuga priya R K (2021) et al. reviewed the seismic design of cantilever retaining walls, noting that many researchers initially performed manual calculations in Excel before validating results using ANSYS software
| [16] | S. P. R K, “Analysis of Cantilever Retaining wall using Matrix Displacement method and ANSYS,” in Proceedings of the First International Conference on Combinatorial and Optimization, ICCAP 2021, December 7-8 2021, Chennai, India, Chennai, India: EAI, 2021.
https://doi.org/10.4108/eai.7-12-2021.2314613 |
[16]
. Their study emphasized that cantilever retaining walls remain structurally safe and economically viable up to heights of 6 m, beyond which tension-shear stresses at the toe significantly increase. The study also addressed variation in safety factors with changing wall height. Expanding on seismic earth pressure evaluation, Hakan Alper Kamiloglu (2019) et al. developed a pseudo-static method for estimating active earthquake earth thrusts in granular soils, considering both long-heel and short-heel wall configurations
| [17] | H. A. Kamiloğlu and E. Şadoğlu, “A method for active seismic earth thrusts of granular backfill acting on cantilever retaining walls,” Soils and Foundations, vol. 59, no. 2, pp. 419–432, Apr. 2019, https://doi.org/10.1016/j.sandf.2018.12.003 |
[17]
. Their research highlighted that the intersection between the failure surface and the wall stem governs seismic thrust distribution. Similarly, Anna Scotto di Santolo (2011) et al. applied a pseudo-static stress plasticity framework and continuum finite difference modeling (FDM) to evaluate active earth pressure under Italian accelerometric records scaled to uniform peak ground accelerations
. The results compared various methods and demonstrated that long-heel walls allow full Rankine active conditions to develop, whereas short-heel configurations modify failure mechanisms. Additionally, soil–structure interaction plays a critical role under dynamic loading, and despite extensive research, the time-dependent behavior of soil–wall systems under earthquake excitation remains partially understood
.
Experimental validation of seismic response was undertaken by A. Scotto di Santolo (2011) et al., who performed 1-g shaking table tests at the Bristol Laboratory for Advanced Dynamics Engineering (BLADE), University of Bristol
. Scaled models of cantilever retaining walls were tested under varying soil stiffness, wall geometry, and excitation characteristics. The study identified three key parameters governing response: magnitude and point of action of seismic soil thrust, sliding versus pull-rotational base movement, and influence of soil stiffness relative to shaking intensity. Furthermore, Prajakta Patil (2022) et al. conducted three-dimensional ANSYS finite element analysis to evaluate both static and dynamic performance of cantilever retaining walls
. The study included static analysis, modal analysis to determine natural frequencies and mode shapes, and nonlinear time-history analysis using three different earthquake ground motions. Their findings demonstrated the importance of accurate soil modeling and direct wall–soil interaction representation in predicting realistic deformation patterns. In addition, Chetan Sharma (2014) et al. provided practical design methodologies for cantilever retaining walls, incorporating stability checks for overturning, sliding, and bearing capacity
| [21] | C. Sharma, V. Baradiya, and M. TECH. SCHOLAR, IES, IPS ACADEMY INDORE, INDIA, “Evaluation of the effect of lateral soil pressure on cantilever retaining wall with soil type variation,” IOSRJMCE, vol. 11, no. 2, pp. 36–42, 2014,
https://doi.org/10.9790/1684-11233642 |
[21]
. The study showed that backfill unit weight, stem height, and concrete grade significantly influence base width, toe, and heel dimensions, with base length increasing proportionally to wall height.
Optimization approaches have gained prominence in improving retaining wall efficiency. Charles V. Camp (2012) et al. introduced the Big Bang–Big Crunch (BB-BC) optimization algorithm for cost-effective and lightweight cantilever retaining walls with base shear keys, ensuring compliance with ACI 318-05 requirements for stability, bending, and shear
. The method minimized cost or structural weight per unit length through heuristic population-based search. Similarly, Ali R. Kashani (2022) et al. applied multi-objective optimization algorithms such as Non-Dominated Sorting Genetic (NSGA-II), Multi- objective Particle Swarm optimization (MOPSO) & Strength Pareto Evaluationary Algorithm 2 (SPEA2) to optimize reinforced concrete cantilever retaining walls with and without base shear keys
| [23] | A. R. Kashani, A. H. Gandomi, K. Azizi, and C. V. Camp, “Multi-objective optimization of reinforced concrete cantilever retaining wall: a comparative study,” Struct Multidisc Optim, vol. 65, no. 9, p. 262, Sep. 2022,
https://doi.org/10.1007/s00158-022-03318-6 |
[23]
. Objectives included minimizing cost, weight, CO₂ emissions, and fuel consumption while maximizing safety factor. Using Pareto front analysis, hyper volume metrics, and Friedman statistical tests at 95% confidence level, Non-Dominated Sorting Genetic (NSGA-II) achieved superior coverage set ranking for both cost-based and weight-based scenarios. Complementing this, Shubham Srivastava (2022) et al. demonstrated the effectiveness of Particle Swarm Optimization (PSO) in optimizing cantilever RC retaining walls, particularly due to its capability to handle non-linear, non-differentiable objective functions
| [24] | S. Srivastava, S. Pandey, and R. Kumar, “Optimization of Reinforced Concrete Cantilever Retaining Wall using Particle Swarm Optimization,” IOP Conf. Ser.: Mater. Sci. Eng., vol. 1225, no. 1, p. 012042, Feb. 2022,
https://doi.org/10.1088/1757-899X/1225/1/012042 |
[24]
. Finally, M. Asghar Bhatti (2006) et al. showed that advanced optimization tools can be integrated into Microsoft Excel worksheets, allowing designers to determine optimal wall configurations based on variables such as wall height, surcharge load, allowable soil pressure, and friction angle
| [25] | M. A. Bhatti, “Retaining Wall Design Optimization with MS Excel Solver,” in Structures Congress 2006, St. Louis, Missouri, United States: American Society of Civil Engineers, Oct. 2006, pp. 1–15. https://doi.org/10.1061/40878(202)34 |
[25]
. Collectively, these studies establish that shear keys, seismic analysis, soil–structure interaction modeling, and advanced optimization techniques significantly enhance the stability, safety, and economic efficiency of cantilever retaining walls.
3. Methodology
This section presents the detailed methodology adopted for analyzing the structural behavior of reinforced concrete retaining walls incorporating shear keys at different positions. The study focuses on evaluating stability, stress distribution, deformation characteristics, and overall performance using three-dimensional finite element modeling in ANSYS Workbench. Retaining walls are critical earth-retaining structures designed to resist lateral earth pressure, surcharge loads, and self-weight. Their stability depends primarily on resistance against overturning, sliding, bearing pressure failure, and shear failure.
Figure 2. Methodology Flowchart.
In this investigation, a systematic numerical approach was followed. Initially, a three-dimensional geometric model of a cantilever retaining wall was developed using the Design Modeler module of ANSYS. Material properties for concrete and soil were defined based on standard design recommendations and validated literature. A refined finite element mesh was generated, ensuring higher mesh density near stress concentration regions such as the shear key interface. Appropriate boundary conditions representing foundation restraints were assigned, and lateral earth pressure was applied based on Rankine’s active earth pressure theory. Static structural analysis was then performed to evaluate wall response parameters including displacement, bending moment, shear force, stress distribution, and contact pressure behavior. The overall methodology adopted in this study is illustrated in
Figure 2 (Methodology Flowchart), which outlines the sequential process of modeling, loading, analysis, and performance comparison for different shear key configurations.
3.1. Research Design
The research adopts an analytical and simulation-based design approach using Finite Element Method (FEM). ANSYS Workbench was employed to develop three-dimensional models of retaining walls with varying shear key configurations. The objective was to compare structural behavior under identical geometric and loading conditions to isolate the influence of shear key positioning. All models were constructed with identical wall height, base width, and backfill soil parameters to ensure consistency in comparative analysis. The modeling and analysis process was executed in six systematic phases: geometry creation, material definition, meshing, application of boundary conditions, load application, and solution evaluation.
Geometry creation involved defining the cantilever wall stem, base slab (heel and toe), and shear key components. Material definition incorporated nonlinear elastic properties for soil and linear elastic properties for concrete. Meshing was performed using higher-order solid elements to capture realistic stress distribution. Boundary conditions simulated rigid foundation restraints. Earth pressure loads were applied as triangular distributed loads along the stem height. Finally, solution review involved extraction of displacement contours, stress profiles, reaction forces, and internal force distributions. This structured methodology ensured reliability, repeatability, and accuracy in evaluating the performance variation caused by shear key positioning.
3.2. Modeling of Retaining Wall
The retaining wall was modeled as a reinforced concrete cantilever wall resting on a rigid base foundation. Three configurations were analyzed to assess the influence of shear key positioning:
1) Case 1 considered a retaining wall without any shear key, serving as the baseline model.
2) Case 2 included a shear key positioned at the mid-height of the stem.
3) Case 3 incorporated a shear key with bolted connection enhancement.
The wall dimensions remained constant for all cases. The total height of the wall stem was 4.0 m, and the base width was 2.4 m. The geometric modeling was executed using the ANSYS Design Modeler module, ensuring dimensional accuracy and realistic structural representation. The shear key was modeled as a rectangular projection below the base slab, extending downward into the soil to mobilize passive resistance. In Case 3, bolt elements were incorporated to simulate enhanced interlocking behavior between key and soil. The three-dimensional modeling approach enabled realistic simulation of stress transfer mechanisms and soil-structure interaction behavior.
3.3. Material Properties
Material properties were assigned based on standard design code recommendations and validated literature values. For concrete, the modulus of elasticity ranged between 25–30 GPa, Poisson’s ratio was taken as 0.2, and density was 2500 kg/m³. These parameters ensure realistic stiffness and mass representation in the finite element model. For backfill soil, the elastic modulus varied between 20–50 MPa depending on compaction level, Poisson’s ratio was assumed as 0.3, and unit weight was taken as 18 kN/m³. These material properties were defined in the ANSYS Engineering Data section. The soil was modeled as an elastic medium capable of transmitting lateral earth pressure and passive resistance to the shear key.
3.4. Meshing and Element Type
Accurate stress prediction in finite element modeling depends significantly on mesh quality and element selection. In this study, SOLID186 elements were used for modeling concrete due to their higher-order capability and suitability for three-dimensional stress analysis. SOLID65 elements were used for representing soil behavior. A refined mesh was generated around critical zones such as the shear key interface and base slab edges to capture stress concentration effects. Mesh convergence studies were conducted to ensure solution accuracy. The mesh density was gradually increased until displacement and stress variations became negligible, confirming numerical convergence.
3.5. Boundary Conditions and Loading
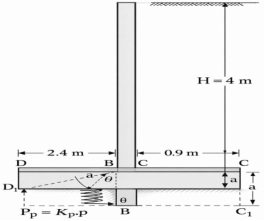
Figure 3. Geometry Model of Retaining wall.
The
Figure 3 Boundary conditions were applied to simulate realistic support conditions. The base of the foundation was restrained in vertical and horizontal directions to represent rigid footing behavior. Lateral restraints were applied to simulate soil confinement.
Active earth pressure was calculated using Rankine’s theory:
Substituting values:
P = (1/3) × 18 × (4²/2) = 48 kN
This triangular distribution was applied along the wall stem. The wall’s self-weight was automatically included by activating gravitational loading. Additional surcharge loads were incorporated for realistic operational scenarios.
3.6. Analysis Procedure
Static structural analysis was performed using ANSYS. The finite element solver computed nodal displacements, stress contours, bending moments, and shear forces under applied loads. Comparative evaluation was performed among the three cases. Key parameters examined included maximum lateral displacement, maximum bending stress at base, shear stress in stem, and contact pressure distribution. Finite element results enabled identification of stress concentration zones and effectiveness of shear key in enhancing sliding resistance and reducing base shear demand.
3.7. Case Study – Structural Stability Assessment
A detailed stability evaluation was performed for the cantilever retaining wall.
Total vertical load:
Active earth pressure:
Resisting moment:
Overturning moment:
Factor of safety against overturning:
FS = 190.3 / 64 = 2.97 > 2
Thus, the wall is safe against overturning.
For sliding:
Resisting force = μΣW = 0.5 × 121.05 = 60.525 FS sliding = 60.525 / 48 = 1.26 < 1.5.
The wall is unsafe against sliding, indicating necessity of shear key.
Eccentricity calculation confirmed no tensile stress at base, and bearing pressures were within permissible limits.
Shear key design resulted in required depth of 300 mm to satisfy FS = 1.5.
Shear stress in stem:
Thus, shear capacity is adequate.
Reinforcement detailing provided 8 mm diameter bars at 150 mm c/c on inner face and 300 mm c/c on outer face.
4. Result and Discussion
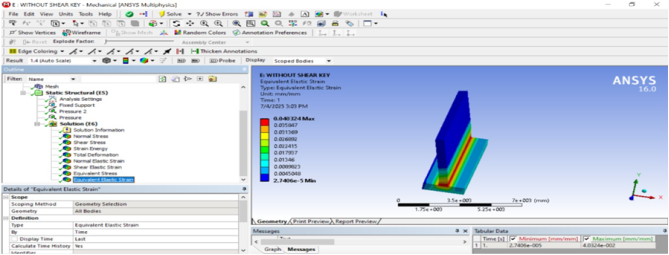
Figure 4. Retaining wall Without Shear key (Equivalent Elastic strain).
The
Figure 4 ANSYS 16.0 output illustrates the Equivalent Elastic Strain (mm/mm) distribution for the retaining wall model without a shear key at Time = 1 s. The maximum equivalent elastic strain is 0.045342 mm/mm, concentrated at the junction of the wall stem and base slab, indicating a critical stress concentration zone due to lateral earth pressure. The minimum strain value recorded is approximately 2.4106 × 10⁻⁵ mm/mm, observed in the less stressed base regions. The strain contour shows a gradual transition from red (high strain) to blue (low strain), confirming that maximum deformation occurs near the fixed support region, highlighting potential structural vulnerability without shear key provision.
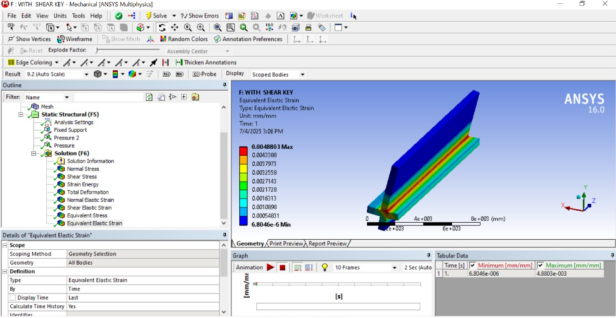
Figure 5. Retaining wall with Shear key (Equivalent Elastic strain).
The
Figure 5 ANSYS 16.0 result shows the Equivalent Elastic Strain (mm/mm) distribution for the retaining wall model with shear key at Time = 1 s. The maximum equivalent elastic strain is 0.0048803 mm/mm, significantly lower than the model without a shear key, indicating improved structural stability. The minimum strain value recorded is 6.8046 × 10⁻⁶ mm/mm, observed in the base region away from stress concentration zones. The highest strain is concentrated near the wall–base junction and along the shear key interface, shown in red. The contour variation from red to blue confirms reduced deformation and better load transfer due to the shear key provision.
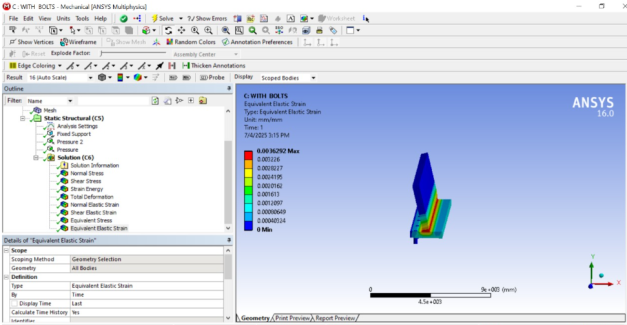
Figure 6. Retaining Wall With Bolt (Equivalent Elastic strain).
The
Figure 6 ANSYS 16.0 output presents the Equivalent Elastic Strain (mm/mm) distribution for the retaining wall model with bolts. The maximum equivalent elastic strain is 0.0035292 mm/mm, observed near the wall–base junction and bolt connection region, indicating localized stress concentration. The minimum strain value is 0 mm/mm, recorded in the least stressed zones. Compared to the previous models, the strain magnitude is further reduced, demonstrating that bolted connections improve structural stiffness and load transfer efficiency. The contour gradient from red (maximum strain) to blue (minimum strain) confirms better stress redistribution and reduced deformation due to the bolt reinforcement system.
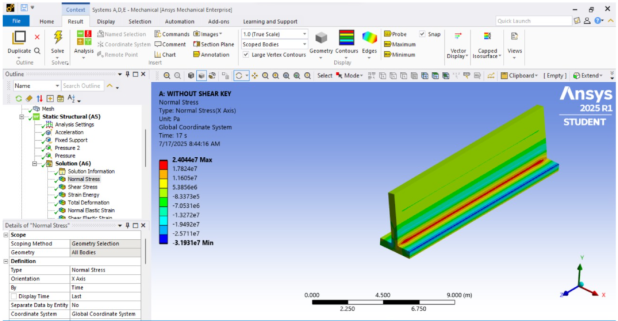
Figure 7. Retaining wall Without Shear key (Normal Stress).
The
Figure 7 ANSYS 2025 R1 output shows the Normal Stress (X-Axis) in Pa distribution for the retaining wall without shear key at Time = 17 s. The maximum normal stress is 2.4044 × 10⁷ Pa, concentrated near the base slab–stem junction, indicating a critical tensile/compressive stress zone under lateral earth pressure. The minimum stress recorded is –3.1931 × 10⁷ Pa, representing compressive stress at the bottom foundation region. The stress contour varies from red (maximum tensile) to dark blue (maximum compressive), confirming significant stress concentration along the base slab and toe region, which may increase the risk of cracking or structural instability without shear key provision.
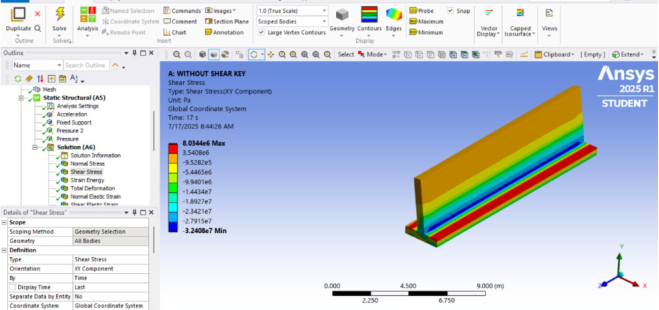
Figure 8. Retaining wall Without Shear key (Shear Stress).
The
Figure 8 ANSYS 2025 R1 result illustrates the Shear Stress (XY Component) in Pa distribution for the retaining wall without shear key at Time = 17 s. The maximum shear stress recorded is 8.0344 × 10⁶ Pa, primarily concentrated along the base slab and at the stem–base junction, indicating critical shear transfer zones due to lateral earth pressure. The minimum shear stress value is –3.2408 × 10⁷ Pa, observed at the bottom foundation region, representing high compressive shear effects. The contour pattern from red (maximum positive shear) to dark blue (maximum negative shear) highlights significant shear concentration near the toe and base, suggesting potential sliding vulnerability without shear key support.
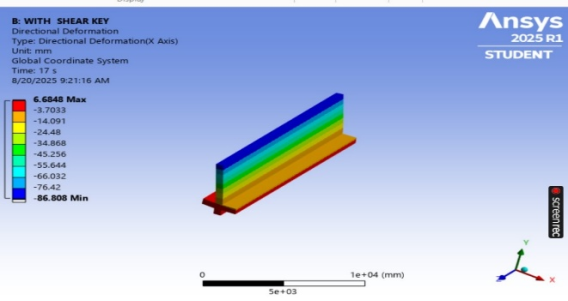
Figure 9. Retaining wall With Shear key (Directional Deformation).
The
Figure 9 ANSYS 2025 R1 output presents the Directional Deformation (X-Axis) in mm for the retaining wall with shear key at Time = 17 s. The maximum lateral deformation recorded is 6.6848 mm, observed at the top of the wall stem, indicating outward displacement due to earth pressure. The minimum deformation is –86.808 mm, concentrated at the base slab region, representing maximum restraint and compression near the foundation. The contour gradient from red (higher displacement) to dark blue (lower displacement) shows controlled deformation along the wall height. The presence of the shear key improves stability by limiting excessive sliding and redistributing lateral displacement more effectively.
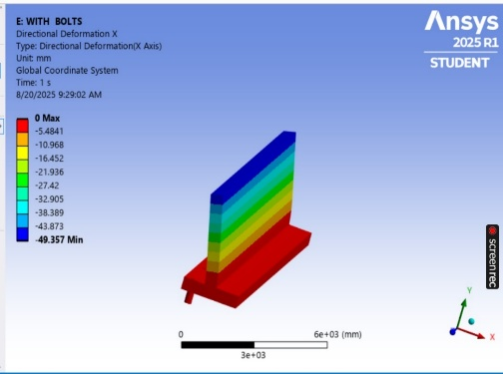
Figure 10. Retaining wall With Bolds (Directional Deformation in X- Direction).
The
Figure 10 ANSYS 2025 R1 result shows the Directional Deformation (X-Axis) in mm for the retaining wall with bolts at Time = 1 s. The maximum deformation is 0 mm, indicating full restraint at the fixed base region. The minimum deformation recorded is –49.357 mm, occurring at the top portion of the wall stem, representing maximum lateral displacement under applied earth pressure. The contour transitions from red at the base (minimum displacement zone) to dark blue at the top (maximum displacement zone). Compared to the shear key model (–86.808 mm), the bolted system significantly reduces lateral deformation, demonstrating enhanced stiffness and improved resistance against sliding and overturning.
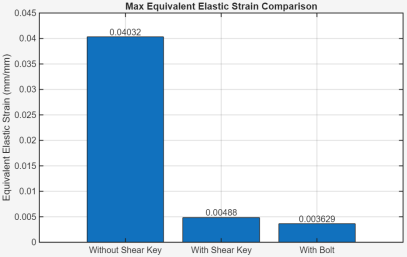
Figure 11. Max Equivalent Elastic Strain Comparison.
The
Figure 11 titled “Max Equivalent Elastic Strain Comparison” illustrates the variation in maximum equivalent elastic strain for three retaining wall configurations. The wall without a shear key shows the highest strain value of 0.04032 mm/mm, indicating significant deformation under lateral earth pressure. When a shear key is introduced, the strain reduces drastically to 0.00488 mm/mm, demonstrating improved stiffness and resistance against sliding. Further enhancement using a bolt with the shear key results in the lowest strain value of 0.003629 mm/mm, reflecting maximum structural stability. The results clearly indicate that incorporating a shear key, especially with bolt support, substantially improves strain performance.
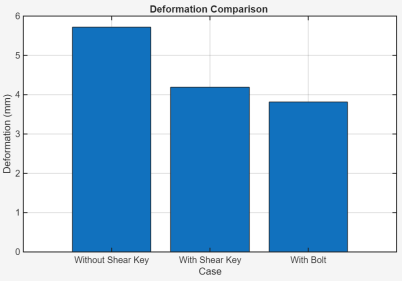
Figure 12. Deformation Comparison.
The
Figure 12 titled “Deformation Comparison” presents the maximum lateral deformation values for three retaining wall configurations. The wall without a shear key exhibits the highest deformation of approximately 5.7 mm, indicating greater lateral displacement under earth pressure. Introducing a shear key reduces the deformation significantly to about 4.2 mm, demonstrating improved stiffness and sliding resistance. Further enhancement with a bolted shear key shows the lowest deformation value of nearly 3.8 mm, reflecting the most stable structural response. The results clearly indicate that the inclusion of a shear key, particularly with bolt support, effectively minimizes deformation and enhances overall structural performance of the retaining wall.
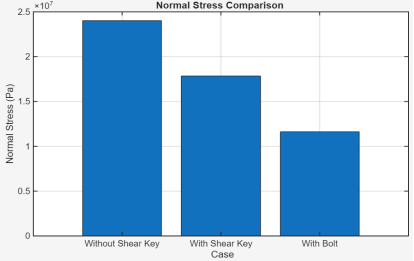
Figure 13. Normal Stress Comparison.
The
Figure 13 titled “Normal Stress Comparison” illustrates the variation in maximum normal stress for different retaining wall configurations. The wall without a shear key shows the highest normal stress of approximately 2.4 × 10⁷ Pa, indicating greater stress concentration at the base and stem region. When a shear key is introduced, the normal stress reduces to around 1.8 × 10⁷ Pa, demonstrating improved load transfer and stress distribution. The configuration with a bolted shear key exhibits the lowest stress value of nearly 1.15 × 10⁷ Pa, reflecting enhanced structural stability. These results confirm that incorporating a shear key, particularly with bolt support, significantly reduces normal stress levels.
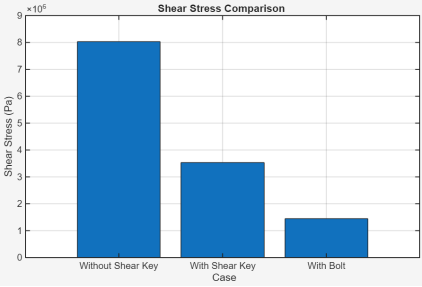
Figure 14. Shear Stress Comparison.
The
Figure 14 titled
“Shear Stress Comparison” presents the maximum shear stress values for three retaining wall configurations. The wall without a shear key records the highest shear stress of approximately 8 × 10⁶ Pa, indicating significant shear concentration due to lateral earth pressure. When a shear key is provided, the shear stress decreases considerably to about 3.5 × 10⁶ Pa, demonstrating improved resistance against sliding forces. The configuration with a bolted shear key shows the lowest shear stress value of nearly 1.5 × 10⁶ Pa, reflecting superior stress redistribution and enhanced structural stability. These results clearly indicate that incorporating a shear key, particularly with bolt support, effectively reduces shear stress.