1. Introduction
One of the fundamental characteristics of human being is the ability to plan for the future
| [14] | Shahab, S., Clinch, J. P., & O’Neill, E. (2019). Impact-based planning evaluation: Advancing normative criteria for policy analysis. Environment and Planning B: Urban Analytics and City Science, 46(3), 534–550. https://doi.org/10.1177/2399808317720446 |
[14]
. Decisions over land use can transform cities from sites of overcrowding and congestion into engines of national growth and prosperity
. Urban centers create value when they are well-planned and managed, which is the sum of all economic, social, environmental, and intangible conditions
. Conversely, if poorly planned, and managed urban can become breeding grounds of poverty, inequality, and war
. This entails poor urban planning and management can have grave results for the urban economy, the environment and society
| [17] | Tan, A. (2009). Liveable cities: The Benefits of Urban Environmental Planning. World Cities: Achieving Liveability and Vibrancy, 155–172. |
[17]
.
Even the best urban plans have the risk of being underused if they don’t accompany with financial and regulatory solutions for implementation
| [18] | UN-Habitat. (2015). THE CHALLENGE OF LOCAL GOVERNMENT FINANCING IN DEVELOPING COUNTRIES United Nations Human Settlements Programme (UN-Habitat), the City of Barcelona and the Province of Barcelona. In United Nations Settlement Programme (Vols. 978-92-1–1, Issue 1). TheChallenge of Local Government Financing in Developing Countries _3.pdf https://sustainabledevelopment.un.org/content/documents/1732 |
[18]
. Evaluation capacity, trustworthy institutions, and good urban government policy are all required for plan implementation
| [19] | UN-Habitat. (2018). Urban planning for city leaders. |
[19]
. Governments that properly plan and manage urbanization will reap the benefits that urbanization provides to society
.The implication is good planning is measured by the success and outcomes of its implementation
| [19] | UN-Habitat. (2018). Urban planning for city leaders. |
[19]
. This, in turn, implies to enhance the effectiveness of urban plans, a regular base evaluation is essential
| [13] | Segura, S., & Pedregal, B. (2017). Monitoring and evaluation framework for spatial plans: A Spanish case study. Sustainability (Switzerland), 9(10). https://doi.org/10.3390/su9101706 |
[13]
.
1.1. Conformance and Performance Approaches of Plan Evaluation
Evaluation of plan implementation is receiving more attention these days. However, in comparison to other domains of policy research, planning implementation assessment is less developed
| [8] | Lyles, W., Berke, P., & Smith, G. (2016). Local plan implementation: assessing conformance and influence of local plans in the United States. Environment and Planning B: Planning and Design, 43(2), 381–400. https://doi.org/10.1177/0265813515604071 |
[8]
. There are two conceptions of plan implementation in the planning evaluation literature: conformance-based and performance-based evaluations
| [14] | Shahab, S., Clinch, J. P., & O’Neill, E. (2019). Impact-based planning evaluation: Advancing normative criteria for policy analysis. Environment and Planning B: Urban Analytics and City Science, 46(3), 534–550. https://doi.org/10.1177/2399808317720446 |
[14]
. Performance-based approach emphasized the planning process, viewing a plan as a guide for future planning decisions rather than a blueprint
| [6] | Kitur, R. C. (2019). Barriers to implementing urban plans in Kenya. |
[6]
. When plans are viewed as visions, the performance method is frequently used, and it focuses on the role of plans in decision-making
| [12] | Science, E. (2019). Impact of Kigali City master plan implementation on living conditions of urban dwellers : case of Nyarugenge District in Rwanda Impact of Kigali City master plan implementation on living conditions of urban dwellers : case of Nyarugenge District in. https://doi.org/10.1088/1755-1315/389/1/012018 |
[12]
.
1.2. Conformance-based Evaluation
The success or failure of a plan is determined using set criteria in a conformance-based approach
| [6] | Kitur, R. C. (2019). Barriers to implementing urban plans in Kenya. |
[6]
. Plan conformity refers to whether or not the policies outlined in a plan are implemented
| [8] | Lyles, W., Berke, P., & Smith, G. (2016). Local plan implementation: assessing conformance and influence of local plans in the United States. Environment and Planning B: Planning and Design, 43(2), 381–400. https://doi.org/10.1177/0265813515604071 |
[8]
. Conformance-based evaluations are founded on the assumption that there are observable causal links between planning goals, activities, and outcomes, and they need well specified goals and objectives as well as well-implemented planning procedures
| [7] | Laurian, L., Crawford, J., Day, M., Kouwenhoven, P., Mason, G., Ericksen, N., & Beattie, L. (2010). Evaluating the outcomes of plans: Theory, practice, and methodology. Environment and Planning B: Planning and Design, 37(4), 740–757. https://doi.org/10.1068/b35051 |
[7]
. As a result, conformance-oriented evaluation concentrates on achieving the urban planning goal. It focuses on the adoption of plan policies, permitting decisions, and land-use changes that have been observed
| [8] | Lyles, W., Berke, P., & Smith, G. (2016). Local plan implementation: assessing conformance and influence of local plans in the United States. Environment and Planning B: Planning and Design, 43(2), 381–400. https://doi.org/10.1177/0265813515604071 |
[8]
. Scholars compared the anticipated and actual land uses and densities, as well as the progress of the plan
| [7] | Laurian, L., Crawford, J., Day, M., Kouwenhoven, P., Mason, G., Ericksen, N., & Beattie, L. (2010). Evaluating the outcomes of plans: Theory, practice, and methodology. Environment and Planning B: Planning and Design, 37(4), 740–757. https://doi.org/10.1068/b35051 |
[7]
. This technique is consistent with 'top-down' evaluation, in which a plan's/outputs policy's must precisely conform to its objectives
| [14] | Shahab, S., Clinch, J. P., & O’Neill, E. (2019). Impact-based planning evaluation: Advancing normative criteria for policy analysis. Environment and Planning B: Urban Analytics and City Science, 46(3), 534–550. https://doi.org/10.1177/2399808317720446 |
[14]
.
To date, conformance approaches have become much more common, with research examining the acceptance of policies included in plans
| [8] | Lyles, W., Berke, P., & Smith, G. (2016). Local plan implementation: assessing conformance and influence of local plans in the United States. Environment and Planning B: Planning and Design, 43(2), 381–400. https://doi.org/10.1177/0265813515604071 |
[8]
. Conformity evaluation is carried out in accordance with technical procedures outlined in sectoral legislation
| [5] | Industry, D. E. &. (2014). Introduction to Conformity Assessment and Conformity Assessment Procedures of the New Legal Framework. Nanotechnology, 1(April 2009), 1–33. |
[5]
. The plan serves as a model for conformance evaluation, which aims to uncover the plan's outcomes. Simply put, a conformance review examines if the plan's required steps were carried out. Did we establish a park here if we suggested one?
. The degree of conformity between a plan's outcomes and its set goals is used to determine whether a policy instrument is successful
| [14] | Shahab, S., Clinch, J. P., & O’Neill, E. (2019). Impact-based planning evaluation: Advancing normative criteria for policy analysis. Environment and Planning B: Urban Analytics and City Science, 46(3), 534–550. https://doi.org/10.1177/2399808317720446 |
[14]
. The conformance approaches views plans as blueprints whose requirements are finally mirrored in actual spatial development. As a result, the compliance method implies that plans are successfully implemented if the plan provisions are followed on the ground
| [12] | Science, E. (2019). Impact of Kigali City master plan implementation on living conditions of urban dwellers : case of Nyarugenge District in Rwanda Impact of Kigali City master plan implementation on living conditions of urban dwellers : case of Nyarugenge District in. https://doi.org/10.1088/1755-1315/389/1/012018 |
[12]
.
In general, the compliance technique is thought to be objective and simple to use, and it can immediately represent how well zoning maps have been implemented
.
According to conformity evaluation, once adopted, plans are intended to be explicit guides to action. Outcomes must conform to the standards contained in the plan
| [2] | Brody, S. D., Highfield, W. E., & Thornton, S. (2006). Planning at the urban fringe: An examination of the factors influencing nonconforming development patterns in southern Florida. Environment and Planning B: Planning and Design, 33(1), 75–96. https://doi.org/10.1068/b31093 |
[2]
. For instance by using the building permit as an indicator for plan implementation it is possible to measure the degree to which the plan conformed to their original design
| [2] | Brody, S. D., Highfield, W. E., & Thornton, S. (2006). Planning at the urban fringe: An examination of the factors influencing nonconforming development patterns in southern Florida. Environment and Planning B: Planning and Design, 33(1), 75–96. https://doi.org/10.1068/b31093 |
[2]
.
1.3. Performance-Based Evaluation
Comprehensive and strategic plans, which are considered as wide attempts to identify, design, and promote overall objectives and goals, are well suited for performance-based evaluation
| [7] | Laurian, L., Crawford, J., Day, M., Kouwenhoven, P., Mason, G., Ericksen, N., & Beattie, L. (2010). Evaluating the outcomes of plans: Theory, practice, and methodology. Environment and Planning B: Planning and Design, 37(4), 740–757. https://doi.org/10.1068/b35051 |
[7]
. As a result, the effectiveness of plans is shown through their performance, which is considered a stronger sign of implementation than the exact match between objectives, actions, and outcomes
| [7] | Laurian, L., Crawford, J., Day, M., Kouwenhoven, P., Mason, G., Ericksen, N., & Beattie, L. (2010). Evaluating the outcomes of plans: Theory, practice, and methodology. Environment and Planning B: Planning and Design, 37(4), 740–757. https://doi.org/10.1068/b35051 |
[7]
. Evaluation of plan performance has also been envisioned as being more in line with the concept of performance zoning, in which the focus is placed on tangible changes in community conditions rather than rigid adherence to use in decision-making scenarios for projects such as water quality protection, land-use patterns that support transit usage, hazard vulnerability reduction
| [8] | Lyles, W., Berke, P., & Smith, G. (2016). Local plan implementation: assessing conformance and influence of local plans in the United States. Environment and Planning B: Planning and Design, 43(2), 381–400. https://doi.org/10.1177/0265813515604071 |
[8]
.
Plans are viewed as decision frameworks in the performance-based approach, which focuses on planning processes. In this approach, the plan serves as a guide for future decision-making rather than a blueprint
| [8] | Lyles, W., Berke, P., & Smith, G. (2016). Local plan implementation: assessing conformance and influence of local plans in the United States. Environment and Planning B: Planning and Design, 43(2), 381–400. https://doi.org/10.1177/0265813515604071 |
[8]
. When plans are viewed as visions, the performance method is frequently used, and it focuses on the role of plans in decision-making
| [12] | Science, E. (2019). Impact of Kigali City master plan implementation on living conditions of urban dwellers : case of Nyarugenge District in Rwanda Impact of Kigali City master plan implementation on living conditions of urban dwellers : case of Nyarugenge District in. https://doi.org/10.1088/1755-1315/389/1/012018 |
[12]
. Performance-based approach emphasized the planning process, viewing a plan as a guide for future planning decisions rather than a blueprint
| [6] | Kitur, R. C. (2019). Barriers to implementing urban plans in Kenya. |
[6]
.
In terms of time horizon, plan conformity review can begin soon after plan adoption and continue throughout the duration of the plan's intended horizon. Plan performance necessitates a longer observation period to observe the on-the-ground outcomes that occur from plan compliance actions
| [8] | Lyles, W., Berke, P., & Smith, G. (2016). Local plan implementation: assessing conformance and influence of local plans in the United States. Environment and Planning B: Planning and Design, 43(2), 381–400. https://doi.org/10.1177/0265813515604071 |
[8]
.
Plan conformance refers to whether the principles or standards stated in a plan are implemented, whereas plan performance refers to whether a plan has an impact on the outcomes (e.g., increased pedestrian accessibility due to changes to land-use patterns or decreasing vulnerability to natural hazards)
| [8] | Lyles, W., Berke, P., & Smith, G. (2016). Local plan implementation: assessing conformance and influence of local plans in the United States. Environment and Planning B: Planning and Design, 43(2), 381–400. https://doi.org/10.1177/0265813515604071 |
[8]
.
1.4. The Debate on Plan Conformity and Performance
Plan performance is focusing on ‘‘whether the plan plays a role in those decision situations in which it was meant to be used
| [8] | Lyles, W., Berke, P., & Smith, G. (2016). Local plan implementation: assessing conformance and influence of local plans in the United States. Environment and Planning B: Planning and Design, 43(2), 381–400. https://doi.org/10.1177/0265813515604071 |
[8]
. Plan in the performance approach is a guide for the future decision-making process
| [14] | Shahab, S., Clinch, J. P., & O’Neill, E. (2019). Impact-based planning evaluation: Advancing normative criteria for policy analysis. Environment and Planning B: Urban Analytics and City Science, 46(3), 534–550. https://doi.org/10.1177/2399808317720446 |
[14]
. Plan conformance addresses whether the principles or standards proposed in a plan are carried out
| [8] | Lyles, W., Berke, P., & Smith, G. (2016). Local plan implementation: assessing conformance and influence of local plans in the United States. Environment and Planning B: Planning and Design, 43(2), 381–400. https://doi.org/10.1177/0265813515604071 |
[8]
. This denotes once adopted, the plan is supposed to be an unambiguous guide to action
. From conformance point of view any departure from the goals and objectives of the adopted plan would be considered a failure
| [2] | Brody, S. D., Highfield, W. E., & Thornton, S. (2006). Planning at the urban fringe: An examination of the factors influencing nonconforming development patterns in southern Florida. Environment and Planning B: Planning and Design, 33(1), 75–96. https://doi.org/10.1068/b31093 |
[2]
. Arguments against the conformance approach hold that the evaluations overlook the unintended consequences of plans
. Depending solely on a conformity approach is rarely adequate
| [14] | Shahab, S., Clinch, J. P., & O’Neill, E. (2019). Impact-based planning evaluation: Advancing normative criteria for policy analysis. Environment and Planning B: Urban Analytics and City Science, 46(3), 534–550. https://doi.org/10.1177/2399808317720446 |
[14]
since conformance approach is characterized by an excessive dependence on idealized modeling
. It has the problem of uncertainty and rigidity
| [16] | Talen, E. (1997). Success, failure, and conformance: An alternative approach to planning evaluation. Environment and Planning B: Planning and Design, 24(4), 573–587. https://doi.org/10.1068/b240573 |
[16]
. In contrast, the performance method has its critics who argue that it minimizes the importance of urban planning and places too much focus on program achievements. Accordingly, performance approach stresses whether a plan has an impact on the outcomes
| [8] | Lyles, W., Berke, P., & Smith, G. (2016). Local plan implementation: assessing conformance and influence of local plans in the United States. Environment and Planning B: Planning and Design, 43(2), 381–400. https://doi.org/10.1177/0265813515604071 |
[8]
. This infers performance approach ignores the detailed prescriptions of the plan and instead attempts to evaluate the effectiveness of the plan along some dimension
.
There are theoretical as well as practical problems with regard to conformance and performance evaluation and the determinants of urban plan implementation. Theoretical problems emanate from the view of scholars with the thinking that a well-designed urban plan will enhance the growth and development of the town. Theorists tended to plan making process and thus disregard the implementation of plan, which is a vital component of urban planning. The issues with empirical researches stem from the fact that scholars mostly used either the performance assessment or conformity approaches to examine the degree of urban plan implementation. There is a dearth of scholarly works that integrates performance and conformity approaches to assess urban plan and identify variables impacting their implementation. Combining plan conformance and performance techniques has the potential to help us better understand how and why plans and planning work or fail
| [8] | Lyles, W., Berke, P., & Smith, G. (2016). Local plan implementation: assessing conformance and influence of local plans in the United States. Environment and Planning B: Planning and Design, 43(2), 381–400. https://doi.org/10.1177/0265813515604071 |
[8]
. As a result, both plan conformity and performance methodologies are employed to assess the contribution of an urban plan to the growth and development of a small town in this research.
3. Result and Discussion
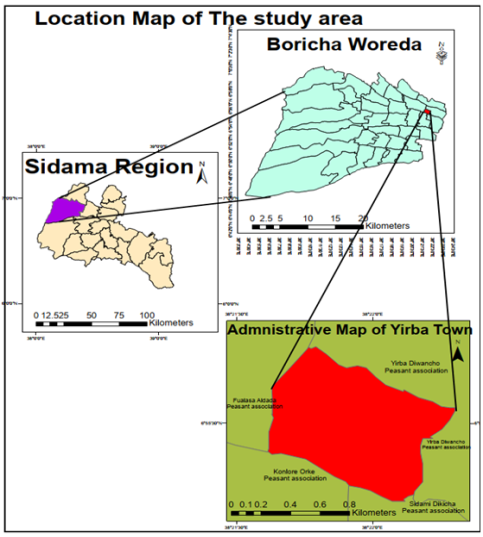
3.1. The Shape of the Town and Compactness Ratio
The shape of the town has vital importance for provision of infrastructure and to ensure fair service distribution. The shape of the town can be realized in terms of circular (compact), elongated and irregular. Compactness ratio measures the degree of deviation of an object (in this case map) from circle.Compact shaped towns are more preferable than elongated and irregular since in near circular shaped town, every corner is found at equidistance from the center and thus accessible for service and utilities. Moreover, for compact shaped town, the cost for provision of infrastructure is lower than the other two shapes. As far as the project town is concerned, to understand the shapes of two consecutive plans, and calculation (compactness Ratio) are applied. The level of compactness can be found by observing one’s necked eye. It is found by calculating the North- South and East- West –Distances are measured from the maps and thus divided. More compact or circular shape towns have compactness ratio closer to one (1) and deviation from one indicates elliptical shapes.
To measure compactness the area and the perimeter of the project town should be calculated from the map and thus by dividing the area and the perimeter as indicated below.
According to Ottensmann (2021) for more compact shape towns, the distances from the center of a circle to all points on the boundary are equal. Conversely, less compact and more irregular shape, will have variable distances from its center to various points on its periphery. A measure of that variation can be used as a measure of the compactness of the shape. The result of measure of ratio of distance is closer to one (1) for compact shape and deviation from one denotes elongation
.
Figure 2. Shape and compactness ratio.
To measure of distances of the two maps are indicated below:-
A Distances of the map of 2022 land use plan
North –South distance=7106 meter
East –west distance=4930meter
B Distances of the map of 2012 land use plan
North –South distance=5521 meter
East –west distance= 4690meter
As it is indicated on the above, the Compactness ratio land use of 2012 is 0.82 and Compactness ratio of 2022 is 0.69.
The results of the Compactness ratio calculation reveals that the shape of older plan land use plan (I.e.2012) with compactness ratio of 0.82 is more compact than that of land use plan of 2022.
3.2. Performance Evaluation of Land Use Plan
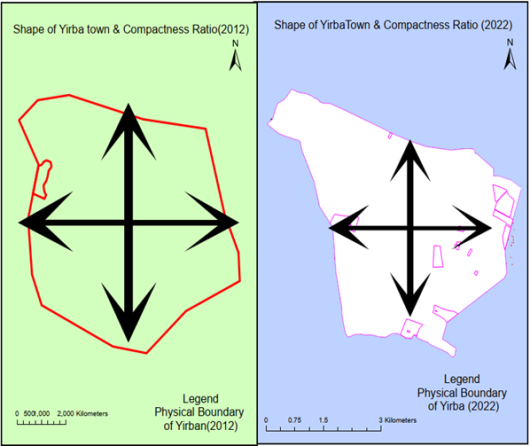
3.2.1. Residence and Mixed Land Use Functions
Existing housings are concentrated along with the main asphalt road (from Hawassa to Wolyita Soda via Morocho).Densities of housing are also situated around the market. By 2012 the existing residence was 289,908 square meters. Additional residential area was further proposed to be 2,085,795 square meters (208.5hectares) by the stated period to serve for ten year (2012-2021). The total area allocated for residential land functions were 237.4 hectares of land.
Regarding the level of achievement of residential land functions is concerned, within ten years (i.e. from 2012-2021), 117 hectares of residential land was implemented. In other words a total of 199 blocks were covered by residential land functions. About 49.4 percent of the total area reserved for residence was implemented. As it is depicted on the above before ten years (.i.e. before 2012) the existing residential land use was 28.9 hectares. When 28.9 hectares of land was subtracted with 117 hectares of land the result figure is 89 hectares. Therefore, the actual implemented residential land use within the past ten years (2012-2021) was 89 hectares of land.
As far spatial distribution is concerned, residential blocks were allocated in four directions in fair manner and the plan ensured the planning principle in that residential blocks are arranged next to mixed use.
Mixed uses of the project town are distributed along Sub Arterial Street and next to commercial land use in Principal Arterial Street. As far as the proportion is concerned, 1,289,993 square meters of land area or 128.9 hectares was allocated for mixed use by year 2012. At present areas occupied by mixed use is 53.4 hectares. A total of 68 blocks of the land use are covered by mixed use. About 41.7 percent of the total land area reserved for mixed use was implemented. Besides, most of land assigned to residential land use by 2012 around market, central area and closer to sub arterial streets was converted to mixed use within ten years.
Figure 3. The difference between actual residence and mixed use, and proposed (2012GC).
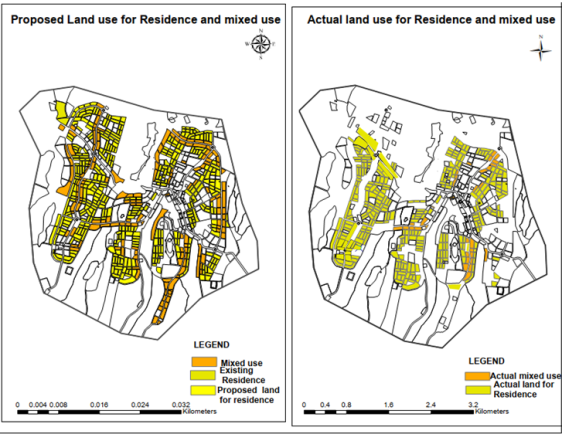
3.2.2. The Proportion of Land for Commercial Activities
The drivers commercial Activities for towns like the project town consist of open market, livestock market, restaurants, hotels, shops, cafeteria and the like. The stated establishments are the engines for growth and development for town. As far as the existing land use of the project town is concerned, commerce and business activities concentrated around the main road bus terminal, open market and livestock market. Therefore from the view point of urban planning, such functions are usually assigned in a place closer to or around bus terminal, open market and livestock market. Banks such as commercial bank of Ethiopia, Sidama Bank, etc are situated on the principal arterial streets.
580459 square meters of land was allocated for commerce and business activities to serve for 10 years during 2012. The total area covered by existing commerce and business activities on the ground is 30.2 hectares. Besides, a total of 47 blocks are currently serving for commerce and business activities. When compared to the proposal, the proportion of commercial land that is implemented accounts 52 percent.
Figure 4. The difference between actual commercial activities and proposed (2012GC).
As it is depicted in the
figure 4 above, commerce and business activities were distributed along Principal Arterial Street and areas around the market. Those areas proposed for commerce and business away from the center are not implemented even if they are situated on Principal Arterial Street. Moreover, proposed for commerce and business in west of the town closer to mini market were not achieved as intended.
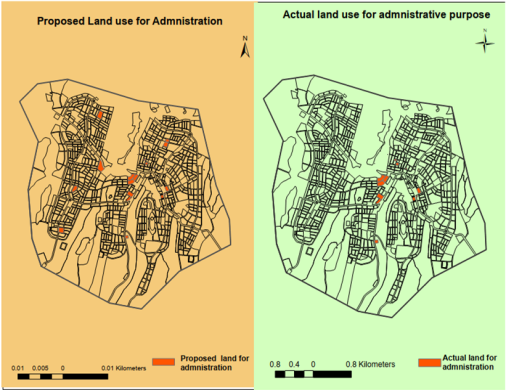
3.2.3. The Share of Land for Administration
Administrative land use comprises of woreda administration, finance, water, health, agriculture, municipality and other governmental and non-governmental organizations. The land allotment for administrative purpose was 13.9 hectares. A total of 17 blocks were proposed for administrative purpose by 2012. The land inventory result indicates 5.9 hectares of land is presently covered with administrative purpose. Besides, 12 blocks were used for the stated service. This suggests that the proportion of implemented administrative land is below the midpoint (i.e. 42%).
As far as the spatial configuration of administrative functions is regarded, except few cases, administrative offices were planned to be far from central area and closer to residential area in the proposal. However, the existing condition on administrative office dictates that they are concentrated in the central part of the town relatively away from residential area.
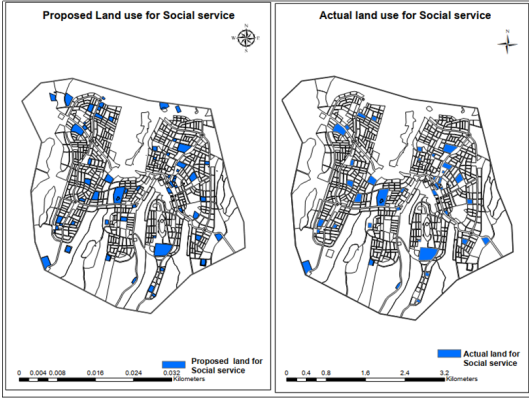
3.2.4. Social and Municipal Service
Social Service is among the fundamental domains of the urban society. Social service embraces schools, health institutions, religious organization and municipal services such as abattoir, sanitation and waste management etc. During 2012 a total of 1,388,525 square meters or 138 hectares of land were propose to social services. More than half of the proposed social services are implemented. A total of 75.4 hectares of land are covered by social service. The result of land inventory reveals that out of the total land covered by social service, religious institutions account 34 percent, educational institutions share 33 percent, municipal services comprise 29.7 percent and health institutions account the remaining 3 percent. When compared with the proposal, 55 percent of land for social service is found on the ground. This implies more than half of the proposed social services are implemented.
Figure 5. The difference between actual administrative use and proposed (2012GC).
Figure 6. The difference between actual social service and proposed (2012GC).
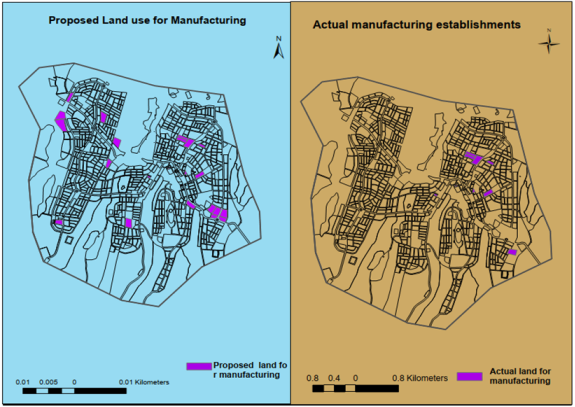
3.2.5. Proportion of land for Manufacturing and Storage
Manufacturing and storage function, among others, embraces Micro and small enterprises, warehouse, garages, fuel stations, and factories. There are coffee processing establishment in the northern tip of the town, fuel stations in south west following the road. The proposed land for Manufacturing and storage was 29.8 hectares by the year 2012.The spatial distribution of land for manufacturing and storage was even and situated in peripheral area of the town. The actual land covered by manufacturing and storage is 6 hectares. The available manufacturing and storages are found in the central and northern part to the town. Fuel station (under construction) is situated in the southeastern tip of the town closer to the main asphalt.
Figure 7. The difference between actual manufacturing establishment and proposed (2012GC).
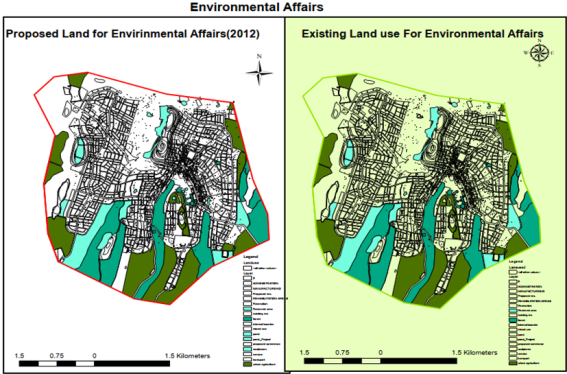
3.2.6. The Proportion of Areas to Be Occupied By Green Development
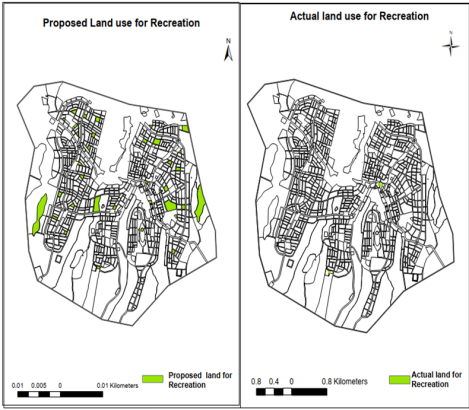
The proportion of land for green development was 558 hectares and out of which recreation and formal green accounts 40 hectares, forest and informal green 202.4hectares, urban agriculture 203 hectares as well as areas to be covered by special function such as rehabilitated areas constitute 94 hectares. More specifically, the proposed land for recreation purpose was 420,299 meters square. The land inventory on the existing recreational areas indicate that 9,731 meters square land is occupied by the stated land use and out of which there is one place for green area (traditionally called Gudumale) with the total area of 3,382 meters square and one open space or sport field which has the total area of 6,349 meters square. The proportion of land that is occupied by recreation accounts only 2 percent.
Figure 8. The difference between actual environmental affairs and proposed (2012GC).
Figure 9. The difference between actual recreation and proposed (2012GC).
3.2.7. The Level of Performance Road
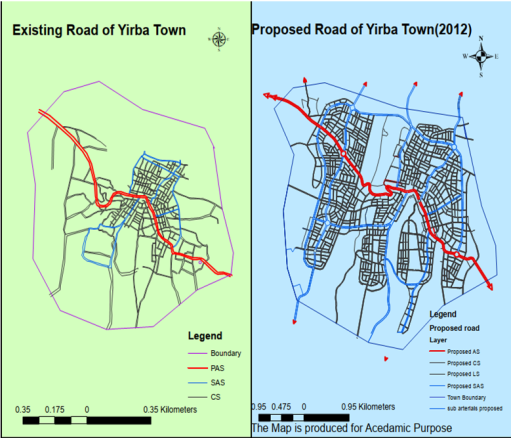
The road proposal of 2012 plan shows a total of 668,519 meter squares of road and out of which principal arterial street has the total of 29,275 meter squares, sub arterial streets has the total of 92,706 meter squares and collector streets has the total of 546,538 meter squares. On the other hand the actual implementation of the road shows a marked variation. A total of 36,111 meter squares of road is developed and out of which principal arterial street has the total of 3,141 meter squares, sub arterial streets has the total of 4,785 meter squares and collector streets has the total of 28,185 meter squares. This denotes that the proportion of implementation of principal Arterial street, sub arterial streets and collector streets are 10.7 percent, 5.2 percent and 5.1 percent respectively. When compared to the proposal, aggregate implementation of road is 5.4 percent. The existing road of the project town to some extent follow irregular pattern. This is partly because of the ruggedness of the topography.
Figure 10. The difference between actual road and proposed (2012GC).
3.2.8. Proportion of Performance of Selected Land Use
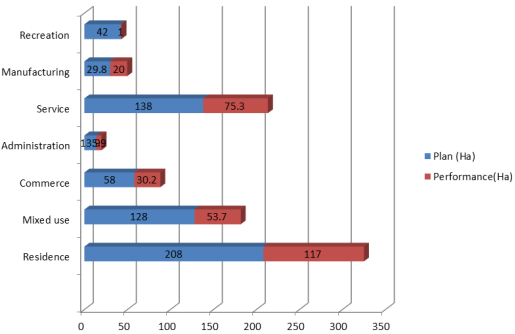
There is variation among the major land use categories in terms of performance in area within ten years period. As indicated in
figure 11 below, residential land use takes the lion share with the achievement of 56 percent and followed by social service, commerce, administration and mixed use with percentages of 55 percent, 52 percent, and 42 percent respectively. On the other hand, manufacturing, and recreation with area of 20 percent, 2 percent are among the least implemented land use functions in terms of proportion of performance.
Figure 11. Proposed & Performance of selected Land use.
3.2.9. Comparison Between the Proposed Land & Performance of Selected Land Use
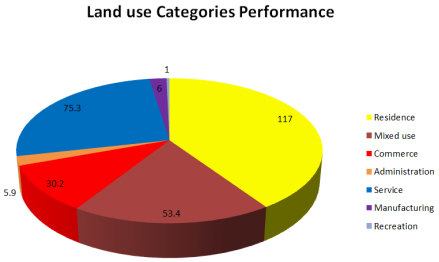
When comparison is made between the proposed land & Performance in terms of area, there is variation in level of achievement of major land use functions. As depicted in
Figure 12 below, residential land use stands in the first position with the achievement of 117 hectares and followed by social service, mixed use, commerce, and manufacturing with total areas of 75.4 hectares,53.4 hectares, 30.2 hectares, and 52 hectares respectively. On the other hand,, administration and recreation with total area of 5.9 hectares, and 1 hectares are among the least implemented land use functions in terms of area of performance.
Figure 12. Performance comparison for different land uses in terms of Area (ha).
3.3. Thematic Analysis
Discussion with key informants of Yirba municipality pointed out that the 2012 plan was not accompanied with action plan and phasing plan, the absence of complete evaluation and monitoring activity before conducting the new plan. The experts elaborated that it was difficult to implement the basic plan especially, there were land use functions such as artificial pond (special function) in different places of the town. Due lack of information (action plan) on how and when to implement those artificial ponds, the municipality eventually changed the stated land uses to other uses. Similarly, key informants revealed that one of the bottlenecks for effective implementation of land use was that they had no information on the method clearing, developing, and making ready for the urban land for various purposes.
3.4. Examining the Conformity of Land Use Plan of Yirba Town Against Standards
3.4.1. Comparison of Proposed Land Uses and Standard
The purpose of comparison of the proposed plan of 2022 was used. An urban Planning standard, prepared by Ministry of Infrastructure and Urban Development by 2012 was employed for comparing the land use function for medium town. Accordingly, the standard sets the proportion of areas in percent is indicated
Table 1 below. The proportion for Residence ranges from 55-60%, Commerce 3-10%, administration 2-5%, Social Service 5-10%, Manufacturing and Micro & small scale establishment 5-10%, Infrastructure, utilities and Transportation 15-25% and Green, recreation, sports and environmental issues 15-20%. The information concerning percentage composition for the major land uses was gathered from the socioeconomic text book of Sidama Regional Urban Planning Institute. Accordingly, Residence with mixed use ranges from 29%, Commerce 6.1%, administration 0.7%, Social Service 6.1%, Manufacturing and Micro & small scale establishment 5.8%, Infrastructure, utilities and Transportation 17.5% and Green, recreation, sports and environmental issues 33.4%. Four out of seven land uses categories are conformity with urban planning standards and three of them are non-conformity to the standard.
Table 1. Proportion of land use plan of Yirba Town (2022) against Urban Planning standards of Ethiopia.
| Land use category | Ethiopian Urban Planning standards for Medium town (2012) | Proposed plan (Ha) | Percentage of Proposed plan (as compared from areas to be used for built up area) |
1 | Residence | 55-60% | 657.8 | 45% |
2 | Commerce And business | 3-10% | 135 | 9.3% |
3 | Administration | 2-5% | 15.5 | 1.1% |
4 | Social Service | 5-10% | 134.6 | 9.2% |
5 | Manufacturing & Storage | 5-10% | 129.2 | 8.9% |
6 | Infrastructure, utilities and Transportation | 15-25% | 385.8 | 26.5% |
| Total area for construction (Built up Area) | | 1457.9 | 100 |
7 | Green, recreation, sports and environmental sensitive area | 15-20% | 734.1 | |
7.1 | Recreation, Greenery and Open space | | 162.3 | 22.1% |
7.2 | Forest and areas to be rehabilitated | | 219.6 | 29.9% |
7.3 | Urban Agriculture | | 262.3 | 35.7% |
7.4 | Reserve Area | | 89.9 | 12.2% |
| Grand Total | | 2192 | 100 |
| Percentage of Proposed plan (as compared from grand total area) | Difference in percent against the standard (by taking the lower limit) | Difference in percent against the standard (as compared from grand total area) |
1 | 29% | -10% | -26% |
2 | 6.1% | Acceptable | Acceptable |
3 | 0.7% | -1% | -1.3% |
4 | 6.1% | Acceptable | Acceptable |
5 | 5.8% | Acceptable | Acceptable |
6 | 17.5% | +1.5% | Acceptable |
| 66.6% | | |
7 | 33.4% | +14.4% | above from the higher limit |
7.1 | 7.4% | | |
7.2 | 10% | | |
7.3 | 11.9% | | |
7.4 | 4.1% | | |
Source: Ministry of Infrastructure and Urban Development (MUDC, 2012) & Sidama Regional Urban Planning Institute (text)
From the major land use categories greater variation is observed for residence. According to the standard the minimum land use for residence is urged to be 55 percent. By multiplying the 55 percent by total area of the town (2192Ha), the area requirement for residence is found to be 1,205.6 hectares. The proposal for residence including mixed use for the town is 657.8 hectares. When compared with the standard and existing realty a total of 548 hectares or 26 percent of land is not included. This infers the proposed residence is intended to serve only 50 percent of the population. From the percentage composition set by Ministry of Infrastructure and Urban Development it is clearly indicated that new plan is prepared mainly to fill the housing demand and the standard urges more than half of the total area should be assigned for residence while making land use plan. Besides, the proportion of land for administration shows decrement as compared with standard. The percentage of land for administration is only 0.7% of the total area.
The proportion of land for Infrastructure, utilities and Transportation, exceed by 1.5 percent or 3.2 hectares of land. Similarly, the percentage composition for Green, recreation, sports and environmental affairs constitute 33.4percent and when compared with standard the difference is 14.4percent or 306 hectares of land.
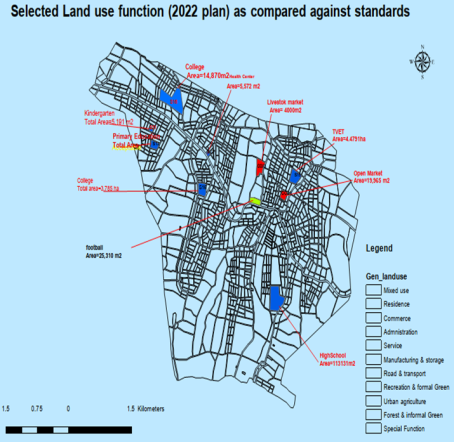
3.4.2. Plot Standard of Selected Land Uses for Medium Town
The plot standard of specific land uses from the general category are selected and analyzed against the land use planning standard. Open market and Livestock market are chosen from commercial land use category. Kindergarten, Primary education, Secondary education, TVET (post-secondary school) and College are selected from social service category. Football field (stadium) is selected from recreation category of 2022 land use plan. To evaluate the conformity of detail land uses, GIS is employed and the result of analysis of depicts that out of the elven detail land use classifications only two land uses (i.e. TVET and Primary education) are prepared in accordance with the planning standard.
Table 2. Plot standard of selected specific land uses for Medium town (2022).
S/N | Component of selected land use/Level of service | Space requirement (Standard) | Proposed plot area of Yirba Town plan | Gap Analysis |
1 | Open market | 0.25ha-0.5ha | 1.9965ha | +1.4ha |
2 | TVET (post-secondary school) | 2.5-6ha | 4.4791ha | Accepted |
3 | Post-secondary school (College1) | 2.5-6ha | 14.8707ha | 8.7ha |
4 | Post-secondary school (College2) | 2.5-6ha | 3.785ha | Accepted |
5 | Livestock market | 0.62 ha.0.83ha | 4ha | +3.48ha |
6 | Kindergarten | 500m2-3000m2 | 5,191 m2 | +2191 m2 |
7 | Primary education | 1.5ha-2.5ha | 2.3883ha | Accepted |
8 | Secondary education | 3ha -6ha | 11.3131ha | +5.3131ha |
9 | Health center | 2,000m2-5000m2 | 5,572 m2 | +572 m2 |
10 | Primary hospital | 5,000m2-10,000m2 | 15,027 m2 | +5,027 m2 |
11 | Woreda level football field | 11,935 m2 | 25,310 m2 | +13,325 m2 |
| Total Gap & implication | | | 21ha (210,000 m2) |
Source: Ministry of Infrastructure and Urban Development (2002) & GIS computation
In comparison to the standard for each specific land use, secondary school, the livestock market, and the open market have excess areas of 5.3 hectares, 3.48 hectares, and 1.4 hectares, respectively. There are 18.5 hectares of land area reserved for colleges.
Figure 13. Total Areal Gap for observed from specific land uses (2022) & planning implications.
It is clear that the goal of urban planning is to make the best use possible of available space. Urban planning is characterized by the avoidance of waste in the distribution of land among different uses. This section's main goal is to draw attention to how much urban land (a resource) is wasted during the planning process. As indicated in
table 3 below, an investigation revealed that 21 hectares of land had been wasted, which was not in compliance with the standards. 21.0 hectares (210,000 m
2) of land, if used effectively, will be crucial to addressing the present urban problems. For example, with horizontal development, 21.0 hectares of land might provide enough space for 875 housing units in addition to the area needed for utilities. Additionally, the 21.0 hectares of land are sufficient to house 21 hospitals, 42 health centers, 8 primary schools, and 70 kindergartens.
Table 3. Total Areal Gap & planning implications.
S/N | Land budgeting of 310,000 m2 |
1 | Residence | Kindergarten | Primary school | Health Center | Hospital |
2 | If a plot areal standard is 200m2 & 15% (31.05ha) is allocated for street & utility | 79 | 8 | 42 | 21 |
3 | 15*21.1ha=3.5ha |
4 | 21-3.5ha=17.5h |
5 | 266,500 m2 %200=875 |
6 | 875 housing units | 70 Kindergartens | 8 Primary school | 42Health Center | 21 Hospital |
Source: own computation
The amount of land wasted during land use planning is seen in the above table. The major purpose of standards and norms is to direct the process of urban planning and implementation. Breaking from the norm entails using the limited urban land irresponsibly, which is the same as unplanned development.
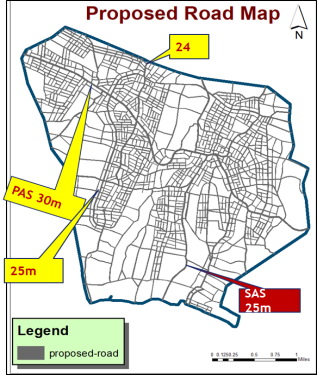
3.4.3. Street Design and Standard
Urban planning standard denotes the Street Hierarchy, width as well as Design Speed of cars on the stated streets. The four street Hierarchies such as Principal Arterial streets, Sub Arterial streets, Collector streets and Local streets are kept in land use plan of the project town. As far as the width of street is concerned, standard urges the width of Principal Arterial streets in core or central area to be 25 meter wide and in expansion area 30 meters. For Sub l Arterial streets in core area to be 20 meter wide and in expansion area 25 meters. For Collector streets the wide in core area to be 20 meter and in expansion area 25 meters. For Local streets the wide in core area to be up to 4 meter and in expansion area 12 meters.
Table 4. Proposed Street width of Yirba town against Standard (2022).
S/N | Street Hierarchy | Standard (m) | Proposed street width (m) | Difference of street width (meter) as compared to the standard | Design Speed (Km/hr) of car |
1 | Principal Arterial street (PAS) | 25-30 (core & expansion area) | 30 | Acceptable | 40-60 |
2 | Sub Arterial street (SAS) | 20-25 | 25 | Acceptable | 30 |
3 | Collector street (CS) | 11-20 | 15-20 | Acceptable | 20-30 |
4 | Local street (LS) | 4-12 | 10-12 | Acceptable | Not Permitted |
Source: Ministry of Infrastructure and Urban Development & GIS computation
As it is revealed on the table above, the four Street Hierarchies are kept while proposing the land use plan. Besides, the width of Principal Arterial streets, Sub Arterial streets, Collector streets and Local streets are designed in accordance to the standards set by Ministry of Infrastructure and Urban Development.
3.4.4. The Level of Consistence Between Socioeconomic Findings and Land Use Plan
The degree of coherence among the land use and socioeconomic teams is one measure of the quality of the plan. Urban planning is regarded to be a collaborative field. The outputs of surveying and socioeconomic findings serve as an input for land use plan. The quality of land use planning is directly impacted by the socioeconomic study and base map quality. It may be inferred that a high degree of consistency between the land use planning, socioeconomic, and surveying teams enhances the likelihood that the output plan and its supporting documentation will be simple to implement.
Figure 14. Proposed road for Yirba town.
To know the level of harmony between socioeconomic theme with that of land use plan certain basic issues are selected and crosschecked by using the text document of the project town (2022). Accordingly, the critical analysis findings denote there is variation between two themes in terms of the decision on the location and the number of open market, mini market, Primary school, Health center and Higher education. For instance changing the location of open market will completely shifts the economic growth direction of the town and affects the lives of the people residing in places closer to open market. On the other hand, decision of Higher education is one of the variations between two teams. Higher education demands relatively large space and is done based on government decision rather than land use planning. The implication here is before coming to decision on such issues there should be a number of discourses with the people. Besides, There should be an agreement between experts of socioeconomic and land use planner on the stated issues.
Table 5. The level of consistence between socioeconomic findings and land use plan.
S/N | Major Issues | Existing condition | Future requirement (up 2031) | |
Socioeconomic finding | Land use inventory | Socioeconomic recommendation | Land use recommendation | level of compatibility |
1 | Open market | 1 | 1 | Need to be relocated | No need of relocation | Inconsistence |
2 | Gulit (mini market) | 1 | Not stated | Additional mini market in central part of the town | Not stated/no need | inconsistence |
3 | Livestock market | 1 | 1 | Need relocation | Need relocation | consistence |
4 | Kindergarten | 1 | 4 | 2 additional is needed | 2 | consistence |
5 | Primary school | 3 | 9 | 1 is needed | No need | inconsistence |
6 | High school | 1 | 1 | 1 is needed | 1 | consistence |
7 | TVET | Not stated | 1 | No need | No need | consistence |
8 | Higher education (college) | Not stated | Not stated | Not stated/ No need | 1 | inconsistence |
9 | Hospital | Not stated | 1 | Not stated/no need | No need | consistence |
10 | Health center | 1 | 1 | No need | 1 | inconsistence |
11 | Hospital | 1 | 1 | No need | No need | consistence |
12 | Slaughterhouse | 1 | 1 | No Need | No need | consistence |
13 | Waste disposal site | 0 | 0 | Appropriate site is recommended | New site is recommended | consistence |
14 | Youth center | Not stated | 1 | Need of reserving land | Additional recommended | consistence |
15 | Public libraries | Not stated | 0 | Need of reserving land | 2 | consistence |
16 | Public square | No | No | Need of reserving land | 1 | consistence |
Level of consistency | 11/16=68% |
Sources: Sidama Region Plan institute Yirba Town Socioeconomic Document (2022) & own computation
The
table 5 above shows, there is agreement among socioeconomic and land use team experts regarding the spatial arrangement and number of facilities, including municipal services like waste disposal and livestock markets. Similarly, there is agreement regarding the need for social services like public squares, public libraries, youth centers, hospitals, TVET, kindergartens, and primary schools. On the other hand, there are differences in the location and quantity of services like higher education, elementary schools, minimarkets, open markets, and health centers between the socioeconomic and land use teams.
The level of consistence on selected Social and Municipal Services is 68 percent. This implies 11 out of 16 social and municipal services and utilities are compatible.
Urban planning aims to guide the town's overall growth and development while enhancing the quality of life for its residents. This objective is achieved through inclusive planning, which calls for the urban community to be invited to actively participate in the planning process and for community comments to be taken into account when creating proposals that adhere to established planning standards and norms. Moreover, because they are working with a shared outcome (a plan), the socioeconomic and land use planning specialists must collaborate closely.
3.5. Discussion on Performance and Conformance Evaluation
3.5.1. Discussion on Performance Evaluation
The result of the analysis reveals 117 hectares of land was implemented. In other words a total of 199 blocks were covered by residential land functions. About 49.4 percent of the total area reserved for residence was implemented. Before ten years (.i.e. before 2012) the existing residential land use was 28.9 hectares. When 28.9 hectares of land was subtracted with 117 hectares of land the result figure is 89 hectares. Therefore, the actual implemented residential land use within the past ten years (2012-2021) was 89 hectares of land. The figure point out the achievement of residential land use is very small as compared to the proposal. The thematic analysis discloses the absence of full-fledged plan evaluation so far made before preparing new urban plan for the stated town.
Claims planners rarely assess their plan, at least in a formal manner.
| [2] | Brody, S. D., Highfield, W. E., & Thornton, S. (2006). Planning at the urban fringe: An examination of the factors influencing nonconforming development patterns in southern Florida. Environment and Planning B: Planning and Design, 33(1), 75–96. https://doi.org/10.1068/b31093 |
[2]
Argues new plans are accepted without any effort at evaluating how well they are working toward stated goals and objectives.
Areas occupied by mixed use are 53.4 hectares. A total of 68 blocks of the land use are covered by mixed use. About 41.7 percent of the total land area reserved for mixed use was implemented. The total area covered by existing commerce and business activities on the ground is 30.2 hectares. Besides, a total of 47 blocks are currently serving for commerce and business activities. When compared to the proposal, the proportion of commercial land that is implemented accounts 52 percent. The land inventory result indicates 5.9 hectares of land is presently covered with administrative purpose. Besides, 12 blocks were used for the stated service. This suggests that the proportion of implemented administrative land shares 42 percent. The proposed land for Manufacturing and storage was 29.8 hectares by the year 2012. The actual land covered by manufacturing and storage is 6 hectares.
| [13] | Segura, S., & Pedregal, B. (2017). Monitoring and evaluation framework for spatial plans: A Spanish case study. Sustainability (Switzerland), 9(10). https://doi.org/10.3390/su9101706 |
[13]
acknowledged to enhancing the effectiveness of urban plans, a regular base evaluation is essential.
| [7] | Laurian, L., Crawford, J., Day, M., Kouwenhoven, P., Mason, G., Ericksen, N., & Beattie, L. (2010). Evaluating the outcomes of plans: Theory, practice, and methodology. Environment and Planning B: Planning and Design, 37(4), 740–757. https://doi.org/10.1068/b35051 |
[7]
argued the effectiveness of plans needs to be indicated through their performance.
| [8] | Lyles, W., Berke, P., & Smith, G. (2016). Local plan implementation: assessing conformance and influence of local plans in the United States. Environment and Planning B: Planning and Design, 43(2), 381–400. https://doi.org/10.1177/0265813515604071 |
[8]
found that the focus of performance evaluation is to examine whether plan is playing its role.
A total of 75.4 hectares of land are covered by social service. When compared with the proposal, 55 percent of land for social service is translated on the ground. The result of land inventory revealed that out of the total land covered by social service such as religious institutions account 34 percent, educational institutions share 33 percent, municipal services comprise 29.7 percent and health institutions account the remaining 3 percent.
The land inventory on the existing recreational areas indicates that 9,731 meters square land is occupied by the stated land use. The proportion of land that is occupied by recreation accounts only 2 percent. One of the basic domains of Sustainable development in urban space is the consideration of environment such as recreational areas. Green development has dual role in urban space. One is balancing the local environment and biodiversity.It can also serve as a place for recreation, source for food, and integrate the connection of human being with the natural environment. Although. Open spaces and green areas are vital for urban, the actual proportion of such service on the ground is very low for the town study town.
| [19] | UN-Habitat. (2018). Urban planning for city leaders. |
[19]
Argued good planning is measured by the success and outcomes of its implementation.
Thematic analysis pointed out that the plan was not accompanied with action plan and phasing plan. Action plan make clear in advance how much budget, personnel and technical equipment will be required to properly implement the project. Phasing plan determines the growth direction and the type of projects permitted for specified block of the town. Implementing land use plan without action plan and phasing plan is similar to sailing without a compass. To this end,
claimed that urban centers create value when they are well-planned and managed. The experts elaborated that it was difficult to implement the basic plan especially; there were land use functions such as artificial ponds in different places of the town. Due to lack of information on how and when to implement those artificial ponds, the municipality eventually changed the stated land uses to other uses.
3.5.2. Discussion on Conformance Evaluation
The thematic analysis section indicated the absence of conformance evaluation especially at the stage of plan preparation. Even though it is overlooked, the conformance evaluation that is conducted prior to the approval of the proposed plan is crucial for preventing the waste of urban land and significantly helps for proper implementation.
| [8] | Lyles, W., Berke, P., & Smith, G. (2016). Local plan implementation: assessing conformance and influence of local plans in the United States. Environment and Planning B: Planning and Design, 43(2), 381–400. https://doi.org/10.1177/0265813515604071 |
[8]
Contended crucial use for assessing plan execution at earlier stages is to evaluate the principles and other actions of a plan are well stated to enhance for future implementation.
Acknowledge the need for ex-anti evaluation of the proposed plan and revealed at this stage it's important to consider if the plan allows enough space for changes in the future and invites input from a variety of public segments.
The result of analysis section indicated that, from the total proposed land uses of the project town, the share of for residential use is 29%, commercial use is 6.1%, administrative purposes is 0.7%, social service is 6.1%, manufacturing and micro and small-scale establishments is 5.8%, infrastructure, utilities, and transportation is 17.5%, and for green space, sports, recreation, and environmental concerns is 33.4%. Three of the seven land use categories do not adhere to urban planning standard whereas four out of seven land uses categories are conformity with urban planning standard. This suggests that, other things being constant, the full implementation the stated land use functions will not achieve the ultimate goal of urban planning since it deviates from the criteria set for the town.
| [13] | Segura, S., & Pedregal, B. (2017). Monitoring and evaluation framework for spatial plans: A Spanish case study. Sustainability (Switzerland), 9(10). https://doi.org/10.3390/su9101706 |
[13]
Argue that necessity of evaluation to determine whether a program is successful in achieving its ultimate goals. According to
| [16] | Talen, E. (1997). Success, failure, and conformance: An alternative approach to planning evaluation. Environment and Planning B: Planning and Design, 24(4), 573–587. https://doi.org/10.1068/b240573 |
[16]
, Planning theory and empirical research should prioritize understanding the reasons behind planning successes and failures.
As far as the plot standard of is concerned, the result of analysis depicts that out of the elven detail land use classifications, only two land uses (i.e. TVET and Primary education) are prepared in accordance with the planning standards. Specific land uses such as secondary school, livestock market, and open market have excess areas of 5.3 hectares, 3.48 hectares, and 1.4 hectares, respectively. One primary goal of planning theory and empirical research should be to understand why planning fail or succeeds
| [17] | Tan, A. (2009). Liveable cities: The Benefits of Urban Environmental Planning. World Cities: Achieving Liveability and Vibrancy, 155–172. |
[17]
.
The results of the analysis show there is disagreement in the location and quantity of services like higher education, elementary schools, minimarkets, open markets, and health centers between the socioeconomic and land use teams. However, the existence of disagreement on the number and location of even in one of the service have great impact on the development trend of the town and fairness of service distribution. Conformance Evaluation determines how well the urban planning and implementation process meet the Urban Planning standard. This implies good achievement in allocation of plots of land for different functions may not be good from conformance point of view.
| [2] | Brody, S. D., Highfield, W. E., & Thornton, S. (2006). Planning at the urban fringe: An examination of the factors influencing nonconforming development patterns in southern Florida. Environment and Planning B: Planning and Design, 33(1), 75–96. https://doi.org/10.1068/b31093 |
[2]
Contends any deviation from the adopted plan's goals and objectives would be viewed as a failure from the perspective of conformity.
An independent entity (which is not engaged in plan preparation team) that is responsible for technically evaluating the plan making process is advised to be functional to minimize the inconsistences in relation to planning. The goal of this entity is crosschecking or assessing the conformity of the proposed plan with planning principles and standards. Practically such technical assessment is ignored.
| [19] | UN-Habitat. (2018). Urban planning for city leaders. |
[19]
agrees that trustworthy institution, among others, is essential for plan implementation. The urban plan preparation and implementation strategy of Ethiopia formulated by Ministry of Urban development and Construction (2014) supports the notion and states that the existing monitoring, evaluation and feedback system focused only on implementation of the plan.