Research Article | | Peer-Reviewed

Controlling the Transmission Dynamics of Monkey Pox Infection: A Mathematical Model Approach

Received: 3 August 2026     Accepted: 17 August 2026     Published: 18 September 2026
Views:       Downloads:
Abstract

The spread of Monkey Pox (Mpox) poses significant public health challenges, requiring effective intervention strategies to mitigate its impact. This study propose a mathematical model to explore the transmission dynamics of Mpox and assess the impact of quarantine as a control measure. The model divides the population into compartments representing Susceptible, Exposed, Infectious, Quarantined, and Recovered individuals. The system of ordinary differential equations describing the dynamics of the infection were derived. The equilibrium states of the model equations: Disease free equilibrium and Disease endemic equilibrium states were obtained. The stability analysis of the disease free equilibrium was analyzed and found it to be stable. The reproduction number (R0) was obtained and its numerical value was computed. Numerical simulations were performed to investigate how varying quarantine rates affect the progression of the disease across these compartments. The simulations explore the implications of different quarantine intensities on the number of infectious and exposed individuals over time. The results obtained indicate that quarantine can effectively reduce the transmission rate of the infection. Also, it revealed the potential of quarantine to reduce the disease spread and alleviate its overall impact on the population. The findings offered a framework for understanding the dynamics of Mpox transmission and assist public health authorities in designing effective intervention strategies.

Published in American Journal of Applied Mathematics (Volume 14, Issue 5)
DOI 10.11648/j.ajam.20261405.12
Page(s) 287-294
Creative Commons

This is an Open Access article, distributed under the terms of the Creative Commons Attribution 4.0 International License (http://creativecommons.org/licenses/by/4.0/), which permits unrestricted use, distribution and reproduction in any medium or format, provided the original work is properly cited.

Copyright

Copyright © The Author(s), 2026. Published by Science Publishing Group

Keywords

Monkey Pox Infection, Equilibrium Point, Basic Reproduction Number, Numerical Simulation, Mathematical Model

1. Introduction
Mpox, formerly known as monkeypox, is a viral zoonotic disease caused by the Mpox virus, which belongs to the Orthopoxvirus genus in the Poxviridae family. The disease was first identified in laboratory monkeys in 1958, but the first human case was not reported until 1970 in the Democratic Republic of the Congo . Historically, Mpox was endemic to Central and West Africa, but recent outbreaks in other parts of the world have raised global concern . Mpox is primarily transmitted through direct contact with infected animals such as rodents and primates, though human-to-human transmission is possible through respiratory droplets, contact with skin lesions, or exposure to contaminated surfaces. Typical symptoms include fever, headache, muscle aches, rashes, and swollen lymph nodes . The symptoms of Mpox usually appear in stages. Fever is often the first sign, followed by headaches, muscle aches, and back pain. One of the hallmark symptoms is lymphadenopathy, which involves swelling of the lymph nodes. As the disease progresses, a distinctive rash emerges, starting as flat lesions (macules) that evolve into raised bumps (papules), fluid-filled blisters (vesicles), and eventually pustules before forming scabs. The incubation period of Mpox typically ranges from 5 to 21 days, and the disease usually lasts between 2 to 4 weeks. While most cases are mild and resolve on their own, more severe cases can occur, though these are less common. Currently, there is no specific antiviral treatment for Mpox. Management of the disease focuses on supportive care to relieve symptoms and prevent complications. In more severe cases, antiviral drugs such as tecovirimat or brincidofovir may be considered under emergency use provisions. Mpox has evolved over the years, particularly in its epidemiology. Originally endemic to Central and West Africa, with cases reported in countries like Nigeria, the Democratic Republic of Congo (DRC), and Cameroon, its spread has expanded globally. Human activities such as deforestation and increased interaction with wildlife, particularly rodents and primates, have contributed to its rise . Additionally, immunity to orthopoxviruses has declined due to the cessation of routine smallpox vaccination, leaving younger populations more susceptible . The transmission dynamics of Mpox, much like other zoonotic diseases, involve contact with infected animals and human-to-human transmission via respiratory droplets, bodily fluids, or contaminated surfaces . Studies have shown that human-to-human transmission is less efficient compared to animal-to-human transmission, though it increases in crowded settings where close contact is more frequent . A significant factor in controlling Mpox outbreaks is the role of public health interventions, which include isolation of infected individuals, contact tracing, vaccination, and awareness campaigns. Vaccination remains a critical tool, with the smallpox vaccine providing cross-protection . Quarantine measures and ring vaccination, where contacts of confirmed cases are vaccinated, have proven effective during outbreaks. Mathematical modeling is a powerful tool in understanding the spread of infectious diseases like Mpox. Traditional models like the SIR (Susceptible-Infected-Recovered) and SEIR (Susceptible-Exposed-Infected-Recovered) have been widely used to simulate disease dynamics . For Mpox, the SEIQR (Susceptible-Exposed-Infected-Quarantined-Recovered) model, which includes a quarantine compartment, is particularly useful in evaluating the effects of quarantine and other public health measures . The 2022-2023 global outbreak of Mpox highlighted the importance of rapid response strategies, including quarantine, vaccination, and contact tracing. Studies by Kozlov et al . emphasize the role of international travel and close contact in social settings in spreading the virus globally. The reproduction number (R0) for Mpox, which measures the average number of secondary infections, has been estimated to range between 1.1 and 2.4 in Nigeria, indicating the virus's capacity to sustain transmission in unvaccinated populations . This study seeks to explore the transmission dynamics of Mpox using the SEIQR model, focusing on how quarantine and other public health interventions can help control outbreaks. Also to investigate the key factors influencing Mpox transmission and assess the effectiveness of these interventions, particularly quarantine, in reducing transmission and managing outbreaks.
2. Model Formulation
This proposed model is based on the transmission dynamics of Mpox virus. The total population at time t, denoted by N(t) is subdivided into compartments that reflect the stages of Mpox infection and intervention. These compartments include Susceptible Individual S(t), Exposed Individual E(t), Infectious Individual I(t), Quarantined Individual Q(t), and Recovered Individual R(t). The Susceptible group represents individuals who are at risk of contracting Mpox. When exposed to the virus, they move to the Exposed compartment (E), where they are infected but not yet symptomatic or capable of transmitting the disease. The Infected compartment (I) consists of individuals who are actively contagious, while the Quarantined group (Q) includes those isolated to prevent further trans-mission. The Recovered compartment (R) includes individuals who have over-come the infection and are no longer infectious. The main intervention considered is quarantine, which aims to limit the spread of Mpox by isolating infected individuals, reducing their contact with the broader population. The effectiveness of quarantine is analyzed by modeling its influence on the transition rates between the susceptible, exposed, infected, and recovered groups.
2.1. Model Assumptions
The model assumptions are as follows:
1) A continuous influx of individuals into the population, contributing to the susceptible group.
2) Mpox transmission occurs through direct contact between susceptible and infected individuals.
3) After exposure, individuals enter a latent period where they are not yet infectious.
4) Quarantine is implemented to isolate infected individuals and reduce further transmission.
5) Recovered individuals are assumed to have immunity and do not become susceptible again.
6) Natural deaths and disease-induced deaths are accounted for, and the model assumes homogeneous mixing, where every individual has an equal chance of interacting with others.
Table 1. Model variables and their descriptions.

Variables

Descriptions

S(t)

Susceptible individual at time t

E(t)

Exposed individual at time t

I(t)

Infectious individual at time t

Q(t)

Quarantine individual at time t

R(t)

Recovered individual at time t

Table 2. Model parameters and their descriptions.

Parameters

Descriptions

Λ

Recruitment rate

ψ

Force of infection

τ

Transmission rate

μ

Natural death rate

σ

Progression rate from E to I

θ

Quarantine rate

δ

Disease-induced death rate

ρ

Recovery rate of I

γ

Recovery rate of Q

The system of equations describing the transmission dynamics of Mpox infection with quarantine as an intervention is given below;
dSdt = Λ-ψS-μSdEdt = ψS-σE-μEdIdt = σE-θ+δ+μ+ρIdQdt = θI-γ+μ+δQdRdt = γQ+ρI-μR(1)
Subject to the initial conditions S(0) = S0 > 0, E(0) = E0 ≥ 0, I(0) = I0 ≥ 0,
Q(0) = Q0 ≥ 0, R(0) = R0 ≥ 0.
where the force of infection ψ is given as
ψ =τIN, S(t) +E(t)+I(t)+Q(t)+R(t)
We analyze the system of differential equations governing the transmission dynamics of the disease. The analysis will focus on identifying the equilibrium points, exploring the stability of the disease free equilibrium point, and also obtaining the reproduction number.
2.2. Equilibrium Points
To find the equilibrium point for the system, we set the right-hand side of (1) to zero. This involves solving the equations where the rates of change of each compartment are zero, yielding a set of algebraic equations. The solutions to these equations give the equilibrium values for the compartments in the model.
Λ-ψS-μS = 0 ψS-σE-μE = 0σE-θ+δ+μ+ρI = 0 θI-γ+μ+δQ = 0γQ+ρI-μR = 0(2)
2.2.1. Disease Free Equilibrium (DFE)
The Disease-Free Equilibrium (DFE) is a state where the number of infected individuals is zero. It represents a situation where there is no disease in the population. Hence, I0 = E0 = 0.
so we have from (IV) of the model equation.
Therefore, the disease free equilibrium is stated in equation (3).
E0 = S0 , E0, I0, Q0, R0 = Λμ, 0, 0, 0, 0,(3)
2.2.2. Endemic Equilibrium Point
The endemic equilibrium (EE) represents the state where the disease persists in the population at a constant level. In this equilibrium state, the number of infected individuals remains stable over time. For the Mpox model, the EE is found by setting the system’s derivatives to zero and solving for the equilibrium values of the compartments, based on parameters like transmission and recovery rates. This helps assess the long-term impact of the disease and the effectiveness of interventions.
The endemic equilibrium states are stated in equations (4-8).
S* = Λψ+μ(4)
E* = ψΛψ+μ(σ+μ)(5)
I* = σψΛψ+μ(σ+μ)(θ+δ+μ+ρ)(6)
Q* = θσψΛψ+μ(σ+μ)(θ+δ+μ+ρ)(γ+μ+δ)(7)
R* = σψΛμψ+μ(σ+μ)(θ+δ+μ+ρ)γθγ+μ+δ+ρ(8)
2.3. Stability Analysis of Disease Free Equilibrium
The stability analysis of the Disease-Free Equilibrium (DFE) is crucial in determining whether a small perturbation in the system, such as the introduction of a few infected individuals, will lead to an outbreak or whether the system will return to a disease-free state. This analysis involves examining the eigenvalues of the Jacobian matrix at the DFE or using the next-generation matrix approach to assess the stability conditions.
The eigenvalues can be obtained by solving the characteristic equation |J0λI| = 0. That is,
J0 =f1Sf1Ef1If1Qf1Rf2Sf2Ef2If2Qf2Rf3Sf3Ef3If3Qf3Rf4Sf4Ef4If4Qf4Rf5Sf5Ef5If5Qf5R (9)
Where,
f1= Λ-ψS-μSf2 = ψS-σE-μEf3 = σE-θ+δ+μ+ρIf4 = θI-γ+μ+δQf5 = γQ+ρI-μR(10)
Thus, |J0 λI| = 0 is given as
=-μ-λ0-τS0N0000-σ+μ-λτS0N0000σ-k-λ0000θ-γ+μ+δ-λ000ργ-μ-λ(11)
where, = θ + δ + µ + ρ, and thus, the eigenvalues are given in (12).
λ1 = -µ λ2 = -σ + µ λ3= -(θ + δ + µ + ρ)λ4 = -γ + µ + δ λ5= -µ  (12)
The eigenvalues obtained from the Jacobian matrix at the Disease-Free Equilibrium (DFE) are all strictly negative, indicating that the system is locally stable. This indicates that any small deviations from the DFE will diminish over time, preventing the disease from spreading and allowing the system to settle back into the disease-free state.
2.4. Reproduction Number
The reproduction number, often denoted as R0 is a key metric in epidemiology that indicates the average number of secondary infections produced by a single infected individual in a completely susceptible population. It helps determine the potential for disease spread and whether an outbreak can be sustained. The basic reproduction number can be determined using the next-generation matrix approach basically on the disease compartments E(t) (exposed) and I(t) (infectious).
f=ψS0(13)
and
V=μE+σE-σE+(μ+δ+θ+ρ)I(14)
recall that ψ=τIN, thus, we have;
f=τISN0(15)
then we find F and V from fand V respectively, we have
F =N0(0)-τI0S0(N0)2N0τS0-τI0S0(N0)200(16)
but, I0=0, so we have
F =0τS0N000(17)
Similarly,
V =μ+σ0-σμ+δ+θ+ρ(18)
then we find the inverse of V,
V= μ+σμ+δ+θ+ρ (19)
V-1 = 1μ+σμ+δ+θ+ρμ+δ+θ+ρ0σμ+σ
V-1 = 1μ+σ0σμ+σμ+δ+θ+ρ1μ+δ+θ+ρ(20)
FV-1  = 0τS0N0001μ+σ0σμ+σμ+δ+θ+ρ1μ+δ+θ+ρ
FV-1 = στS0N0μ+σμ+δ+θ+ρτS0μ+δ+θ+ρN000(21)
next, we find the eigen value, |FV-1 - ϵ| = 0
FV-1-ϵ  = στS0N0μ+σμ+δ+θ+ρ -ϵτS0μ+δ+θ+ρN00-ϵ= 0(22)
So,
στS0N0μ+σμ+δ+θ+ρ -ϵ-ϵ=0
therefore,
ϵ1 = στS0N0μ+σμ+δ+θ+ρ
S0 = Λμ and ϵ2 = 0 recall that, hence,
ϵ1 = στΛμN0μ+σμ+δ+θ+ρ
and therefore, the reproduction number is given as
R0 =στΛμN0μ+σμ+δ+θ+ρ (23)
3. Numerical Analysis
The numerical simulation of the Mpox transmission model evaluates the dynamics of the disease, particularly focusing on the impact of quarantine as an intervention strategy. The model is fit and parameters estimated using the actual data of Mpox in Nigeria. Mpox has been endemic in Nigeria for many years, so fitting the model to Mpox in Nigeria will enable us to make future predictions of the disease dynamics.
Model Fitting and Parameter Estimation
The total population of Nigeria, based on the World Bank estimate, is 218,541,212. Also, the life expectancy for Nigeria is approximated to be 65 years. Therefore, the human natural death rate is set as:
μ = 165×365 = 0.000042 per day
Since the total Nigerian population is N(0) = 218,541,212, we set the human recruitment rate, Λ, as:
Λ = 218,541.2120.000042 = 5.2per day
The initial conditions used for the model fitting with Nigeria data are set as follows: S0 = 150,000, E0 = 10,000, I0 = 2,000, Q0 = 500, R0 = 1000.
Table 3. Parameter values for the Mpox transmission model.

Parameter

Value

Unit

Λ

5.2

day−1

µ

0.000042

day−1

ψ

0.35

day−1

σ

0.071

day−1

θ

0.2

day−1

δ

0.005

day−1

ρ

0.048

day−1

γ

0.071

day−1

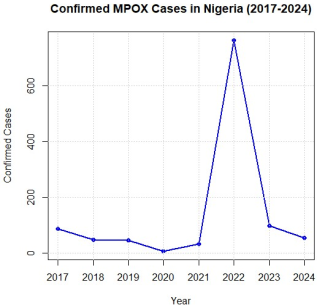
Figure 1. Plot showing the confirmed cases of Mpox in Nigeria.
Figure 1 shows the trend of confirmed Mpox cases in Nigeria from 2017 to 2024. The data illustrates the fluctuation in the number of cases.
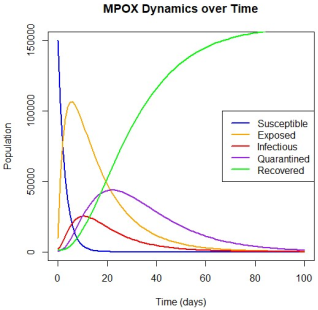
Figure 2. Mpox dynamics for a population of 150,000 over a period of 100 days.
Figure 2 shows the Mpox transmission dynamics over 100 days, illustrating how the susceptible population decreases rapidly as the disease spreads. The exposed and infectious populations initially rise but then decline as quarantine measures take effect and individuals recover. Over time, the number of recovered individuals surpasses the infectious population, indicating the effectiveness of interventions in controlling the outbreak.
The quarantined population grows gradually and peaks around day 40, showing the impact of isolating infectious individuals. Overall, the model captures the essential dynamics of Mpox, emphasizing the role of quarantine and recovery in reducing infection rates.
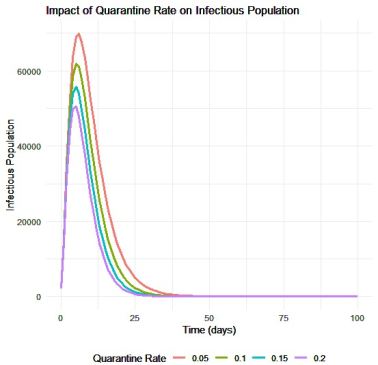
Figure 3. Varying quarantine level on Infectious population.
Figure 3 illustrates the impact of varying quarantine rates on the infectious population over a period of 100 days. As seen in the plot, increasing the quarantine rate from 0.05 to 0.2 significantly reduces the peak infectious population of Mpox. Higher quarantine rates lead to a quicker decline in infectious individuals, indicating more effective disease control. As stricter quarantine measures are implemented, the time to reach the peak also extends, showcasing a slower spread of the disease.
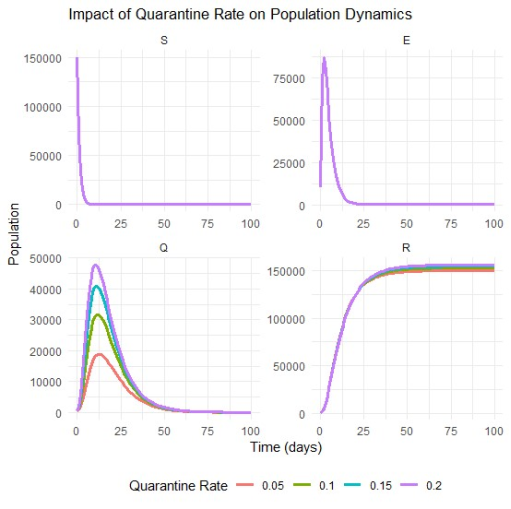
Figure 4. Varying level of quarantine rate on population dynamics.
Figure 4 shows the effects of varying quarantine rates on different compartments within the Mpox transmission model. The results highlight that while the quarantine measures significantly affect the dynamics of the quarantined compartment, they have a relatively minimal impact on the susceptible and exposed compartments. The sustained recovery rates across all quarantine levels emphasize the importance of effective quarantine strategies to manage the spread of Mpox while ensuring that a substantial portion of the population ultimately recovered. These insights can inform public health policies regarding the implementation of quarantine measures to control infectious diseases.
4. Conclusion
This study presents a Mathematical analysis of the impact of quarantine on the transmission dynamics of Mpox infection. The population was divided into five compartments namely Susceptble, Exposed, Infectious, Quarantine and Recovered. The system of equations describing the disease dynamics in the population was derived. The two equilibrium states of the system: Disease free equilibrium and endemic equilibrium was obtained. The stability analysis of the disease free equilibrium was analyzed and found to be stable. The reproduction number (R0) was obtained and computed numerically. R0>1, this indicates that the disease will persist in the population except through interventions such as quarantine, vaccination, isolation and treatment. Numerical simulation was carried out using Nigeria demographic data and verifiable parameter values. The graphical profile of the system responses were obtained. The results obtained indicate that quarantine can effectively reduce the transmission rate of the infection. Furthermore, by varying the level of quarantine, it was shown that increased quarantine measures significantly reduce the number of infectious individuals, demonstrating the effectiveness of this intervention in controlling disease spread.
Author Contributions
Patrick Olabanji Aye: Conceptualization, Data curation, Formal Analysis, Writing – review & editing
Felix Tunde Daodu: Funding acquisition, Resources
Olawale Johnson Olatubi: Investigation, Supervision
Ayokunle John Tadema: Software, Validation, Vizualization
Samuel Akinrolabu Jegede: Project administration, Writing – original draft
Conflicts of Interest
The authors declare no conflicts of interest.
References
[1] World Health Organization. Monkeypox. Retrieved from
[2] Bunge, E. M., Hoet, B., Chen, L., Lienert, F., Weidenthaler, H., Baer, L. R., and Steffen, R. The changing epidemiology of human monkeypox—A potential threat? A systematic review. PLoS Neglected Tropical Diseases, 2022, 16(2), e0010141.
[3] Ladnyj, I. D., Ziegler, P., and Kima, E. A human infection caused by monkeypox virus in Basankusu Territory, Democratic Republic of the Congo. Bulletin of the World Health Organization, 1972, 46(5), 593-597.
[4] Centers for Disease Control and Prevention (CDC). Monkeypox. Retrieved from
[5] Parker, S., Buller, R. M., and Damon, I. K. Monkeypox virus infections in small mammals as a model for human disease. Journal of General Virology, 2007, 88(11), 2985-2995.
[6] Rimoin, A. W., Mulembakani, P. M., Johnston, S. C., and Lloyd-Smith, J. O. Major increase in human Monkeypox incidence 30 years after smallpox vaccination campaigns cease in the Democratic Republic of Congo. Proceedings of the National Academy of Sciences, 2010, 107(37), 16262-16267.
[7] Sklenovska, N., and Van Ranst, M. Emergence of Monkeypox as the most´ important orthopoxvirus infection in humans. Frontiers in Public Health, 2018, 6, 241.
[8] Grantz, K. H., Lee, E. C., Velasquez, G. E., and Salomon, J. A. Monkeypox´ transmission dynamics in a novel setting: The 2003 US outbreak associated with imported prairie dogs. PLoS Neglected Tropical Diseases, 2020, 14(12), e0009218.
[9] Reynolds, M. G., Carroll, D. S., and Karem, K. L. Factors affecting the spread of Monkeypox: A new model for predicting outbreaks. Emerging Infectious Diseases, 2017, 13(9), 1379-1387.
[10] Fine, P. E., Jezek, Z., Grab, B., and Dixon, H. The transmission potential of Monkeypox virus in human populations. International Journal of Epidemiology, 1988, 17(3), 643-650.
[11] Kermack, W. O., and McKendrick, A. G. A contribution to the mathematical theory of epidemics. Proceedings of the Royal Society of London. Series A, Containing Papers of a Mathematical and Physical Character, 1927, 115(772), 700-721.
[12] Brauer, F. Mathematical epidemiology: Past, present, and future. Infectious Disease Modelling, 2017, 2(2), 113-127.
[13] Chowell, G., Nishiura, H., and Bettencourt, L. M. Comparative estimation of the reproduction number for the 1918 influenza pandemic in the United States, Japan, and Canada. Influenza and Other Respiratory Viruses, 2016, 11(1), 47-53.
[14] Kozlov, M., Faria, N. R., and Rambaut, A. Monkeypox virus outbreak 20222023: Global spread and containment strategies. Nature Medicine, 2023, 29(2), 134-137.
[15] Yinka-Ogunleye, A., Aruna, O., Dalhat, M., and Ogoina, D. Outbreak of human monkeypox in Nigeria in 2017-2018: A clinical and epidemiological report. The Lancet Infectious Diseases, 2019, 19(8), 872-879.
Cite This Article
  • APA Style

    Aye, P. O., Daodu, F. T., Olatubi, O. J., Tadema, A. J., Jegede, S. A. (2026). Controlling the Transmission Dynamics of Monkey Pox Infection: A Mathematical Model Approach. American Journal of Applied Mathematics, 14(5), 287-294. https://doi.org/10.11648/j.ajam.20261405.12

    Copy | Download

    ACS Style

    Aye, P. O.; Daodu, F. T.; Olatubi, O. J.; Tadema, A. J.; Jegede, S. A. Controlling the Transmission Dynamics of Monkey Pox Infection: A Mathematical Model Approach. Am. J. Appl. Math. 2026, 14(5), 287-294. doi: 10.11648/j.ajam.20261405.12

    Copy | Download

    AMA Style

    Aye PO, Daodu FT, Olatubi OJ, Tadema AJ, Jegede SA. Controlling the Transmission Dynamics of Monkey Pox Infection: A Mathematical Model Approach. Am J Appl Math. 2026;14(5):287-294. doi: 10.11648/j.ajam.20261405.12

    Copy | Download

  • @article{10.11648/j.ajam.20261405.12,
      author = {Patrick Olabanji Aye and Felix Tunde Daodu and Olawale Johnson Olatubi and Ayokunle John Tadema and Samuel Akinrolabu Jegede},
      title = {Controlling the Transmission Dynamics of Monkey Pox Infection: A Mathematical Model Approach},
      journal = {American Journal of Applied Mathematics},
      volume = {14},
      number = {5},
      pages = {287-294},
      doi = {10.11648/j.ajam.20261405.12},
      url = {https://doi.org/10.11648/j.ajam.20261405.12},
      eprint = {https://article.sciencepublishinggroup.com/pdf/10.11648.j.ajam.20261405.12},
      abstract = {The spread of Monkey Pox (Mpox) poses significant public health challenges, requiring effective intervention strategies to mitigate its impact. This study propose a mathematical model to explore the transmission dynamics of Mpox and assess the impact of quarantine as a control measure. The model divides the population into compartments representing Susceptible, Exposed, Infectious, Quarantined, and Recovered individuals. The system of ordinary differential equations describing the dynamics of the infection were derived. The equilibrium states of the model equations: Disease free equilibrium and Disease endemic equilibrium states were obtained. The stability analysis of the disease free equilibrium was analyzed and found it to be stable. The reproduction number (R0) was obtained and its numerical value was computed. Numerical simulations were performed to investigate how varying quarantine rates affect the progression of the disease across these compartments. The simulations explore the implications of different quarantine intensities on the number of infectious and exposed individuals over time. The results obtained indicate that quarantine can effectively reduce the transmission rate of the infection. Also, it revealed the potential of quarantine to reduce the disease spread and alleviate its overall impact on the population. The findings offered a framework for understanding the dynamics of Mpox transmission and assist public health authorities in designing effective intervention strategies.},
     year = {2026}
    }
    

    Copy | Download

  • TY  - JOUR
    T1  - Controlling the Transmission Dynamics of Monkey Pox Infection: A Mathematical Model Approach
    AU  - Patrick Olabanji Aye
    AU  - Felix Tunde Daodu
    AU  - Olawale Johnson Olatubi
    AU  - Ayokunle John Tadema
    AU  - Samuel Akinrolabu Jegede
    Y1  - 2026/09/18
    PY  - 2026
    N1  - https://doi.org/10.11648/j.ajam.20261405.12
    DO  - 10.11648/j.ajam.20261405.12
    T2  - American Journal of Applied Mathematics
    JF  - American Journal of Applied Mathematics
    JO  - American Journal of Applied Mathematics
    SP  - 287
    EP  - 294
    PB  - Science Publishing Group
    SN  - 2330-006X
    UR  - https://doi.org/10.11648/j.ajam.20261405.12
    AB  - The spread of Monkey Pox (Mpox) poses significant public health challenges, requiring effective intervention strategies to mitigate its impact. This study propose a mathematical model to explore the transmission dynamics of Mpox and assess the impact of quarantine as a control measure. The model divides the population into compartments representing Susceptible, Exposed, Infectious, Quarantined, and Recovered individuals. The system of ordinary differential equations describing the dynamics of the infection were derived. The equilibrium states of the model equations: Disease free equilibrium and Disease endemic equilibrium states were obtained. The stability analysis of the disease free equilibrium was analyzed and found it to be stable. The reproduction number (R0) was obtained and its numerical value was computed. Numerical simulations were performed to investigate how varying quarantine rates affect the progression of the disease across these compartments. The simulations explore the implications of different quarantine intensities on the number of infectious and exposed individuals over time. The results obtained indicate that quarantine can effectively reduce the transmission rate of the infection. Also, it revealed the potential of quarantine to reduce the disease spread and alleviate its overall impact on the population. The findings offered a framework for understanding the dynamics of Mpox transmission and assist public health authorities in designing effective intervention strategies.
    VL  - 14
    IS  - 5
    ER  - 

    Copy | Download

Author Information